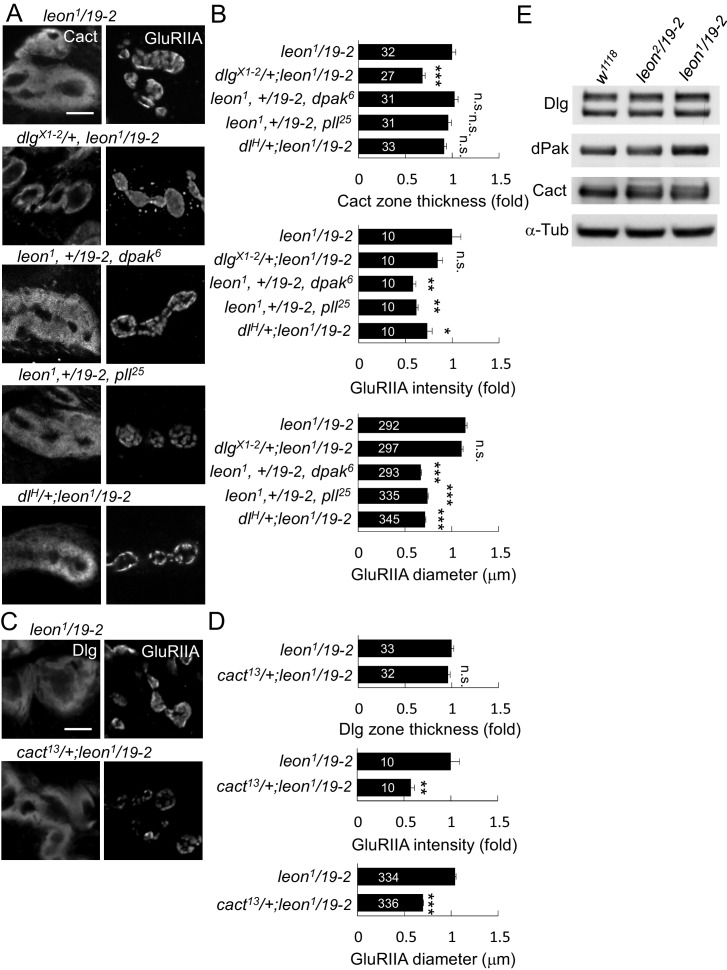
Figure 6. leon mutant phenotypes suppressed by reductions of gene dosages.
(A) Immunostaining images show suppression of Cact expansion in leon1/19-2 by dlgX1-2, and suppression of GluRIIA enlargement by dpak6, pll25 and dlH. (B) Bar graphs show means ± SEM of Cact-positive zone thickness and GluRIIA intensity and diameter. (C) Immunostaining images of NMJs for Dlg and GluRIIA show suppression of GluRIIA enlargement in cact13/+; leon1/19-2 as compared to leon1/19-2. (D) Bar graphs show means ± SEM of Dlg-positive zone thickness and GluRIIA intensity and diameter. Comparisons to leon1/19-2 were assessed by Student’s t tests with n.s. indicating no significance, * for p<0.05, ** for p<0.01 and *** for p<0.001. Scale bar, 5 μm. The detail statistic numbers are in Supplementary file 1. (E) Western blots show enhanced signals of Dlg, dPak and Cact in leon1/19-2 in comparison to w1118. α-Tub as control.


