Abstract
Rate manipulations can be used to study adaptation processes in the auditory nerve and brainstem. For this reason, rate effects on the click-evoked auditory brainstem response (ABR) have been investigated in many mammals, including humans. In this study, click-evoked ABRs were obtained in eight bottlenose dolphins (Tursiops truncatus) while varying stimulus rate using both conventional averaging and maximum length sequences (MLSs), which allow disentangling ABRs that overlap in time and thus permit the study of adaptation at high rates. Dolphins varied in age and upper cutoff frequency of hearing. Conventional stimulation rates were 25, 50, and 100 Hz and average MLS rates were approximately 50, 100, 250, 500, 1000, 2500, and 5000 Hz. Click peak-equivalent sound pressure levels for all conditions were 135 dB re 1 μPa. ABRs were observed in all dolphins, at all stimulus rates. With increasing rate, peak latencies increased and peak amplitudes decreased. There was a trend for an increase in the interwave intervals with increasing rate, which appeared more robust for the dolphins with a full range of hearing. For those rates where ABRs were obtained for both conventional and MLS approaches, the latencies of the mean data were in good agreement.
I. INTRODUCTION
One basic property of the auditory nervous system is response adaptation. In onset responses, such as the auditory brainstem response (ABR), adaptation can be studied by a number of stimulation paradigms, including the manipulation of stimulus rate (e.g., Jewett and Williston, 1971). In toothed whales, ABR adaptation has been investigated using rate manipulations (Ridgway et al., 1981) as well as the paired-click paradigm (e.g., Supin and Popov, 1995). Rate paradigms putatively allow the investigation of the relative refractory period of auditory nervous system neurons. In some species (cats: Buchwald and Huang, 1975; e.g., humans: Møller, 1994) we can assign specific generators to specific peaks, and it is thus possible to compare adaptation processes at different levels of the auditory nervous system. Even in those animal species where the generators of specific peaks are not known, it is reasonable to assume that the generator of the first ABR peak arises from the auditory nerve (assuming that peak is not click-polarity dependent and has a latency of less than several ms), and that the later ABR peaks come from more rostral (brainstem) regions of the auditory nervous system. Thus, by comparing rate-induced changes in latency and amplitude of later peaks to the first ABR peak, one can determine the relative sensitivity (i.e., larger latency increases and greater amplitude decrements) and whether adaptation is greater in the peripheral or central auditory system.
One challenge in studying rate effects using the ABR by conventional signal averaging approaches is that once the interstimulus interval is less than the duration of the ABR, then responses superimpose, making individual peak identification difficult or impossible (and also, parenthetically, potentially resulting in an auditory steady-state response: ASSR). As the click-evoked ABR in the bottlenose dolphin lasts approximately 6 ms, click rates above ∼160 Hz and interclick intervals less than 6 ms are precluded, and therefore investigation of adaptation processes that approach the absolute refractory period of auditory nerve and auditory brainstem neurons is not feasible. Eysholdt and Schreiner (1982) were the first to offer a solution to this dilemma by using stimuli which followed a maximum length sequence (MLS) with very brief interstimulus intervals and a deconvolution procedure that could disentangle overlapping responses. The MLS is one of a family of sequences whose circular autocorrelation function is an impulse. By stimulating with only a single polarity of the biphasic click stimuli in the MLS stimulation sequence, and cross-correlating the response to the MLS with the biphasic recovery sequence, the underlying (non-overlapped) ABR could be observed. Other stimulus sequences with similar properties as the MLS, such as Legendre sequences (Burkard et al., 1990), have been used to obtain ABRs. Other approaches have been proposed that circumvent some of the limitations of the MLS approach [e.g., quasi-periodic sequence deconvolution (Jewett et al., 2004); continuous loop averaging deconvolution (CLAD) (Ozdamar and Bohórquez, 2006); and randomized stimulation and averaging (RSA) (Valderrama et al., 2012)]. The MLS method has been investigated in a number of animal species (gerbils: Burkard, 1994; chickens: Burkard et al., 1994; cats: Burkard et al., 1996a,b; e.g., humans: Burkard and Sims, 2001). In the present investigation, we expand the animal species used to obtain MLS ABRs at high rates of stimulation to include a marine mammal possessing an auditory system that is highly refined for underwater echolocation: the bottlenose dolphin (Tursiops truncatus).
II. METHODS
A. Subjects and test environment
Eight adult bottlenose dolphins served as experimental subjects (Table I). For analysis, the dolphins were separated into two groups: “normal-hearing” (NH) and “hearing-impaired” (HI), based on their upper-cutoff of hearing, defined as the (interpolated) frequency at which their underwater, direct-field psychophysical thresholds reached 100 dB re 1 μPa.
TABLE I.
Summary of sex, age and high-frequency cutoff of hearing (where hearing threshold is 100 dB re 1 μPa).
| Subject ID | Sex | Age (years) | High-frequency cutoff (kHz) | Group |
|---|---|---|---|---|
| BLU | Female | 50 | 45 kHz | HI |
| COL | Male | 14 | 73 kHz | HI |
| FAT | Female | 34 | 140 kHz | NH |
| LOM | Female | 33 | 120 kHz | NH |
| OLY | Male | 31 | 66 kHz | HI |
| SAY | Female | 36 | 140 kHz | NH |
| TRO | Male | 23 | 140 kHz | NH |
| WHP | Male | 11 | 150 kHz | NH |
All testing was performed at the U.S. Navy Marine Mammal Program Facility located in San Diego, CA. Animals were brought into a floating netted enclosure located in San Diego Bay that measured 9 m × 9 m. Subjects placed themselves at a testing station that had an underwater plate that was approximately 0.7 m deep and was ∼1 m from the underwater sound projector.
B. Acoustic stimuli
Clicks were digitally generated, rectangular ∼5 -μs pulses that were converted to analog (1 MHz, PCIe-6361, National Instruments, Austin, TX), filtered (low pass at 200 kHz, 48-dB/octave Butterworth filter, 3 C module, Krohn-Hite Corporation, Brockton, MA), and attenuated using a custom-made attenuator. The clicks were amplified by a Krohn-Hite 7600M amplifier, and projected by an International Transducer Corp. ITC 5446 (Santa Barbara, CA) piezoelectric transducer.
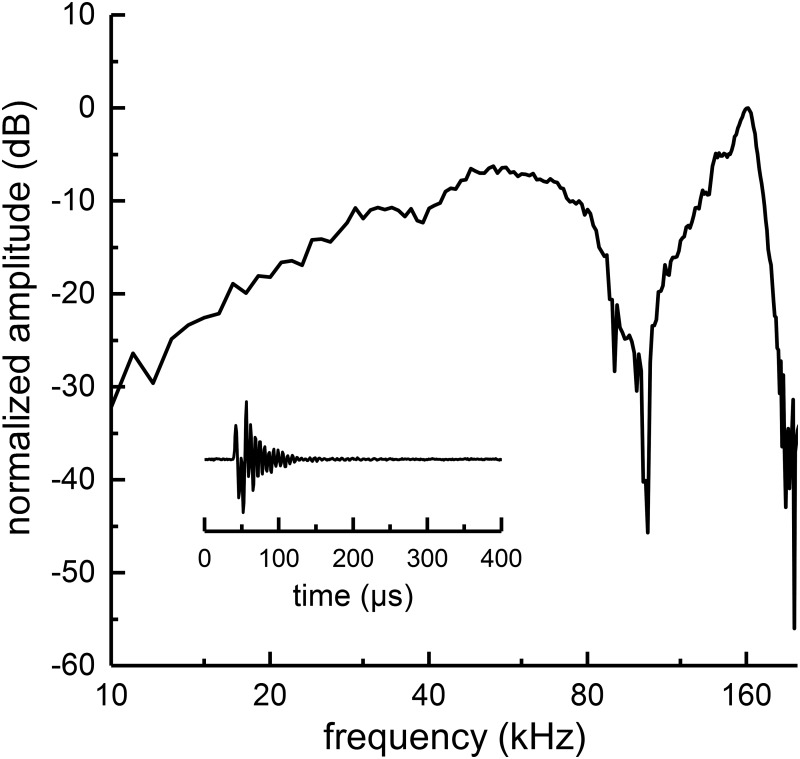
The stimulus level was calibrated for each animal by an ITC 1089D hydrophone (International Transducer Crop., Santa Barbara, CA) that was placed near the estimated midpoint between the left and right sides of the lower jaw (with the animal absent). The output of the hydrophone was amplified by 32 dB (VP1000, Teledyne Reson A/S, Slangerup, Denmark). The acoustic spectrum of the click stimulus is shown in Fig. 1. The spectral amplitude peaks at ∼160 kHz, and rolls off at low frequencies at a rate of −12 dB/octave, with a spectral notch near 100 kHz, presumably caused by multipath interference. For all tests, the click peak equivalent sound pressure level (peSPL) was held constant at 135 dB re 1 μPa.
FIG. 1.
The time and frequency domain representations of the acoustic click are shown (with no dolphin present). The hydrophone is placed where the anterior portion of the dolphin's head would be located. The time-domain click waveform is shown as the insert. The acoustic amplitude spectrum of the clicks shows an increase in amplitude with increasing frequency up to ∼160 kHz, with a spectral notch near 100 kHz, presumably the result of acoustic interference from reflections off the frames holding the transducer and/or bite plate station.
For MLS measurements, a stimulus sequence follows the form 2L–1, where L is an integer number. In the original formulation of the MLS (i.e., the MLS derived for use with linear, time-invariant systems) the stimulation sequence consisted of a series of positive ones and negative ones. In this study, an MLS with length L = 7 was used, containing 64 ones and 63 zeros for the stimulus sequence (due to the rectification property of the auditory periphery), and 64 ones and 63 negative ones for the recovery sequence. More details about this approach can be found in Eysholdt and Schreiner (1982). This MLS stimulus sequence was then used to create seven stimulus sequences, with the minimum time between each click in the sequence [the minimum pulse interval (MPI)] equal to 10, 5, 2, 1, 0.5, 0.2, and 0.1 ms. In the MLS of 64 pulses, 32 pulses were presented at the MPI, 16 at 2 × MPI, 8 at 3 × MPI, 4 at 4 × MPI, 2 at 5 × MPI, and 1 at 6 × MPI. For each MLS the average interval is approximately equal to the inverse of twice the MPI (the exact value is 127/64 × MPI, or roughly 1.984 × MPI). Therefore, in this document the sequences are referred to as possessing average rates of approximately 50, 100, 250, 500, 1000, 2500, and 5000 Hz.
C. ABR measurements
Gold-cup electrodes were embedded in suction cups, filled with conductive electrode gel and placed ∼5 cm posterior to the blowhole (non-inverting) and near the right external auditory meatal opening (inverting). The common lead was placed in the water in close proximity to the dolphin. The electrode voltage was differentially amplified (94 dB) and filtered (300–3000 Hz) by a Grass ICP511 amplifier (West Warwick, RI). The amplified/filtered activity was digitized by a National Instruments PCIe-6361 (Austin, TX; 16-bit, 100 kHz). For conventional averaging, 1024 sweeps were obtained for each measurement. For MLS measurements, the number of sweeps was 32, 64, 128, 256, 512, 1024, or 2048 for MPIs of 10, 5, 2, 1, 0.5, 0.2, or 0.1 ms, respectively. The number of averages per MLS ABR was doubled for each doubling in click rate (or halving of MPI), to enhance SNR at the faster rates and to keep acquisition times similar for each measurement. The EEG averaged over the collection of sweeps was cross-correlated with the recovery sequence to obtain the MLS ABRs. For each dolphin, ABR measurements were conducted twice for each condition, with the results averaged to yield a single ABR for each dolphin/condition based on 2048 sweeps for conventional averaging or 64 to 4096 sweeps for the MLS method.
D. Analysis
Peaks in the ABR waveforms were identified by a custom peak picking software program. Peak latencies were obtained for waves P1, P3, P4, and N5 (Popov and Supin, 1990b). Peak amplitudes for P1, P3, and P4 were defined relative to the following trough (i.e., P1 amplitude is defined as the peak-peak amplitude between P1 and N2). For each subject, ABR amplitudes were normalized relative to the value for conventional averaging at 25 Hz in the same subject. Interwave intervals (IWIs) between P1-P3, P1-P4, and P1-N5 were computed from the latency data. ABR amplitude, latency, and IWIs were then averaged within the NH and HI groups. Nonlinear regression (Graphpad Software, 2014) was used to fit linear-log functions to the MLS latency and IWI data as functions of rate.
III. RESULTS
A. ABR Morphology
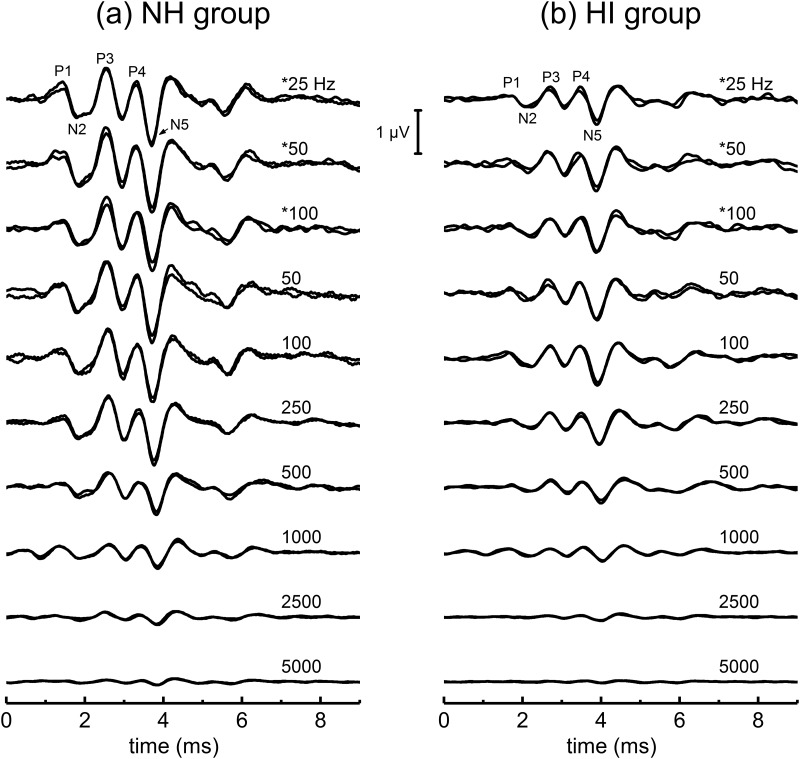
Representative ABR waveforms for the rate series are shown for one of the NH dolphins [WHP, Fig. 2(a)], as well as the HI dolphin with the poorest high-frequency hearing [BLU, Fig. 2(b)]. The top three waveforms (those indicated with an asterisk) were obtained by conventional averaging, while the remaining waveforms were obtained by the MLS approach. Several points are obvious, even from the raw waveforms. First, the dolphin with poorer hearing has smaller ABRs than the normal hearing dolphin. Second, the typical four-positive peak morphology of the ABR that is observed to the lower click rates using conventional averaging is also clearly observed for MLS-ABRs. Third, with increasing rate, the ABR substantially diminishes in amplitude and there appear to be increases in ABR peak latencies. Fourth, at the higher rates, sometimes peak-picking was challenging because the waveforms became more complex, with more than the 4–5 peaks observed at lower rates.
FIG. 2.
ABRs across click rate are shown from one normal-hearing (NH) dolphin (a) and one hearing-impaired (HI) dolphin (b). The number on the upper right-hand side of each waveform represents the approximate average rate of click presentation used to obtain each ABR. The rates with an asterisk indicate ABRs obtained using conventional averaging. Conventional ABRs are obtained by simple time-domain signal averaging. MLS ABRs are obtained by presenting clicks in trains comprised of 64 clicks, with a minimum time between clicks in the train (the minimum pulse interval: MPI). For MLS ABRs, the non-overlapped ABRs shown in this figure are obtained by cross-correlating the auditory evoked responses in each click train by a recovery sequence (see methods section for more details).
B. ABR peak amplitudes across rate
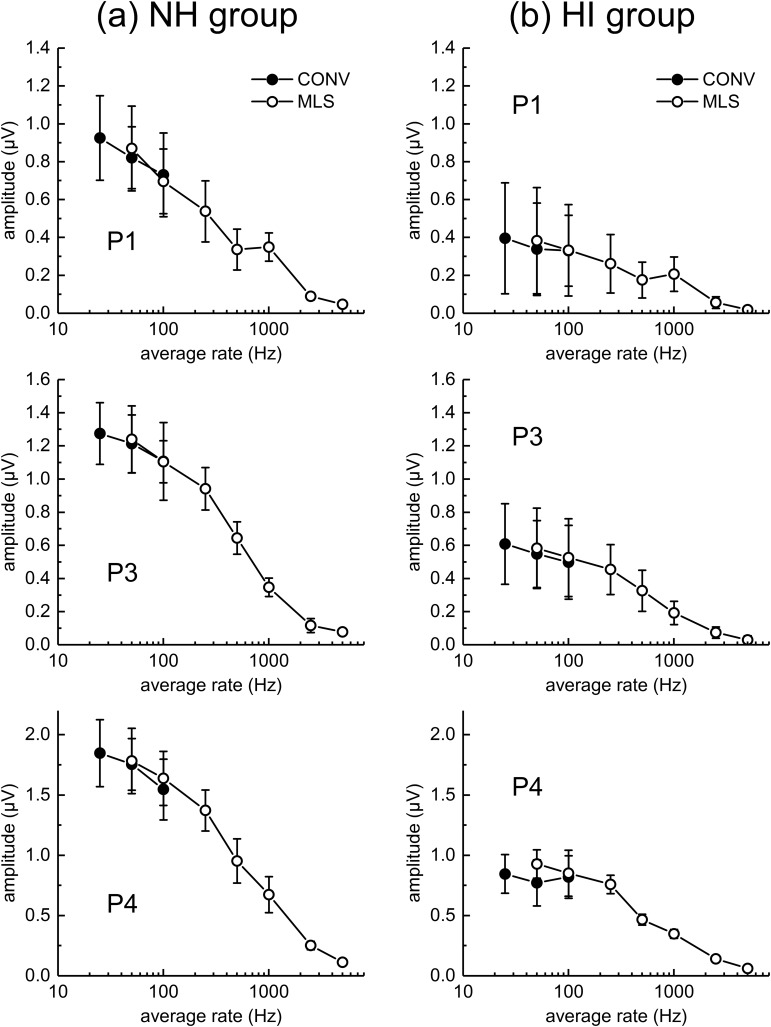
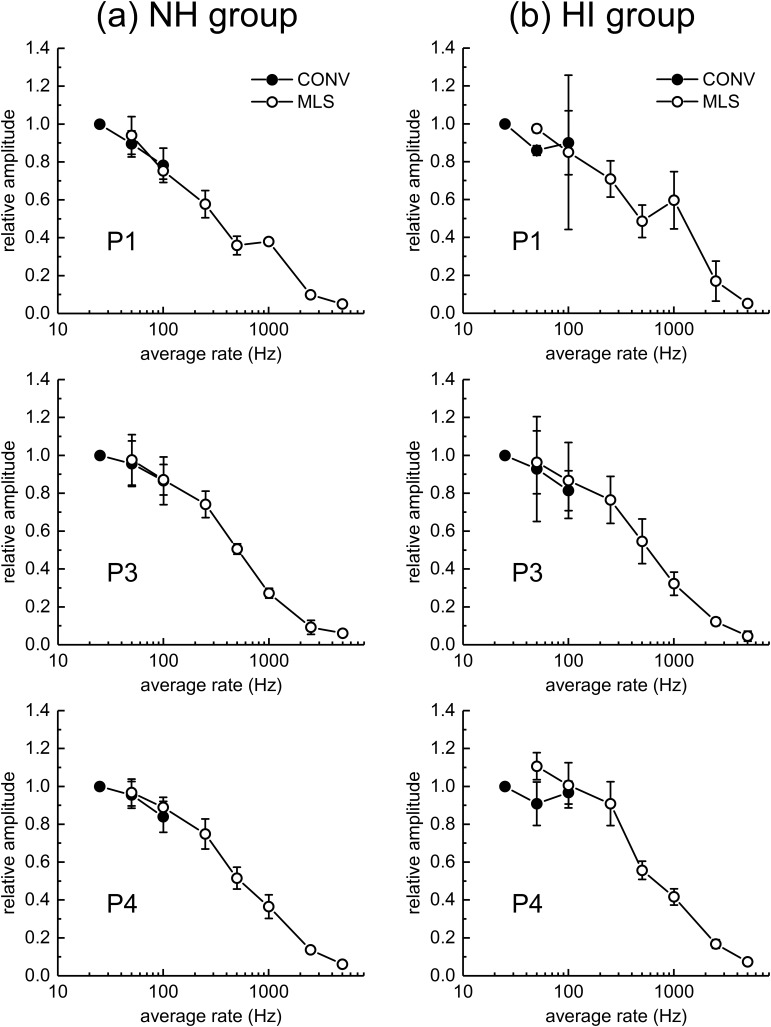
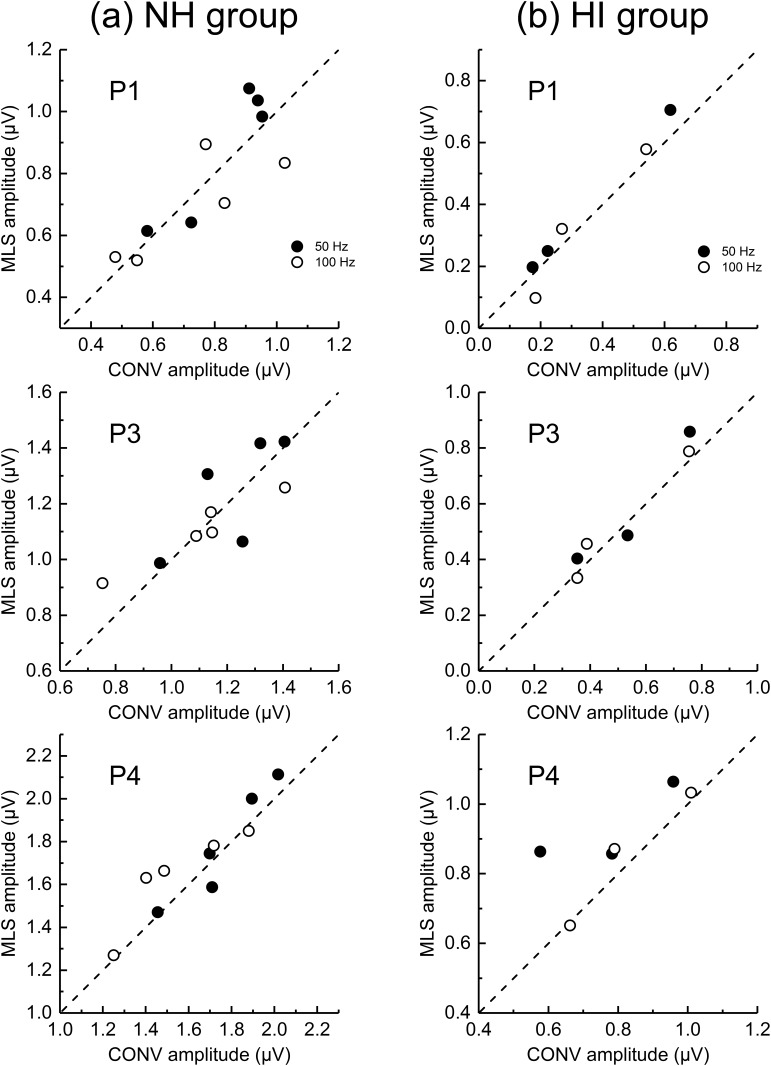
Figure 3 shows ABR peak-to-trough amplitudes averaged for the five NH animals (left panels) and the three HI dolphins (right panels). Note that ABR peak amplitudes are larger for the NH than the HI dolphins. ABR peak amplitudes decrease with increasing rate, which at lower rates is more apparent in the NH dolphins. Figure 4 replots the amplitude data across rate by dividing each peak amplitude (for that peak, that dolphin) by the amplitude observed at 25 Hz. This allows relative amplitude changes to be compared across rate, peak, and group. For the NH animals, there is a decrease in all ABR peak amplitudes with increasing rate above 25 Hz. For P1, the click rate at which the amplitude is reduced by half (from that at 25 Hz) is between 250 and 500 Hz, while for P3 and P4, the half-amplitude rate is ∼500 Hz. For the HI animals, there is little change in amplitude with rate up to 100 Hz, and then the amplitude drops off more systematically. The half-amplitude rate is near 500–1000 Hz for P1 (note the increase in mean relative amplitude between 500 and 1000 Hz), and ∼500 Hz for P3 and P4. Note also, for both groups of dolphins, at both 50 and 100 Hz, that within-animal ABR peak amplitudes are quite similar for conventional and MLS ABRs (Fig. 5). In summary, ABR peak amplitudes are smaller for HI than NH animals, and for both groups of dolphins, ABR peak amplitudes decrease with increasing click rate. At least for average rates of 50 and 100 Hz, conventional- and MLS-ABR peak amplitudes are similar.
FIG. 3.
ABR peak amplitudes are plotted across click rate. The peak amplitudes in the left column (a) are the normal-hearing (NH) dolphins, while those in the right column are ABR amplitudes from hearing-impaired (HI) dolphins. Symbols indicate mean values for each group and the error bars indicate the standard deviation (SD). Filled circles represent conventional (CONV) ABRs, and open circles MLS ABRs. The upper, middle and bottom panels show P1, P3, and P4 amplitudes, respectively.
FIG. 4.
Normalized ABR peak amplitudes as functions of rate for (a) normal-hearing (NH) and (b) hearing-impaired (HI) dolphins. CONV = conventional averaging. Symbols and error bars indicate the mean and SD, respectively. ABR amplitudes for each individual were normalized by dividing by the ABR amplitude for the CONV condition at a rate of 25 Hz. The normalized values were then averaged across subjects. The upper, middle, and bottom panels show P1, P3, and P4 amplitudes, respectively.
FIG. 5.
Within-dolphin MLS ABR peak amplitude is plotted across conventional (CONV) ABR peak amplitude obtained at a similar rate (either 50 Hz or 100 Hz, filled and open circles, respectively). Data from normal-hearing (NH) dolphins (a) are shown in the left column, while hearing-impaired (HI) dolphin (b) amplitudes are shown in the right column. The upper, middle and bottom panels show P1, P3, and P4 amplitudes, respectively.
C. ABR peak latencies and IWIs across rate
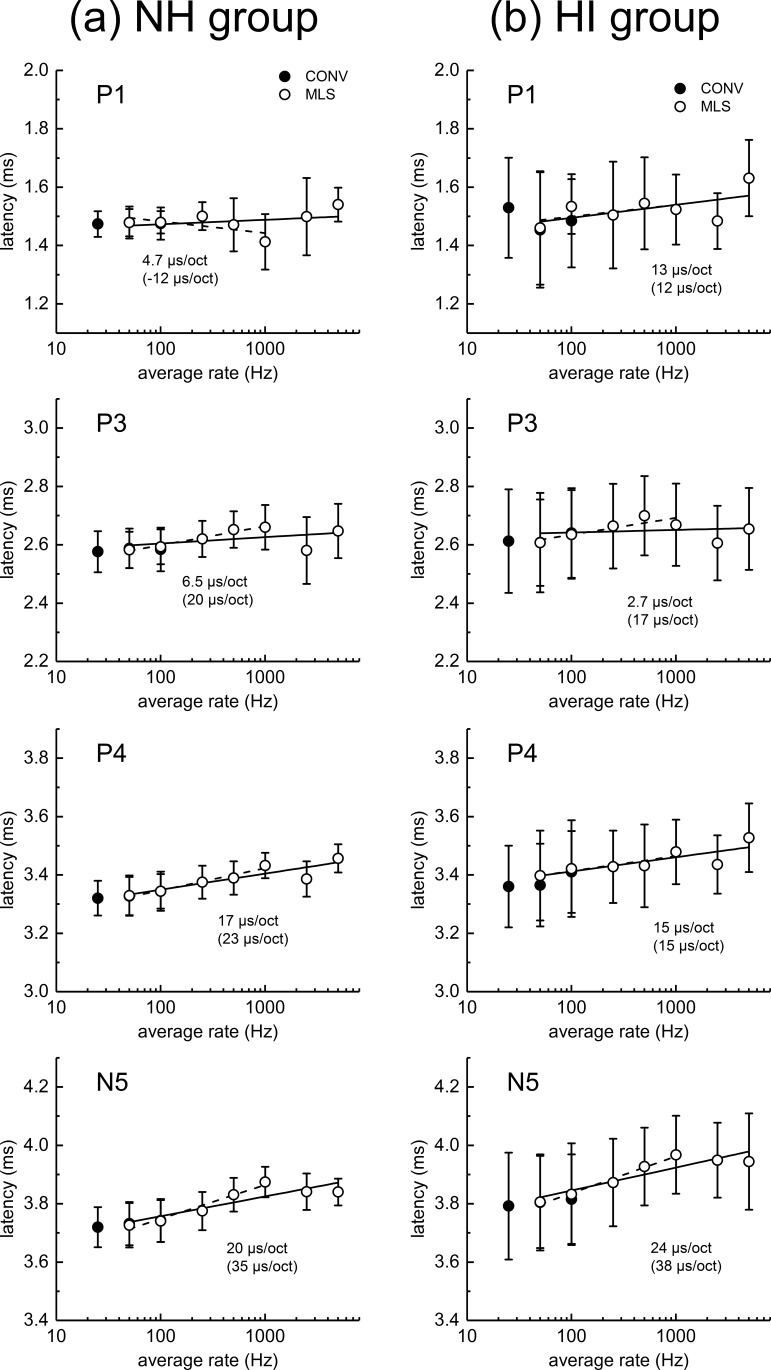
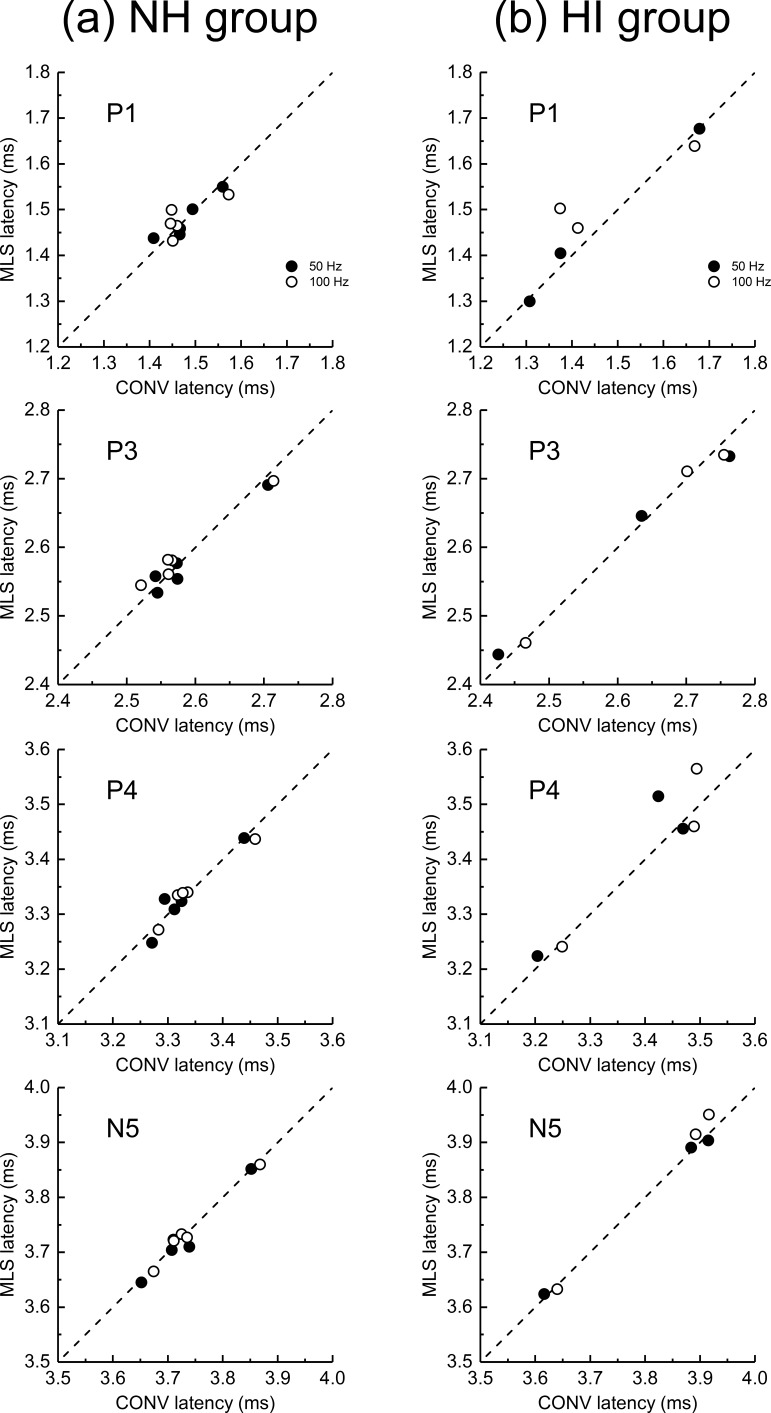
ABR peak latencies for the NH dolphins (left panel) and HI dolphins (right panel) are shown in Fig. 6. Mean latencies for the conventional ABRs and MLS ABRs are very similar for the same average rate (i.e., at 50 and 100 Hz; see Fig. 7 for a scatter plot of these data). This is also true for the HI dolphin data, although there is poorer agreement for the P1 and P4 data than for the P3 and N5 data. As with the ABR amplitudes, variability (i.e., the SD) in the ABR latencies was larger in the HI dolphins compared to the NH dolphins.
FIG. 6.
ABR peak latencies are plotted across click rate. The error bars indicate the standard deviation. The peak latencies in the left column (a) are for the normal-hearing (NH) dolphins, while those in the right column (b) are for the hearing-impaired (HI) dolphins. Filled circles represent conventional (CONV) ABRs, and open circles MLS ABRs. From top to bottom, the panels show P1, P3, P4, and N5 latencies, respectively. Slopes (in μs/octave) for the best-fit linear-log functions are shown for each data set. The solid lines (and slopes shown without parentheses) represent fits to data using all MLS rates, while dashed lines (and slopes shown in parentheses) represent fits only using MLS rates up to 1000 Hz.
FIG. 7.
Within-dolphin MLS ABR peak latency is plotted across conventional (CONV) ABR peak latency obtained at a similar rate (either 50 Hz or 100 Hz, filled and open circles, respectively). Data from normal-hearing (NH) dolphins (a) are shown in the left column, while hearing-impaired (HI) dolphin (b) latencies are shown in the right column. From top to bottom, panels show P1, P3, P4, and N5 amplitudes, respectively.
In Fig. 6, peak latencies tend to increase with increasing rate up to 1000 Hz, but often decrease above 1000 Hz, especially in the NH dolphins. Due to this non-monotonicity appearing for many of the latency/rate functions shown in Fig. 6, we calculated two different latency/rate function slopes for each data set. One regression line (solid line, slope indicated by numeric value not in parentheses) was fit to latency data for all MLS click rates, and a second regression line (dashed line, slope value in parentheses) was fit to the MLS data only up to 1000 Hz. For the NH dolphins [Fig. 6(a)], the slope of the latency/rate function (using all MLS rate data) is less for P1 (4.7 μs/octave) and P3 (6.5 μs/octave) than for P4 and N5 (17 and 20 μs/octave, respectively). For the HI animals, the slope of the P1 latency/rate function is steeper than seen in the NH dolphins (13 μs/octave). The slopes of P4 and N5 with rate in the HI animals (15 and 24 μs/octave) are similar to those observed in the NH dolphins. In the more limited latency/rate functions (i.e., using data only MLS rate data up to 1000 Hz), for both NH and HI groups, latency shift with rate tends to increase with later ABR peaks [i.e., the latency shift (shown as slope) tends to be greater for the later ABR peaks]. In summary, ABR peak latencies were longer for higher click rates. Due to the observed non-monotonicity in the latency/rate functions, regression lines fit to the MLS data for rates of 1000 Hz and below provided a more accurate estimate of latency shift with rate for this range of rates. Overall, the latency shift with rate was greater for the later ABR peaks (as compared to the earlier peaks). As with peak amplitude, ABR peak latencies (for average rates of 50 and 100 Hz) were quite similar for conventional and MLS ABRs.
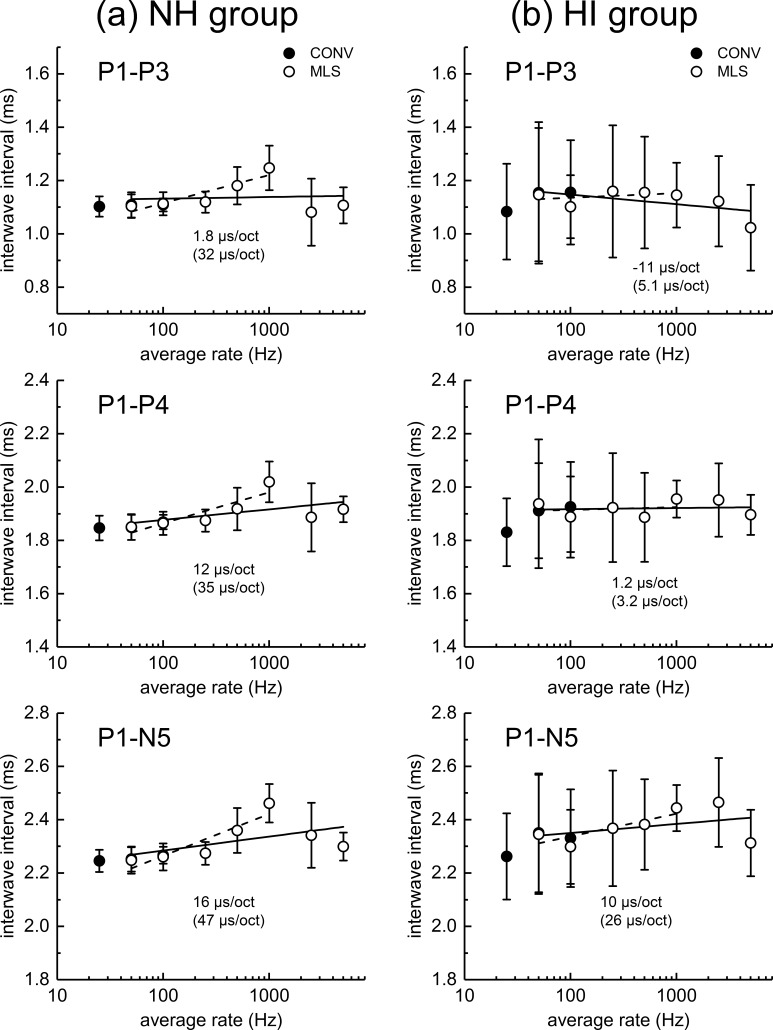
Figure 8 shows the mean IWI across rate. The NH dolphins are shown in the left panel, and the HI dolphins are shown in the right panel. The solid lines represent linear-log fits to these data using nonlinear regression, and include all MLS rates. The numbers not in parentheses represent the slope of these functions. For the NH dolphins, using all MLS rate data, the P1-P4 and P1-N5 intervals increase with increasing click rate, showing slopes of 12 μs/octave for P1-P4 and a somewhat steeper slope of 16 μs/octave for P1-N5. For the HI dolphins, again using all MLS rate data, there is little change in the P1-P4 IWI with rate (a slope of 1.2 μs/octave), while the P1-N5 IWI increases at a rate of 10 μs/octave, a value somewhat less than the 16 μs/octave shown for the NH dolphins. Due to the non-monotonic nature of these IWI functions with rate (i.e., there appears to be a monotonic increase in IWIs for rates below 1000 Hz, but at the highest rates, some IWIs appear to decrease), data for rates above 1000 Hz were excluded and the data again fit with a linear-log function; these regression lines are shown as a dashed line and these slopes are shown in parentheses. Using only MLS rates from 50 to 1000 Hz, it is clear, in NH dolphins, that all IWIs increase with rate, and that the IWIs slopes have highest magnitudes for those IWIs including the later comparison peaks (i.e., P1-P3 < P1-P4 < P1-N5). In the HI group, the only clear increase in IWI with rate for this analysis was for the P1-N5 IWI, and that remains substantially less than that observed for the NH animals. In summary, IWIs generally increase with increasing click rate, at least up to MLS rates of 1000 Hz. Above this rate, there was often a decrease in the mean IWI. Regression lines fit to the MLS data at 1000 Hz and below appear to provide a better representation of rate effects on IWIs than regression line fits that include rate data at 2500 and 5000 Hz.
FIG. 8.
Interwave interval (IWI) across rate is shown for the normal-hearing (NH) dolphins in the left column (a), and for the hearing-impaired (HI) dolphins in the right column (b). Best-fit slopes (in μs/octave) of linear-log functions fit to the data using nonlinear regression are shown for each data set. The solid lines (and slopes shown without parentheses) represent fits to data using all MLS rates, while dashed lines (and slopes shown in parentheses) represent fits only using MLS rates up to 1000 Hz. For the P1-P4 panel showing the HI animals, the solid and dashed lines largely overlap, making it challenging to see the dashed line.
IV. DISCUSSION
A. Comparison with other species
In the present study, there were increases in ABR peak latencies, increases in IWIs, and decreases in peak amplitudes with increasing rate. Ridgway et al. (1981) reported that ABR peak amplitudes decrease and latencies increase with increasing rate (using conventional averaging) in bottlenose and common dolphins. Using a fixed-level paired-click paradigm, and subtracting the single-click response from the paired-click response, Supin and Popov (1995) showed a decrease in amplitude with decreasing paired-click interval. In terrestrial animals, for both conventional and MLS averaging, ABR peak latencies increase, IWIs (typically) increase, and peak amplitudes decrease in a variety of animals, including humans (Eysholdt and Schreiner, 1982; Burkard and Hecox, 1983; Burkard and Hecox, 1987; Burkard et al., 1990; Burkard and Sims, 2001), gerbils (Burkard and Voigt, 1989, 1990; Burkard, 1994), cats (Burkard et al., 1996a,b), mice (Burkard et al., 2001), and chickens (Burkard et al., 1994). Thus, the MLS ABR, and the effects of rate, are very similar in bottlenose dolphins and in those vertebrate terrestrial species investigated previously.
B. Conventional ABRs versus MLS ABRs
A comparison of peak amplitudes and latencies for conventional and MLS ABRs at similar average rates (50, 100 Hz) show very good agreement (see Figs. 5 and 7), suggesting that despite the considerable latency jitter within the MLS train (ranging from one to six times the MPI), that the MLS responses behave like conventional ABRs obtained at similar average rates, at least for low stimulus rates. However, this might not be the case for rates of stimulation at average rates at or above ∼1000 Hz (i.e., MPIs of 0.5 ms or less in the present study). An inspection of Fig. 3 shows very small amplitudes of the ABR, for all peaks and both NH and HI dolphins, for the stimulus rates above 500–1000 Hz. As there are click intervals at up to 6 times the MPI in the stimulus train used in the present study, it is at least possible that the responses at these high rates are dominated by responses to clicks with preceding time gaps >2 × MPI (i.e., these ABRs may be dominated by responses to lower rates). This is supported by the data shown in Fig. 6, the NH group, where latencies appeared to decrease for rates above 500–1000 Hz for several peaks. This effect is also clearly seen for the IWI data (Fig. 8), where (for the NH animals) there is a clear increase in the mean P1-P3, P1-P4, and P1-N5 IWI for rates above 100–200 Hz up to 1000 Hz, and then a decrease above 1000 Hz. The increased complexity of the MLS ABR waveforms might also be explained by differential responses to the clicks with different interstimulus intervals. These results could very well be explained by the supposition that at rates above 1000 Hz, the MLS ABR is dominated by clicks which are preceded by intervals that are more than 2 × MPI. It seems likely that an investigation of signal processing approaches where high rates can be combined with a smaller range of “jitter” in the MPIs will be required to determine whether this supposition is accurate. Approaches such as CLAD (Delgado and Ozdamar, 2004; Ozdamar and Bohórquez, 2006) and RSA (Valderrama et al., 2012) might be used to test this hypothesis.
Popov and Supin (1990a) assessed the effects of click rate on the amplitude of the aggregate ABR (i.e., not the individual peaks) for one bottlenose dolphin and showed that the ABR amplitude was roughly half the amplitude seen at ∼100 Hz at a click rate of ∼500 Hz, which is quite similar to what was observed in the present study. The advantage of the MLS approach over the rate-following responses was that both the amplitude and the latency of the individual peaks could be determined, something not possible above several hundred Hz by the approach used by Popov and Supin (1990a). Supin and Popov (1995) used a paired-noiseburst paradigm, manipulating the time period between a pair of equal-level noisebursts (with a paired-noiseburst presentation rate held constant at 10 Hz), and used a response subtraction approach (i.e., subtracting the response to a single noiseburst from the paired-noiseburst response) at short noiseburst intervals that resulted in ABR overlap. Using this approach, the authors observed that a small response persisted at noiseburst intervals as brief as 200–300 μs, and labeled this time period the temporal resolution of the bottlenose dolphin auditory system. The inverse of this time constant (3300–5000 Hz) produced very small ABR response amplitudes in the present investigation (i.e., for average rates of 2500–5000 Hz). However, in the present investigation, the MLS trains were presented continuously, and the instantaneous inter-click intervals varied over a six-fold time range within each train, making a direct comparison of the MLS results presented herein and the paired-stimulus results reported by Supin and Popov (1995) impossible.
C. Comparison of normal-hearing and hearing-impaired dolphins
In the present study, ABR peak amplitudes are lower in the HI animals than in the NH animals. We have seen lower ABR peak amplitudes in dolphins with high-frequency hearing loss in previous studies (Finneran et al., 2016; Mulsow et al., 2016). It seems likely that this simply reflects the absence of a response from the basal regions of the cochlea in the HI dolphins. Finneran et al. (2016) assessed the effects of high-pass masking noise on the click-evoked ABR. For the two NH dolphins (TRO and SAY) in that study, the amplitudes of P1 to “white equalized” clicks (i.e., constant spectral density across frequency) were reduced by ∼40% in the presence of a white high-pass masking noise whose cutoff frequency was ∼56 kHz; i.e., a cutoff frequency near the “average” cutoff frequency (the frequency at which interpolated threshold reached 100 dB peSPL) of the HI animals in the present study (which ranged between 45 and 73 kHz). In the present study, the mean ABR P1, P3, and P4 amplitudes at the conventional ABR rates for the HI group were about half those of the NH dolphins. Considering the different click levels, age of the animals, and the expected amplitude variation across animals, the results across the two studies are in remarkably good agreement.
ABR peak latencies were on average ∼0.1 ms longer in the HI animals than the NH animals in the present study at low rates. In the Finneran et al. (2016) high-pass masking study, the two NH animals showed mean latency differences (averaged across the various peaks) of 0.04 and 0.08 ms between the unmasked white click and the white click with 56 kHz high-pass noise. Again, considering all of the differences in the present study and the Finneran et al. (2016) report, these results are in remarkably good agreement. Simply put, in those animals with a high-frequency hearing loss, the latency increase relative to that of the NH dolphins likely reflects the traveling wave delay from the extreme base of the cochlea to the cochlear place where normal or near-normal hearing function is achieved.
V. CONCLUSIONS
Clear ABRs can be obtained in bottlenose dolphins at clicks rates at and above 1000 clicks per second using the MLS approach. Changes in the ABR with increasing rate are similar for MLS ABRs and conventional ABRs, and are reminiscent of those effects observed in terrestrial mammals: with increasing rate, peak amplitudes decrease, and peak latencies and IWIs increase. HI dolphins showed smaller ABR peak amplitudes and slightly longer ABR peak latencies, which are likely explained by the absence of (or aberrant) function in the base of the cochlea. At lower rates (50, 100 Hz), ABRs obtained with conventional and MLS approaches possessed similar latencies and amplitudes. This suggests that the average rate is a good metric to describe MLS ABR rate. However, at rates above ∼1000 Hz, the very rapid dropoff in amplitude and non-monotonic latency (and IWI) functions suggest that the response might be dominated by stimuli with interstimulus intervals greater than 2 × MPI, and hence being driven by the small number of clicks at 3–6 times the MPI. Alternative methods of acquiring the ABR at very high rates will be required to resolve this issue.
ACKNOWLEDGMENTS
The authors thank D. Houser, J. Powell, R. Dear, M. Tormey, G. Goya, A. Black, D. Ram, T. Wu, R. Echon, and the animal care and training staff at the Navy Marine Mammal Program. This study was approved by the Institutional Animal Care and Use Committee (IACUC) at the Biosciences Division, Space and Naval Warfare Systems Center (SSC) Pacific and Navy Bureau of Medicine and surgery, and followed all applicable U.S. Department of Defense (DoD) guidelines. Financial support was provided by the U.S. Navy Living Marine Resources (LMR) Program. Preliminary results of this study were presented at the 2017 annual meeting of the American Auditory Society in Scottsdale, AZ.
References
- 1. Buchwald, J. , and Huang, C. M. (1975). “ Far-field acoustic response: Origins in the cat,” Science 189, 382–384. 10.1126/science.1145206 [DOI] [PubMed] [Google Scholar]
- 2. Burkard, R. (1994). “ Gerbil brain-stem auditory-evoked responses to maximum length sequences,” J. Acoust. Soc. Am. 95, 2126–2135. 10.1121/1.408674 [DOI] [PubMed] [Google Scholar]
- 3. Burkard, R. , and Hecox, K. (1983). “ The effect of broadband noise on the human brainstem auditory evoked response. I. Rate and intensity effects,” J. Acoust. Soc. Am. 74, 1204–1224. 10.1121/1.390024 [DOI] [PubMed] [Google Scholar]
- 4. Burkard, R. , and Hecox, K. E. (1987). “ The effect of broadband noise on the human brain-stem auditory evoked response. IV. Additivity of forward-masking and rate-induced wave V latency shifts,” J. Acoust. Soc. Am. 81, 1064–1072. 10.1121/1.394678 [DOI] [PubMed] [Google Scholar]
- 5. Burkard, R. , Jones, S. , and Jones, T. (1994). “ Conventional and cross-correlation brain-stem auditory evoked responses in the white leghorn chick: Rate manipulations,” J. Acoust. Soc. Am. 95, 2136–2144. 10.1121/1.408675 [DOI] [PubMed] [Google Scholar]
- 6. Burkard, R. , Shi, Y. , and Hecox, K. E. (1990). “ A comparison of maximum length and Legendre sequences for the derivation of brain-stem auditory-evoked responses at rapid rates of stimulation,” J. Acoust. Soc. Am. 87, 1656–1664. 10.1121/1.399413 [DOI] [PubMed] [Google Scholar]
- 7. Burkard, R. , and Voigt, H. F. (1989). “ Stimulus dependencies of the gerbil brain-stem auditory-evoked response (BAER). I: Effects of click level, rate, and polarity,” J. Acoust. Soc. Am. 85, 2514–2525. 10.1121/1.397746 [DOI] [PubMed] [Google Scholar]
- 8. Burkard, R. , and Voigt, H. F. (1990). “ Stimulus dependencies of the gerbil brain-stem auditory-evoked response (BAER). III: Additivity of click level and rate with noise level,” J. Acoust. Soc. Am. 88, 2222–2234. 10.1121/1.400119 [DOI] [PubMed] [Google Scholar]
- 9. Burkard, R. F. , McGee, J. , and Walsh, E. (1996a). “ Effects of stimulus rate on the feline brain-stem auditory evoked response during development. II. Peak amplitudes,” J. Acoust. Soc. Am. 100, 991–1002. 10.1121/1.416210 [DOI] [PubMed] [Google Scholar]
- 10. Burkard, R. F. , McGee, J. , and Walsh, E. J. (1996b). “ Effects of stimulus rate on the feline brain-stem auditory evoked response during development. I. Peak latencies,” J. Acoust. Soc. Am. 100, 978–990. 10.1121/1.416209 [DOI] [PubMed] [Google Scholar]
- 11. Burkard, R. F. , and Sims, D. (2001). “ The human auditory brainstem response to high click rates: Aging effects,” Am. J. Audiol. 10, 53–61. 10.1044/1059-0889(2001/008) [DOI] [PubMed] [Google Scholar]
- 12. Delgado, R. E. , and Ozdamar, O. (2004). “ Deconvolution of evoked responses obtained at high stimulus rates,” J. Acoust. Soc. Am. 115, 1242–1251. 10.1121/1.1639327 [DOI] [PubMed] [Google Scholar]
- 13. Eysholdt, U. , and Schreiner, C. (1982). “ Maximum length sequences—A fast method for measuring brain-stem-evoked responses,” Audiology 21, 242–250. 10.3109/00206098209072742 [DOI] [PubMed] [Google Scholar]
- 14. Finneran, J. J. , Mulsow, J. , Houser, D. S. , and Burkard, R. F. (2016). “ Place specificity of the click-evoked auditory brainstem response in the bottlenose dolphin (Tursiops truncatus),” J. Acoust. Soc. Am. 140, 2593–2602. 10.1121/1.4964274 [DOI] [PubMed] [Google Scholar]
- 15.GraphPad Software (2014). “ GraphPad Prism (Version 6) [computer software],” (GraphPad Software, San Diego, CA).
- 16. Jewett, D. L. , Caplovitz, G. , Baird, B. , Trumpis, M. , Olson, M. P. , and Larson-Prior, L. J. (2004). “ The use of QSD (q-sequence deconvolution) to recover superposed, transient evoked-responses,” Clin. Neurophysiol 115, 2754–2775. 10.1016/j.clinph.2004.06.014 [DOI] [PMC free article] [PubMed] [Google Scholar]
- 17. Jewett, D. L. , and Williston, J. S. (1971). “ Auditory-evoked far fields averaged from the scalp of humans,” Brain 94, 681–696. 10.1093/brain/94.4.681 [DOI] [PubMed] [Google Scholar]
- 18. Møller, A. (1994). “ Neural generators of auditory evoked potentials,” in Principles & Applications in Auditory Evoked Potentials, edited by Jacobson J. ( Alllyn and Bacon, Boston: ), pp. 23–46. [Google Scholar]
- 19. Mulsow, J. , Finneran, J. J. , Houser, D. S. , and Burkard, R. F. (2016). “ The effects of click and masker spectrum on the auditory brainstem response of bottlenose dolphins (Tursiops truncatus),” J. Acoust. Soc. Am. 140, 2603–2613. 10.1121/1.4964337 [DOI] [PubMed] [Google Scholar]
- 20. Ozdamar, O. , and Bohórquez, J. (2006). “ Signal-to-noise ratio and frequency analysis of continuous loop averaging deconvolution (CLAD) of overlapping evoked potentials,” J. Acoust. Soc. Am. 119, 429–438. 10.1121/1.2133682 [DOI] [PubMed] [Google Scholar]
- 21. Popov, V. , and Supin, A. Y. (1990a). “ Electrophysiological studies of hearing in some cetaceans and a manatee,” in Sensory Abilities in Cetaceans, edited by Thomas J. A. and Kastelein R. A. ( Plenum, New York: ), pp. 405–415. [Google Scholar]
- 22. Popov, V. V. , and Supin, A. Y. (1990b). “ Auditory brain stem responses in characterization of dolphin hearing,” J. Comp. Physiol. A 166, 385–393. 10.1007/BF00204811 [DOI] [PubMed] [Google Scholar]
- 23. Ridgway, S. H. , Bullock, T. H. , Carder, D. A. , Seeley, R. L. , Woods, D. , and Galambos, R. (1981). “ Auditory brainstem response in dolphins,” Neurobiology 78, 1943–1947. [DOI] [PMC free article] [PubMed] [Google Scholar]
- 24. Supin, A. Y. , and Popov, V. V. (1995). “ Temporal resolution in the dolphin's auditory system revealed by double-click evoked potential study,” J. Acoust. Soc. Am. 97, 2586–2593. 10.1121/1.411913 [DOI] [PubMed] [Google Scholar]
- 25. Valderrama, J. T. , Alvarez, I. , de la Torre, A. , Carlos Segura, J. , Sainz, M. , and Luis Vargas, J. (2012). “ Recording of auditory brainstem response at high stimulation rates using randomized stimulation and averaging,” J. Acoust. Soc. Am. 132, 3856–3865. 10.1121/1.4764511 [DOI] [PubMed] [Google Scholar]


