Abstract
The neural representation of the dolphin broadband biosonar click was investigated by measuring auditory brainstem responses (ABRs) to “self-heard” clicks masked with noise bursts having various high-pass cutoff frequencies. Narrowband ABRs were obtained by sequentially subtracting responses obtained with noise having lower high-pass cutoff frequencies from those obtained with noise having higher cutoff frequencies. For comparison to the biosonar data, ABRs were also measured in a passive listening experiment, where external clicks and masking noise were presented to the dolphins and narrowband ABRs were again derived using the subtractive high-pass noise technique. The results showed little change in the peak latencies of the ABR to the self-heard click from 28 to 113 kHz; i.e., the high-frequency neural responses to the self-heard click were delayed relative to those of an external, spectrally “pink” click. The neural representation of the self-heard click is thus highly synchronous across the echolocation frequencies and does not strongly resemble that of a frequency modulated downsweep (i.e., decreasing-frequency chirp). Longer ABR latencies at higher frequencies are hypothesized to arise from spectral differences between self-heard clicks and external clicks, forward masking from previously emitted biosonar clicks, or neural inhibition accompanying the emission of clicks.
I. INTRODUCTION
Bottlenose dolphins (Tursiops truncatus) possess a high-frequency, broadband biosonar systems that allows them to orient, navigate, and forage underwater (Au, 1993; Au and Simmons, 2007). In many situations, target detection and classification abilities of these animals exceed those of human-made sonars, leading to interest in how the animals are able to achieve superior performance and how their biosonar system might be replicated in hardware/software (Nachtigall, 1980; Au, 1993; Au and Martin, 2012).
The biosonar systems of dolphins and microchiropteran bats are believed to work along similar basic principles: a replica of the emitted sound pulse is compared to returning echoes, with large-scale echo delay differences revealing overall target range, and fine-scale echo delay differences revealing target shape (Simmons and Gaudette, 2012; Simmons et al., 2014). Knowledge of the emitted click—i.e., the animal's internal, neural representation of the click—is thus critical for biosonar tasks, especially those involving echo ranging or range discrimination (Masters and Jacobs, 1989) [but not necessarily for target detection only (Møhl, 1986; Masters and Jacobs, 1989; Finneran et al., 2013b)]. Biosonar clicks produced by dolphins are sufficiently intense to be heard by the echolocating animal and provide the required click replica (e.g., Supin et al., 2003); however, the temporal and spectral properties of the neural representation of the click would likely not match those of the acoustic click measured in the farfield. Differences in sound propagation pathways should result in marked differences in the acoustic properties of an animal's own biosonar click arriving at the inner ear (the “self-heard” click) compared to those of the same click recorded in the farfield along the principal beam axis. Temporal dispersion within the cochlea would also be expected to affect the neural representation of the click—high frequencies initially excite the basal region and the traveling wave subsequently progresses towards lower-frequency, more apical regions. The result is a frequency-dependent delay in the activation of sensory cells tuned to frequencies present in the click, which could effectively make the neural representation of an impulsive click similar to that of a frequency-modulated (FM) downsweep. The extent to which the neural representations of short-duration, impulsive clicks in dolphins have characteristics of FM downsweeps has implications for assessing whether the neural processes used by dolphins have converged on solutions similar to those seen in FM bats (Simmons and Gaudette, 2012). This is not to suggest that the neural representations of dolphin clicks and those of actual bat FM calls would be temporally similar (see Burkard and Moss, 1994), but rather that cochlear dispersion should delay lower frequency responses and give FM downsweep-like features to neural responses to impulsive clicks. The main question involves the extent to which the neural representation of the self-heard click differs from the impulsive nature of the farfield acoustic click in dolphins.
The present paper describes experiments designed to examine the neural representation of the bottlenose dolphin's self-heard biosonar click. Two experiments were conducted: a biosonar experiment and a passive listening experiment. In the biosonar experiment, auditory brainstem responses (ABRs) to the self-heard biosonar click were measured in two dolphins during an echolocation task (e.g., see Supin et al., 2003). To isolate individual regions of the cochlea and obtain cochlear place-specific ABRs, masking noise was presented to the dolphins during the echolocation task, and the subtractive high-pass noise (HPN) technique (Teas et al., 1962; Don and Eggermont, 1978; Finneran et al., 2016b) was used to derive narrowband ABRs from ABRs to the broadband biosonar clicks. In this method, ABRs are measured in the presence of a broadband stimulus (e.g., the self-heard click) and high-pass masking noise, with the noise high-pass cutoff frequency adjusted to cover the frequency range of interest. Averaged ABRs measured in noise having a specific cutoff frequency are then sequentially subtracted from those measured in noise with a higher cutoff frequency to derive narrowband ABRs. The biosonar data consist of the peak amplitudes and latencies of the derived, narrowband ABRs to the self-heard click and provide an estimate of the neural representation of the click available to the dolphin.
The passive listening experiment was conducted to provide a basis to evaluate the click-evoked, narrowband ABRs measured during the biosonar task. In the passive listening experiment, ABRs were measured in response to external clicks presented to the dolphins along with masking noise having the same high-pass cutoff frequencies as in the biosonar experiment (see Finneran et al., 2016b). Narrowband ABRs were then derived from the broadband ABRs using the subtractive HPN technique. Comparison between the passive listening data and biosonar data provided an estimate of the extent to which the neural representation of the self-heard biosonar click differs from that of a calibrated external click.
This paper first presents the biosonar experiment, followed by the passive listening experiment, and concludes with a general discussion comparing the biosonar and passive listening data.
II. BIOSONAR TASK
A. Introduction
The goal of the biosonar task was to obtain frequency-specific contributions to the ABR in response to the dolphins' own emitted biosonar clicks. The various peaks of the narrowband ABRs—obtained using the HPN technique—represent the magnitude, synchronization, and latency of neural activation within each frequency band at the level of the auditory nerve and brainstem; i.e., the neural representation of the self-heard click.
B. Methods
1. Subjects and test environment
Subjects consisted of two bottlenose dolphins: SAY (female, 36 y, ∼220 kg, 2.8 m), and TRO (male, 24 y, ∼180 kg, 2.5 m). The upper-cutoff frequency, defined as the frequency at which psychophysical thresholds reached a sound pressure level (SPL) of 100 dB re 1 μPa, was ∼140 kHz for both SAY and TRO, indicating full hearing bandwidth for both dolphins. All tests were conducted within floating, netted enclosures at the U.S. Navy Marine Mammal Program facility in San Diego Bay, CA. Primary ambient noise sources at the test site were snapping shrimp, other dolphins, and small vessels. The mean ambient noise pressure spectral density level over a frequency band defined by the center frequency ± one-half the root mean square (rms) bandwidth of SAY and TRO's echolocation clicks was 61 dB re 1 μPa2/Hz (SD = 3.5 dB).
2. Task description
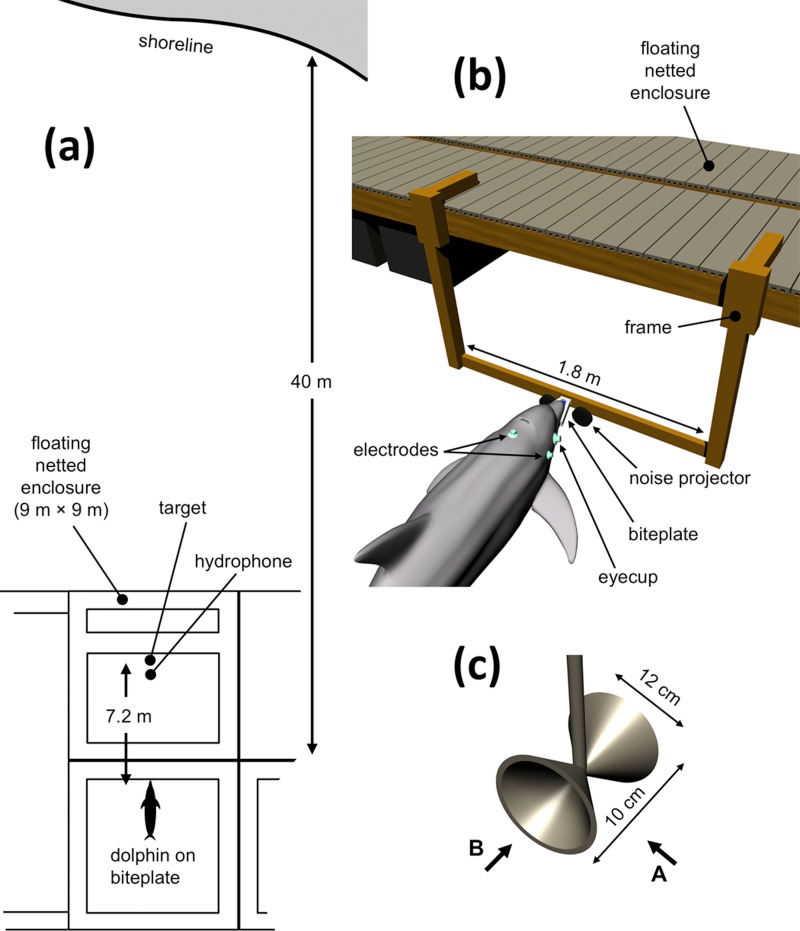
Biosonar data were collected over 17 sessions for SAY and 25 sessions for TRO. Each session consisted of 120 to 220 individual trials and lasted ∼90−150 min. During each trial, a dolphin positioned itself on an underwater “biteplate,” oriented so the dolphin faced the enclosure containing the biosonar target and recording hydrophone [Fig. 1(a)]. The biteplate depth was 80 cm and it was supported by vertical posts spaced 1.8 m apart [Fig. 1(b)]. The biosonar target [Fig. 1(c)] consisted of two hollow metal cones, joined at their apices and located 7.2 m in front of the dolphin when on the biteplate, at a depth estimated to match the principal biosonar transmission beam axis. Target strengths measured for target sides A and B were approximately −24 and −22 dB, respectively. During all trials, the dolphins wore silicon suction cups over their eyes (“eyecups”) to prevent visual inspection of the target.
FIG. 1.
(Color online) (a) Testing was conducted in a floating, netted enclosure in San Diego Bay, with the dolphin positioned on a “biteplate” apparatus facing a physical target and recording hydrophone. (b) Schematic of dolphin positioned on biteplate while wearing “eyecups” to prevent visual inspection of target, and surface electrodes embedded in suction cups for ABR measurement. (c) The biosonar target was constructed from two hollow cones joined at their apices. The dolphin was conditioned to report a change in target orientation from aspect “A” to aspect “B.”
The biosonar task required the dolphin to echolocate towards the target and produce a conditioned acoustic response (SAY: whistle, TRO: burst pulse) when the target was rotated 90° from aspect A to aspect B (a change trial). On 80% of the trials, the target was rotated after a random interval of 5 to 10 s; on the remainder of the trials (control trials), the target orientation remained constant for the 7- to 12-s trial duration. If the dolphin responded during a 2-s response interval after a target rotation (a hit), or withheld the response for an entire trial in which the target did not rotate (a correct rejection), it was rewarded with one fish. The dolphin was recalled to the surface with no fish reward for responding during a control trial or before target rotation on a change trial (both considered false alarms), or for failing to respond during a response interval following target rotation (a miss). If the dolphin did not echolocate during a trial, stopped echolocating before the target was rotated, left the biteplate, or was visually observed to be echolocating on another object, it was recalled and the trial data were discarded. Data collection concluded after at least 2000 “epochs” of EEG data were obtained for each HPN condition (see below).
3. Click and ambient noise recording
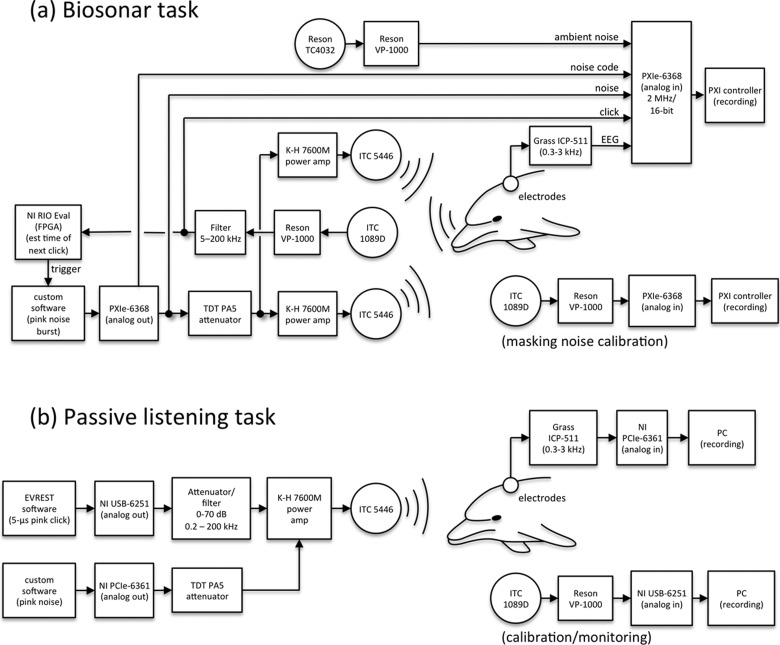
Clicks emitted by the dolphin were recorded using a piezoelectric hydrophone (1089D, International Transducer Corp, Santa Barbara, CA) positioned between the dolphin and target, 6.8 m from the dolphin at the target depth (the “click hydrophone”). The click hydrophone signal [Fig. 2(a)] was amplified and filtered (12–20 dB gain, 5–200 kHz bandwidth: VP-1000, Reson Inc., Slangerup, Denmark and 3C module, Krohn-Hite Corporation, Brockton, MA) before being digitized with a PXIe-6368 multifunction data acquisition device (National Instruments, Austin, TX) at a rate of 2 MHz and 16-bit resolution and stored to hard disk. Ambient noise was monitored using an additional hydrophone (TC4032, Reson Inc., Slangerup, Denmark) whose signal was high-pass filtered (100 Hz, VP-1000) then digitized by the same PXIe-6368.
FIG. 2.
(a) In the biosonar task, ABRs to the dolphin's self-heard clicks were measured. At the same time, the dolphin's emitted biosonar clicks were used to trigger instances of masking noise bursts to mask a small proportion of the self-heard clicks. (b) In the passive listening task, ABRs were measured to external, spectrally pink clicks while HPN was simultaneously presented to the dolphin.
4. Masking noise generation
To prevent the dolphins from changing their biosonar click emissions as the masking noise high-pass cutoff frequency changed, noise was presented infrequently in short bursts (20 ms, including 2-ms linear rise/fall times) that temporally overlapped emitted clicks, and with cutoff frequencies randomized within and across trials; i.e., during any trial, there was a 5% chance that the next click emitted by the dolphin would be accompanied by a noise burst with a randomized high-pass cutoff frequency. The time at which the next click would be emitted was estimated by passing the signal from the 1089D hydrophone into an NI eval-RIO 02 device (National Instruments, Austin, TX) containing a field programmable gate array (FPGA) [Fig. 2(a)]. Custom software executing on the FPGA was used to estimate the instantaneous inter-click interval (ICI) and the time at which the next click would be emitted by the dolphin (under the assumption that inter-click intervals do not change substantially from one click to the next within a click train). For 5% of the clicks, the FPGA system sent a digital pulse (at the estimated time of the next click emission) to trigger a second PXIe-6368 which was used to generate the analog noise burst. To prevent noise bursts from producing a time-locked ABR that would interfere with analysis of the click-evoked ABR, the exact noise start times were randomized (jittered) by ± 2.5 ms (chosen to be well above the dominant period in the dolphin click-evoked ABR).
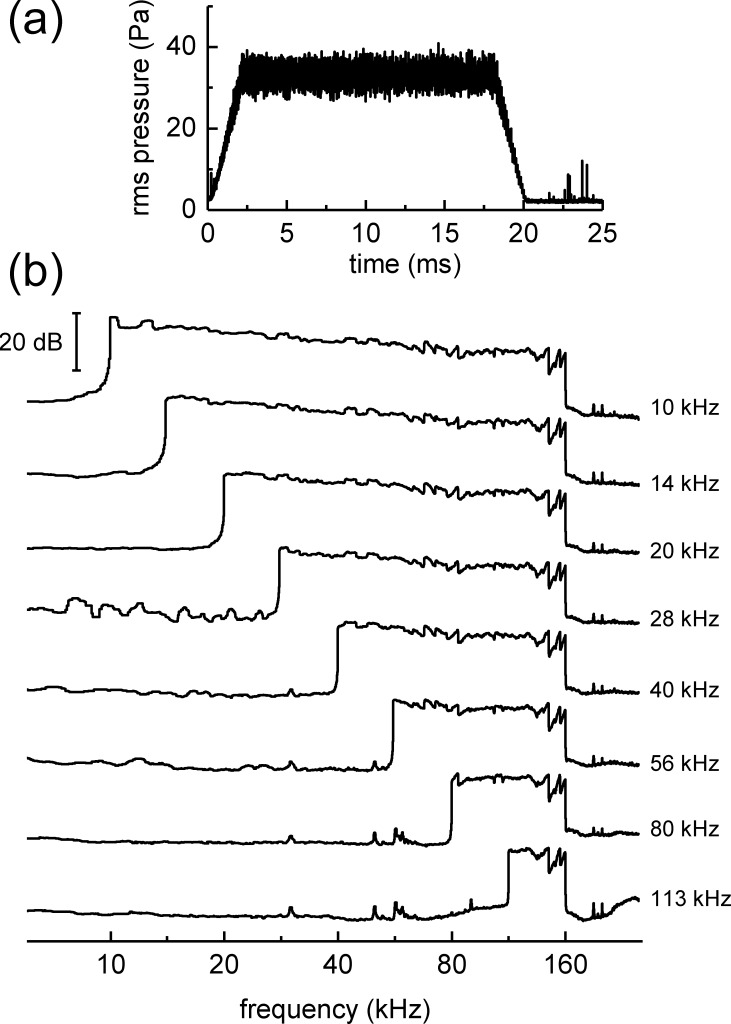
Noise bursts were digitally generated using a reverse fast Fourier transform (FFT) approach, then compensated for the underwater sound projector transmitting voltage response and any effects of multipath sound propagation. Frequency compensation was accomplished by first measuring the transfer function relating the transducer excitation voltage to the sound pressure at the listening position. To minimize the influence of large amplitude changes over small frequency intervals, the transfer function was smoothed over 1/10-octave intervals. A new, frequency-compensated excitation voltage was then calculated from the inverse FFT of the product of the excitation voltage FFT, the desired spectral amplitudes, and the inverse of the measured transfer function. Frequency compensation was performed to obtain spectra that were “pink”—the pressure spectral density levels decreased by 3 dB/octave, so that the SPLs were flat (±3 dB) across 1/3-octave bands over the frequency range of 10 kHz−160 kHz (Fig. 3). Noise low-pass cutoff frequencies were fixed at 160 kHz but high-pass frequencies varied between 10, 14, 20, 28, 40, 56, 80, and 113 kHz.
FIG. 3.
Derived, narrowband ABRs to the dolphin's self-heard biosonar click were obtained by masking 5% of the emitted clicks with a 20-ms noise burst with high-pass cutoff varied randomly from 10 to 113 kHz in 1/2-octave steps. (a) Representative example of the noise burst envelope. (b) Pressure spectral densities of representative noise bursts. The text legends indicate the high-pass cutoff frequency. Noise was equalized as spectrally pink, with a slope of −3 dB per octave within the passband.
Digital noise bursts were converted to analog with a 500-kHz update rate and 16-bit resolution, attenuated (PA5, Tucker-Davis Technologies, Alachua, FL), then input to two amplifiers (7600M, Krohn-Hite Corporation, Brockton, MA), each driving a separate piezoelectric sound projector (5446, International Transducer Corp, Santa Barbara, CA) [Fig. 2(a)]. The sound projectors were positioned to the left and right of the biteplate, approximately 50 cm in front of the dolphin's lower jaws. Along with the noise burst, a “noise code” signal, used later in data analysis, was generated and sent to the first PXIe-6368 for recording. The noise code was an analog signal with a temporal envelope matching that of the noise burst and an amplitude scaled according to the noise high-pass cutoff frequency. Noise was calibrated before and after each session, without a dolphin present, using a second ITC 1089D hydrophone placed at the listening position [Fig. 2(a)].
5. ABR measurements
ABRs were measured using surface electrodes embedded in suction cups and attached to each dolphin's head and dorsal surface. A small amount of conductive paste was applied to the electrodes prior to attachment. A biopotential amplifier (ICP511, Grass Technologies, West Warwick, RI) filtered (0.3−3 kHz) and amplified (94 dB) the potential difference between an electrode located on the midline, approximately 18 cm posterior to the caudal edge of the blowhole, and one placed near the right external auditory meatus. A third (common) electrode was placed in the seawater near the dolphin. The differential electrode voltage, representing the instantaneous electroencephalogram (EEG), was digitized using the PXIe-6368 [Fig. 2(a)].
6. Analysis
Within each trial, biosonar click arrival times at the 1089D receiving hydrophone were determined and used to estimate the time of click emission, based on the distance of 6.8 m between the blowhole and hydrophone and a nominal sound speed of 1500 m/s. Individual 50-ms time epochs, beginning 10 ms before click emission, were then identified. Time values were later corrected for the estimated travel time between click emission and reception at the ears; i.e., ABR latencies are relative to the estimated arrival time of the click at the tympanoperiotic complexes. Latency corrections (i.e., estimated travel time between the click generator and ear) were 150 μs for SAY and 120 μs for TRO, based on a 1500 m/s sound speed and individual morphometrics.
For each time epoch, the instantaneous EEG signal was extracted, decimated to a 40-kHz sampling rate, and saved as a separate file (an EEG waveform “clip”) that was coded with the corresponding HPN cutoff frequency. During EEG clip extraction, time intervals containing a whistle or burst pulse response, epochs corresponding to clicks with ICI < the two-way travel time between dolphin and target, and epochs occurring after target rotation were excluded. ABRs were obtained by grouping EEG clips by HPN cutoff frequency, low-pass filtering the clips at 3 kHz using a zero-phase implementation of a sixth-order Butterworth filter, and synchronously averaging. For visualizing the ABR waveforms, two separate averages were computed, each containing half the total available epochs.
Narrowband ABRs were obtained by sequentially subtracting ABR records obtained with HPN cutoff frequencies separated by half-octave or octave intervals (see Finneran et al., 2016b), with the unmasked condition data being used for the high-pass frequency of 160 kHz. The main analysis was based on derived-band ABRs calculated using octave intervals to improve the signal-to-noise ratio following response subtraction (Herdman et al., 2002). Derived-band ABRs based on half-octave intervals were also computed to compare the sum of the derived-band ABRs to the unmasked ABR. The derived-band center frequency was defined as the geometric mean of the two high-pass cutoff frequencies; e.g., the ABR obtained with 10-kHz HPN was subtracted from that obtained with 20-kHz HPN to obtain the narrowband ABR centered at 14.1 kHz. Peak amplitudes and latencies were measured from the derived-band ABRs, based on the local amplitude minimum or maximum within a specified time interval near the visually identified peaks P1, N2, P4, and N5 (see Popov and Supin, 1990). On those occasions when peak splitting of P1 or N2 occurred, the waves were defined using the closest peak to the P1-N2 zero crossing. Amplitudes for P1 and P4 are reported as the peak-peak (p-p) amplitude relative to the successive trough (i.e., P1 amplitude is defined here as the p-p amplitude of P1-N2).
Latencies of P1, P4, and N5 were fit with a power function based on models used to fit human ABR latencies and estimate cochlear traveling wave delays (e.g., Don and Eggermont, 1978; Eggermont, 1979; Elberling et al., 2007):
| (1) |
where τ (f) is the latency (in ms), f is frequency (in kHz), and τ0, k, and d are fitting parameters. The parameter τ0 represents any frequency-independent delays, e.g., synaptic delays and central conduction time. To eliminate the dependency between k and d, d was set equal to 1 (Finneran et al., 2016b). Best-fit values for k were compared using the extra sum-of-squares F test with α = 0.05 (Graphpad Software, 2014); if no significant differences were found, the data were re-fit using a shared value for k.
Although the ABRs were the primary data of interest, click parameters were also calculated for each subject to ensure that clicks did not systematically change with HPN cutoff frequency. Individual clicks occurring within the time period from the trial start to the time of the echo change (change trial) or trial end (control trial) were analyzed. Within this time interval, the p-p source level, center frequency, rms bandwidth, and ICI (Au, 1993) were calculated for each click. Source levels were estimated assuming spherical spreading loss [i.e., by adding 20 log10(6.8) to the sound pressure level (SPL) measured at 6.8 m]. The dolphins' performance metrics in the echolocation task were also quantified, using the hit rates (the number of hits divided by the number of change trials) and the false alarm rates (the number of false alarms divided by the number of control trials).
C. Results
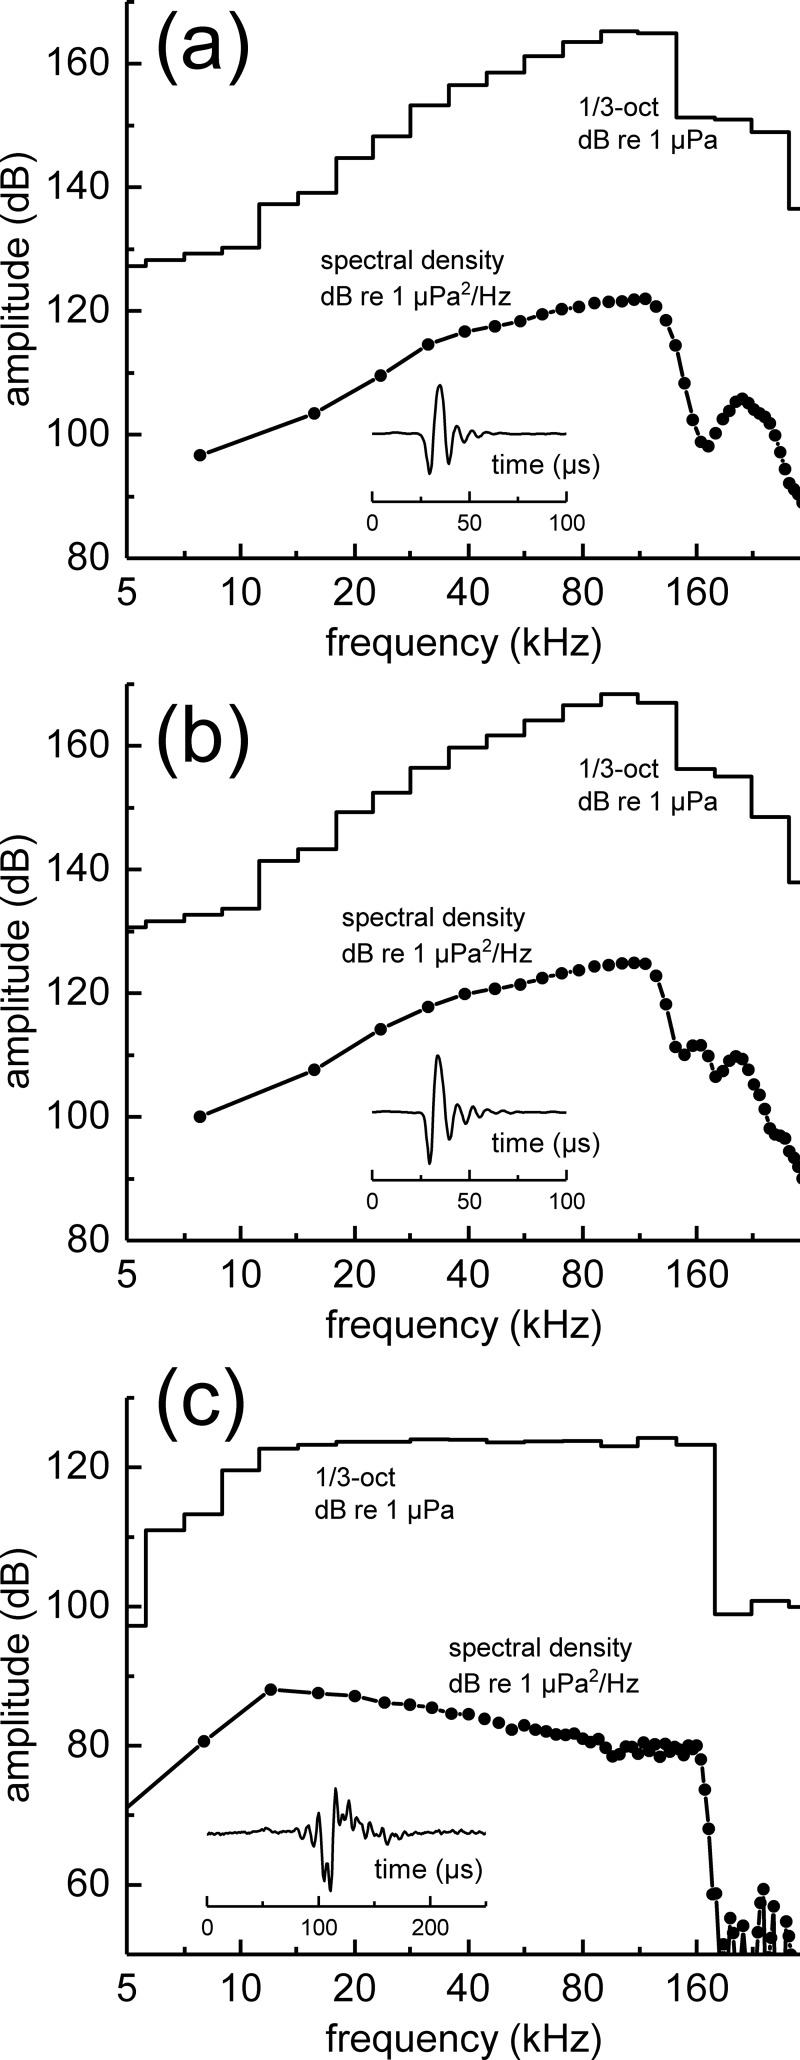
The dolphins SAY and TRO participated in a total of 2016 and 3594 trials, respectively. Hit rates were >99% and false alarm rates were 1% for both dolphins, indicating a relatively easy biosonar task. Biosonar clicks recorded on the principal beam axis in the acoustic farfield had mean p-p source levels of 205 dB re 1 μPa at 1 m (SD = 3 dB) for SAY and 208–209 dB re 1 μPa at 1 m (SD = 3 dB) for TRO across the HPN cutoff frequencies (i.e., there was little difference in click source level across the HPN frequencies). Mean center frequencies were 91–92 and 92–93 kHz (SD = 7 kHz) and rms bandwidths were 34 and 35 kHz (SD = 4 kHz), for SAY and TRO, respectively, regardless of HPN frequency. Median ICIs were 38–39 ms (interquartile range = 10–12 ms) and 64–65 ms (interquartile range = 21–22 ms) for SAY and TRO, respectively. For both dolphins, click spectral density levels were relatively flat (±3 dB) from ∼40 to 120 kHz, while 1/3-octave SPLs increased with frequency from ∼10 to 100 kHz [Figs. 4(a) and 4(b)]. This indicates that the farfield biosonar clicks contained relatively more high-frequency energy, at least up to 120 kHz, compared to a spectrally pink click.
FIG. 4.
Representative examples of mean instantaneous sound pressure of biosonar clicks for (a) SAY and (b) TRO recorded in the farfield. (c) Representative example of spectrally pink click stimulus used in the passive listening tasks. The peSPL for this example was ∼145 dB re 1 μPa.
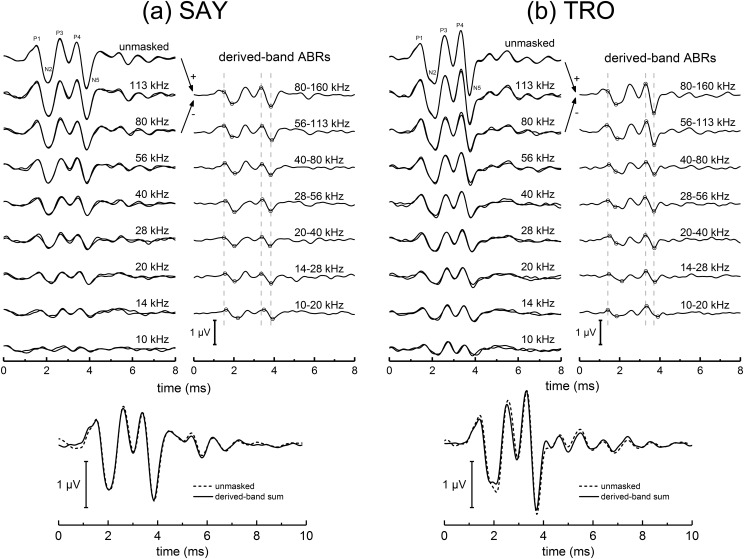
Between 2197 and 2567 individual EEG epochs were obtained for each HPN frequency condition (Table I). Because of the low proportion (5%) of masked clicks, the number of unmasked epochs was much higher (>3 × 10⁵); however, preliminary analyses showed negligible differences in the averaged ABRs once the number of epochs exceeded ∼16 000, therefore only 16 384 epochs—distributed evenly across all available epochs—were analyzed for the unmasked condition for each subject. Broadband ABRs obtained after averaging the EEG epochs (Fig. 5, left panels) and narrowband ABRs obtained after subtraction (Fig. 5, right panels) matched the basic morphology expected for Tursiops (Popov and Supin, 1990), although “peak-splitting” of the waves P1 and N2 occurred for several frequency bands. At the lowest-frequency HPN condition (10 kHz), low-amplitude ABRs were still clearly visible for both SAY and TRO, indicating under-masking of the self-heard click (i.e., the noise levels were not high enough to completely mask the click). For both SAY and TRO, the sum of the 1/2-octave derived-band ABRs (Fig. 5, lower panels) closely matched the unmasked ABR, confirming that—despite the under-masking—the unmasked ABR can be represented by the linear sum of the individual derived-band ABRs, that the masking noise was effective in limiting the spread of activation to higher-frequency regions, and that significant over-masking (apical spread of masking) did not occur.
TABLE I.
Number of EEG epochs from which the ABR for each subject and HPN condition was obtained during the biosonar task. For the unmasked condition, a subset of 16 384 epochs, distributed evenly across all available epochs, was analyzed.
| HPN Cutoff (kHz) | SAY | TRO |
|---|---|---|
| 10 | 2497 | 2271 |
| 14 | 2502 | 2297 |
| 20 | 2528 | 2197 |
| 28 | 2461 | 2301 |
| 40 | 2567 | 2321 |
| 56 | 2442 | 2342 |
| 80 | 2339 | 2298 |
| 113 | 2478 | 2329 |
| Unmasked | 16 384 (382 377) | 16 384 (383 449) |
FIG. 5.
ABRs measured during the biosonar task with the dolphins (a) SAY and (b) TRO. For each dolphin, the top left panel shows the averaged ABRs measured in the presence of masking noise bursts with a low-pass cutoff frequency of 160 kHz and various high-pass cutoffs (specified with each trace). The unmasked condition was used in place of a 160-kHz HPN condition. For each noise condition, two averaged ABRs are shown, each based on one-half the total number of epochs obtained for each condition (Table I). Narrowband ABRs (top right panels) were derived by sequentially subtracting the ABRs obtained with noise having cutoff frequencies separated by one octave; i.e., the derived-band ABR from 56 to 113 kHz was obtained by subtracting the ABR obtained with 56-kHz HPN from the ABR obtained with 113 kHz. Symbols in the derived, narrowband ABRs indicate the specific peaks used for latency and amplitude measures. Vertical, dashed lines indicate the peak latencies for P1, P4, and N5 for the 80–160 kHz band. The bottom panel compares the unmasked ABR with the sum of the derived, narrowband ABRs based on a 1/2-octave bands (so there is no overlap between bands).
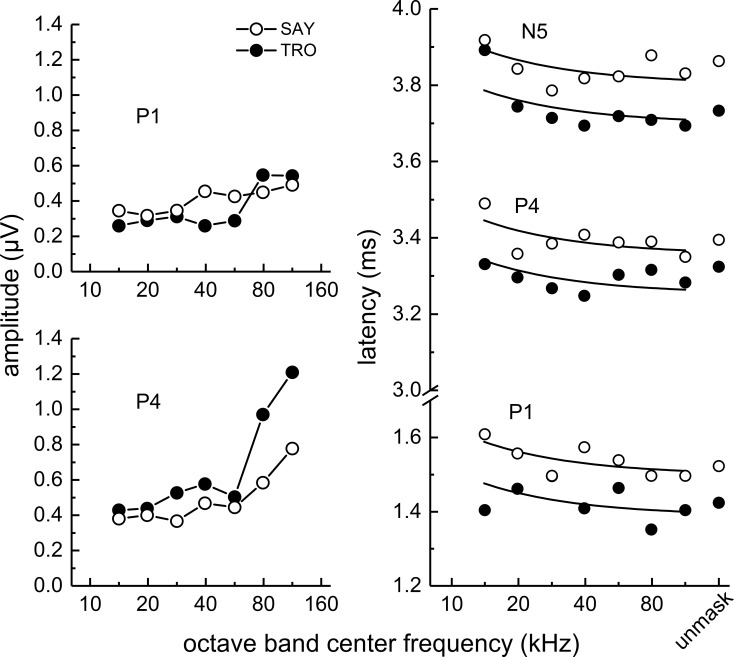
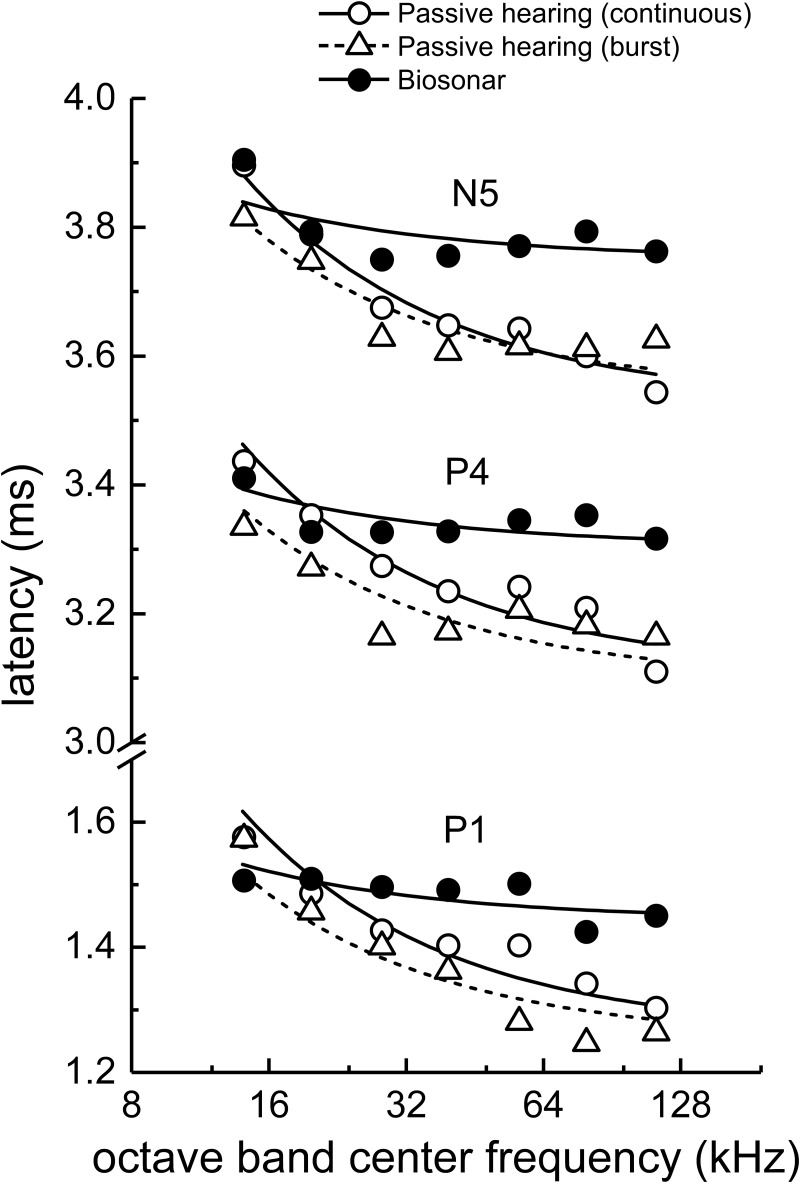
Derived-band amplitudes for P1 (Fig. 6, left) showed little variation with frequency from 14 to 32 kHz and only small increases above 32 to 64 kHz. P4 amplitudes were relatively flat below 64 kHz, but increased sharply from 64 to 113 kHz. Derived-band latencies (Fig. 6, right) showed little systematic change with frequency, especially P4 and N5 latencies at frequencies above 14 kHz. When fitting Eq. (1) to the latency data, there were no significant differences between the best-fit values of k across subjects or ABR peaks [F(5,30) = 1.35, p = 0.269], therefore the latencies were fit using a shared value of k = 1.24 (SE = 0.318). The resulting goodness of fit (R2) for P1, P4, and N5 for each subject were sometimes poor [0.547, 0.438, and 0.199, respectively, for SAY and −0.0539, −0.247, and 0.530, respectively, for TRO], reflecting the lack of a significant trend of latency decreasing with increasing frequency as predicted by Eq. (1). Best-fit values of τ0 for P1, P4, and N5 were 1.50, 3.36, and 3.80 (SE = 0.0179), respectively, for SAY and 1.39, 3.25, and 3.70 (SE = 0.0179), respectively, for TRO. When the latencies for SAY and TRO were averaged (see Fig. 13), fits were generally better: R2 = 0.446, 0.359, and 0.521 for P1, P4, and N5, respectively. Best-fit values of τ0 for the mean latencies of P1, P4, and N5 were 1.48, 3.34, and 3.78 (SE = 0.0179), respectively.
FIG. 6.
(Left panels) Narrowband ABR peak amplitudes and (right panel) latencies obtained during biosonar testing with the dolphins SAY and TRO. P1 amplitudes (left) showed little variation with frequency from 14 to 32 kHz and only small increases above 32 to 64 kHz. P4 amplitudes were relatively flat below 64 kHz, but increased sharply from 64 to 113 kHz. Derived-band latencies (right) showed little systematic change with frequency, especially P4 and N5 latencies at frequencies above 14 kHz. The solid lines in the right panel indicate the best fits of Eq. (1) to the latency data. In the right panel, symbols plotted at the abscissa position labeled “unmask” indicate the peak latencies of the unmasked ABRs.
FIG. 13.
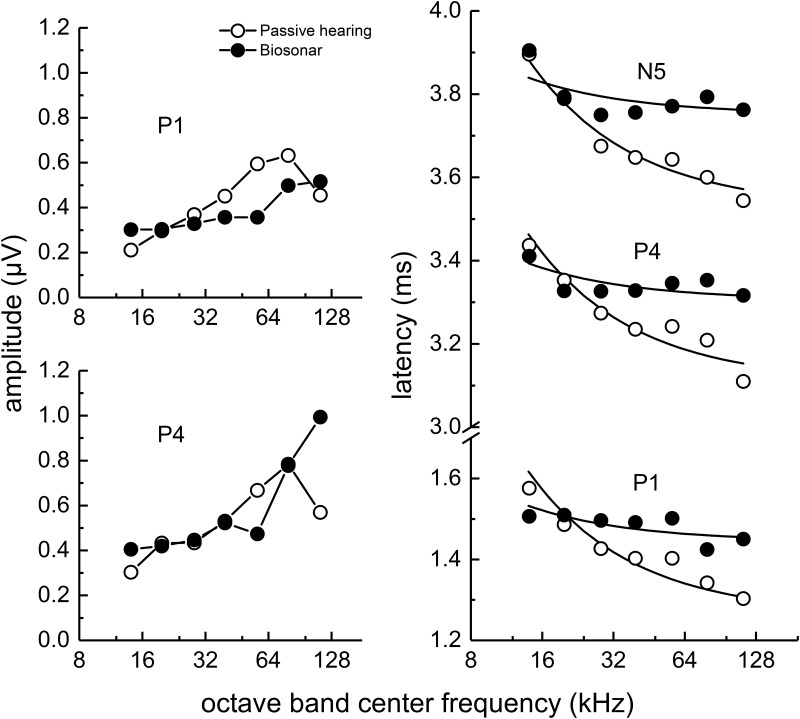
Comparison of narrowband ABR peak amplitudes and latencies for the biosonar and passive listening (under-masked) tasks. Data for SAY and TRO are averaged. Latencies are similar at the lowest frequencies; however, the biosonar latencies show little change with frequency above 28 kHz, indicating that the dolphin's self-heard click is not represented neurally as an FM downsweep, but retains its impulsive nature.
D. Discussion
The subtractive HPN method was used to separate the broadband ABR evoked by a dolphin's self-heard click into octave-bands with center frequencies from 14 to 113 kHz. However, interpretation of the derived-band ABR amplitudes and latencies is somewhat complicated by (1) under-masking of the self-heard click by the noise bursts and (2) lack of knowledge of the spectral pattern of the actual acoustic stimulus received by the ear from the self-heard click (e.g., what filtering occurred due to anatomical structures between the click source and the ear). To address these issues, a series of passive listening, subtractive high-pass masking noise experiments were conducted with the same two dolphins.
III. PASSIVE LISTENING TASK
A. Introduction
The goals of the passive listening experiments were to collect baseline, derived-band ABR data for a click stimulus with known frequency content, evaluate the effects of the under-masking condition observed in the biosonar task, and obtain functions relating narrowband ABR amplitudes and latencies to a variety of stimulus SPLs. Two experiments were conducted: the first experiment focused on the effects of under-masking, while the second focused on the effects of click level.
B. Methods
Experimental methods were similar to those used previously to obtain dolphin derived-band ABRs to frequency-compensated click stimuli (Finneran et al., 2016b). The dolphin subjects and test site were the same as those in the biosonar experiment described above.
1. Stimuli
Click stimuli consisted of ∼5-μs rectangular pulses that were digitally compensated to obtain spectrally pink conditions from 10 to 160 kHz [see above, Fig. 4(c)], then converted to analog at 1 MHz (PCIe-6361, National Instruments, Austin, TX). Click stimuli were presented at intervals of ∼28 ms, with the polarity alternated on successive presentations. Analog clicks were band-pass filtered from 0.2 to 200 kHz (8-pole Butterworth, 3C module, Krohn-Hite Corporation, Brockton, MA) and attenuated if necessary (0–70 dB, custom) [Fig. 2(b)]. Three-second digital noise sequences, with low-pass frequencies of 160 kHz and high-pass frequencies varying from 10 to 113 kHz in 1/2-octave intervals (i.e., matched to the biosonar task), were digitally generated using an inverse-FFT method, then compensated to obtain pink conditions as described above. Noise sequences were converted to analog at 500 kHz (USB-6251, National Instruments, Austin, TX) and attenuated (PA5, Tucker-Davis Technologies, Alachua, FL). The 3-s noise samples were looped (i.e., continuously generated) during ABR measurements with no temporal correlation between the noise sample onset and the click stimulus onset. Both the click and noise signals were input to a single amplifier (7600M, Krohn-Hite Corporation, Brockton, MA) used to drive a piezoelectric transducer (ITC 5446, International Transducer Corp, Santa Barbara, CA). The transducer was located at a depth of 0.7 m, approximately 1 m in front of a biteplate upon which the subject was positioned.
In the first passive listening experiment (effects of under-masking), click levels were chosen to produce high-amplitude, broadband ABRs that were not saturated (i.e., ABR amplitudes were near the upper end of the linear portion of the input−output function). The resulting click peak-equivalent SPLs (peSPLs; Burkard, 1984) were 140 and 150 dB re 1 μPa for SAY and TRO, respectively. Two noise conditions were used: the noise level in the fully masked condition was set just high enough so the 10-kHz HPN completely masked the click ABR, while the noise level in the under-masked condition was lowered to approximate the ABR amplitudes measured in the biosonar task with the 10-kHz HPN. The resulting 1/3-octave noise SPLs were 125 and 118 dB re 1 μPa for SAY, and 130 and 123 dB re 1 μPa for TRO, in the fully and under-masked conditions, respectively.
In the second passive listening experiment (effects of click level), noise levels were fixed at those used for the under-masked condition (118 and 123 dB re 1 μPa for SAY and TRO, respectively) while click peSPLs varied (depending on the HPN cutoff frequency) from 110 to 140 dB re 1 μPa for SAY and 110 to 150 dB re 1 μPa for TRO. The second experiment included conditions in which click and noise levels matched those from the under-masked condition from the first experiment, resulting in a replicate set of data for each subject.
2. ABR measurements and analysis
ABRs were measured as in the biosonar experiment, using the same electrode montage, with the instantaneous EEG digitized at 100 kHz with 16-bit resolution using the PCIe-6361 (National Instruments, Austin, TX). EEG data were collected in 27-ms epochs that were temporally aligned with the onset of each click and streamed to disk for later analysis. A total of 1024 epochs of EEG data were collected in each measurement. The ABR from a single measurement was obtained from the EEG by first low-pass filtering at 3 kHz using a zero-phase implementation of a sixth-order Butterworth filter, then synchronously averaging the 1024 epochs using a weighted averaging technique (Hoke et al., 1984; Elberling and Wahlgreen, 1985). Measurements were repeated within and across sessions (days) so that four ABRs were obtained for each experimental condition. The four individual ABRs (each based on 1024 epochs) were then coherently averaged, yielding an ABR for each experimental condition based on 4096 EEG epochs. ABRs were analyzed as described above. To account for electronic delays incurred during stimulus generation and acoustic propagation time, latency values were corrected by subtracting the time of arrival measured for the compensated acoustic click peak instantaneous sound pressure; i.e., ABR latencies were based on the estimated time of arrival of the click at the ear. ABR peak latencies as functions of stimulus peSPL (i.e., latency-intensity functions) were fit with linear equations. Best-fit values for the regression slope were compared using the extra sum-of-squares F test with α = 0.05 (Graphpad Software, 2014); if no significant differences were found, the data were re-fit using a shared slope.
C. Results
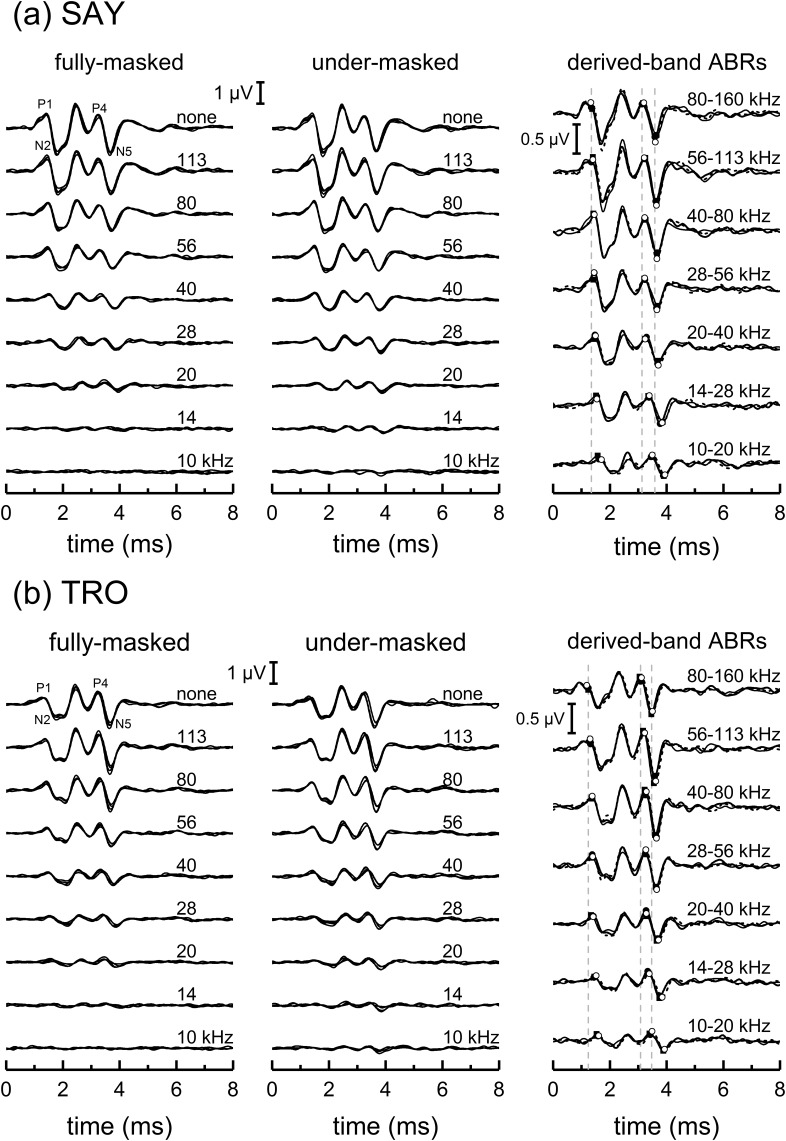
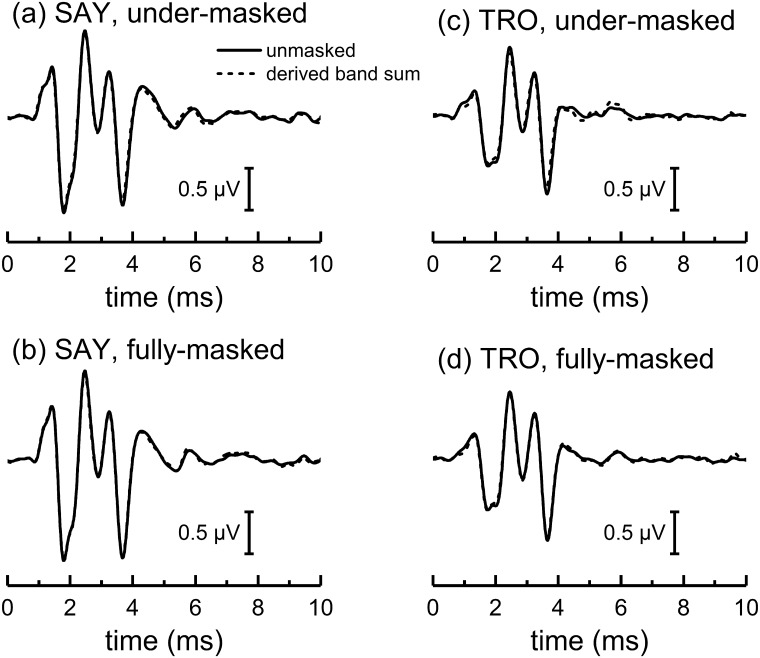
ABRs measured in the presence of HPN (Fig. 7) were similar for the fully and under-masked conditions, with the typical morphology seen in dolphins. Derived-band ABRs were also similar for the fully and under-masked conditions and there were no substantial differences between the summed derived-band ABRs and the unmasked ABR for each subject and condition (Fig. 8).
FIG. 7.
ABRs measured during the passive listening task for the dolphins (a) SAY and (b) TRO showing the effects of under-masking. For each subject, the two left panels show four ABR measurements, each based on 1024 epochs, measured in the presence of HPN with various cutoff frequencies (denoted by text legends), for the fully and under-masked conditions. Narrowband ABRs (right panels) were derived by sequentially subtracting the ABRs obtained with noise having cutoff frequencies separated by one octave. Solid lines and dashed lines represent the narrowband ABRs from the under-masked and fully masked conditions, respectively. Filled and open circles indicate the specific values for the ABR peak amplitudes and latencies extracted for analysis, for the under-masked and fully masked conditions, respectively. The narrowband ABRs from the second passive listening experiment that replicated the under-masked condition (right panels, thin solid lines and filled squares) are also shown. Vertical, dashed lines indicate the latencies of P1, P4, and N5 for the 80–160 kHz band in the under-masked condition.
FIG. 8.
Comparison of unmasked ABRs with the sums of the derived, narrowband ABRs, based on 1/2-octave bands, obtained during the passive listening task. The similarity between the ABR waveforms in each case confirms that the unmasked ABR can be represented by the linear sum of the individual derived-band ABRs, i.e., that the masking noise was effective in limiting the spread of activation to higher-frequency cochlear regions, and that significant over-masking (apical spread of masking) did not occur.
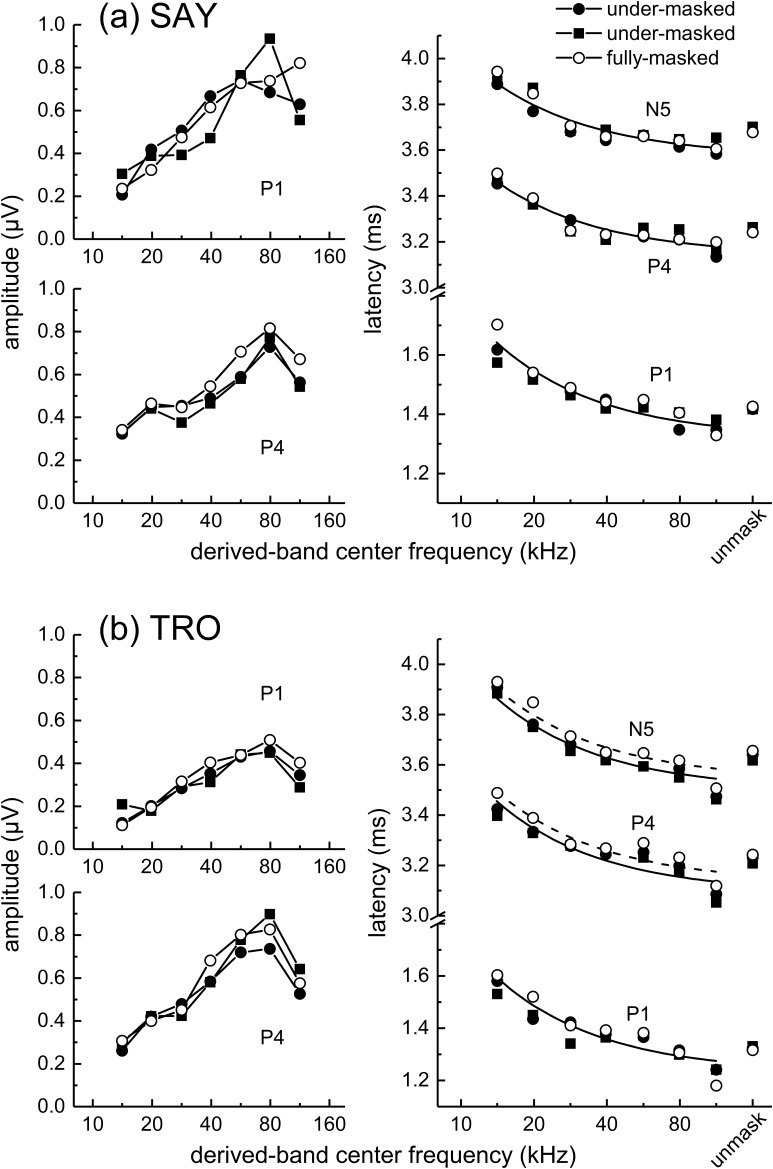
Derived-band amplitudes (Fig. 9, left panels) generally increased with frequency up to 80 kHz, then decreased from 80 to 113 kHz. Amplitude values and frequency-dependent patterns were similar between the fully and under-masked conditions for both SAY and TRO. Derived-band latencies (Fig. 9, right panels) for the fully and under-masked conditions decreased with increasing frequency and had similar magnitudes. When fitting Eq. (1) to the latency data for each subject, there were no significant differences between the best-fit values of k for P1, P4, or N5 between noise conditions [F(5,51) = 1.81, p = 0.127 for SAY and F(5,51) = 2.10, p = 0.0807 for TRO], therefore curve-fitting was performed using a shared value of k for each subject [k = 4.52 ± 0.196 for SAY and 5.12 ± 0.255 for TRO]. The resulting fits were generally good (0.798 ≤ R2 ≤ 0.931). For SAY, there were no significant differences between the best-fit values of τ0 for the fully and under-masked conditions [P1: τ0 = 1.32 ms, F(1,19) = 2.30, p = 0.146; P4: τ0 = 3.14 ms, F(1,19) = 0.276, p = 0.605; N5: τ0 = 3.57 ms, F(1,19) = 0.585, p = 0.454]. For TRO, there were no significant differences between the best-fit values of τ0 for P1 [τ0 = 1.23 ms, F(1,19) = 0.855, p = 0.367]; however, best-fit values of τ0 were different for P4 [fully masked: 3.13 ms, under-masked: 3.09 ms, F(1,19) = 4.70, p = 0.0431] and N5 [fully masked: 3.54 ms, under-masked: 3.50 ms, F(1,19) = 5.91, p = 0.0251]. For comparison to the biosonar data (see Fig. 13), Eq. (1) was also fit to the latencies from just the under-masked condition. In this case, there were no significant differences between best-fit values of k across ABR peaks [F(2,78) = 2.54, p = 0.0857], so a shared value of k = 4.55 was used. The best-fit values of τ0 were 1.28, 3.12, and 3.54 ms and the R2 values were 0.726, 0.855, and 0.839 for P1, P4, and N5, respectively.
FIG. 9.
Narrowband ABR peak amplitudes and latencies measured for the dolphins (a) SAY and (b) TRO in the first passive listening experiment show the effects of under-masking on the shapes of the amplitude and latency functions to be minimal. No systematic differences occur in the narrowband ABR amplitudes between the under-masked and fully masked conditions, and no significant effects of under-masking are seen on the shapes of the latency functions; i.e., latency functions for SAY were identical for the under-masked and fully masked conditions, and TRO's latency functions for the under-masked condition were parallel to those for the fully masked condition, but shifted by 40 μs. In the right panels, symbols plotted at the abscissa position labeled “unmask” indicate the peak latencies of the unmasked ABRs.
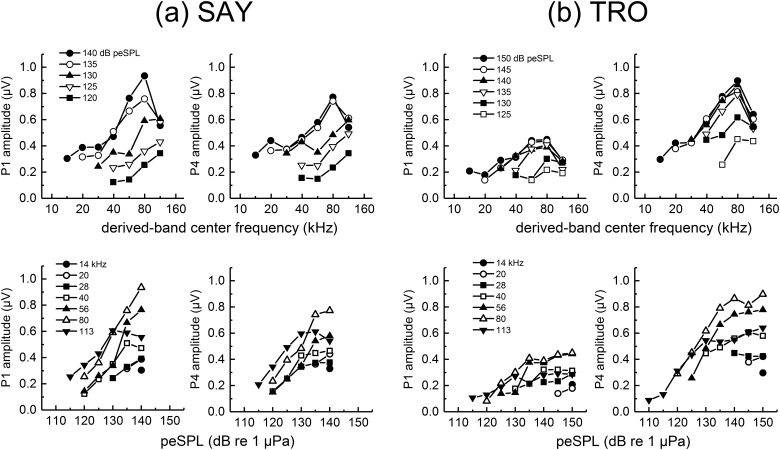
Derived, narrowband ABR peak-peak amplitudes as functions of stimulus level (Fig. 10) showed that P1 and P4 amplitudes tended to increase with stimulus level up to ∼130 to 140 dB re 1 μPa but plateaued at higher levels, indicating saturation of the narrowband ABRs. SPLs at which saturation occurred were frequency-dependent, with the highest frequency band (113 kHz) exhibiting saturation at lower SPLs than the 80-kHz band and the largest dynamic range from 56 to 80 kHz in both subjects.
FIG. 10.
Narrowband ABR amplitudes for (a) SAY and (b) TRO measured during the second passive listening task. The same data are shown as functions of derived-band center frequency (upper panels) and stimulus peSPL (lower panels).
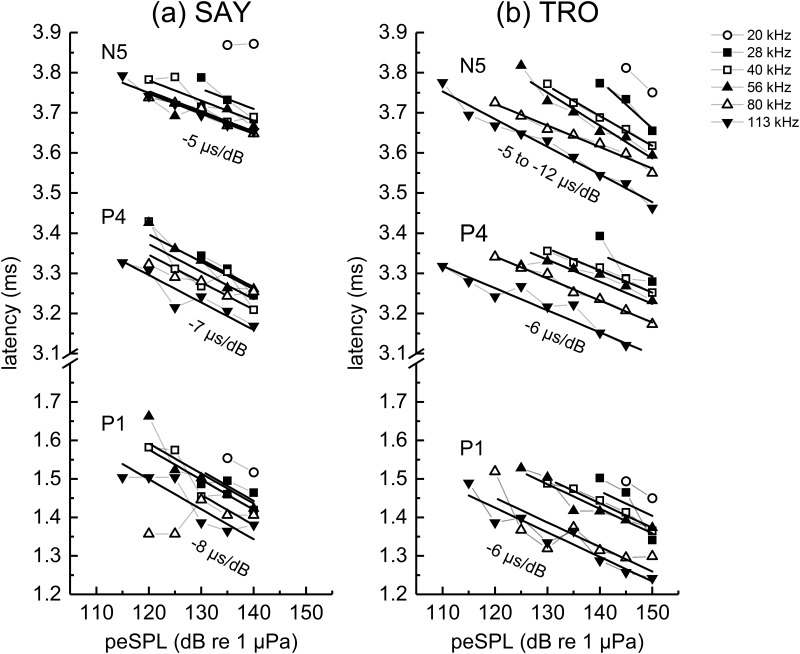
Changes in ABR peak latencies for P1, P4, and N5 were generally linear with stimulus peSPL (Fig. 11). For SAY, goodness of fit was highly variable (mean R2 = 0.474, SD = 0.857), depending on frequency and ABR peak. Single values of the slope were found to be adequate for fits to SAY's P1, P4, and N5 latencies across derived-band center frequencies [P1: slope = −8 μs/dB, F(4, 12) = 1.25, p = 0.343; P4: slope = −7 μs/dB, F(4, 14) = 1.71, p = 0.204; N5: slope= −5 μs/dB, F(4, 14) = 2.88, p = 0.0624]. Linear fits to TRO's latency data were generally good (mean R2 = 0.843, SD = 0.154). Single values of the slope were adequate for fits to P1 and P4 [P1: slope = −6 μs/dB, F(4, 19) = 1.07, p = 0.399; P4: slope = −6 μs/dB, F(4, 20) = 2.12, p = 0.116], but not N5 [slopes varied from −5 to −12 μs/dB, F(4, 20) = 4.24, p = 0.0121]. For the N5 latencies for TRO, four of the five slopes were between −5 and −8 μs/dB, while the best-fit slope at 28 kHz was steeper (−12 μs/dB).
FIG. 11.
Narrowband ABR peak latencies for (a) SAY and (b) TRO measured during the second passive listening task. The solid lines show the best linear fits to the latency vs peSPL data. Series with only two data points were excluded from curve-fits. The values for P1 data for SAY at 125 and 130 dB were also excluded from fitting; the discontinuous nature of the latency data suggested a shift in the measured peak due to peak splitting.
D. Discussion
One of the main goals of the passive listening experiments was to assess the effects of under-masking of the broadband click that occurred during the biosonar experiments. Results from the first passive listening experiment suggest that the effects of under-masking would be minimal: No systematic differences were seen in the narrowband ABR amplitudes between the fully and under-masked conditions, and no significant effects of under-masking were seen on the latency function [Eq. (1)] fitting parameter k for each subject. The only systematic difference between the fully and under-masked conditions was the value of τ0 for the P4 and N5 peak latencies in TRO. For these cases, the under-masked condition resulted in a latency shift of −40 μs relative to the fully masked condition; i.e., latency functions for the under-masked condition were parallel to those for the fully masked condition, but shifted by 40 μs. Since the present study is primarily concerned with how the latency functions change with frequency, these systematic, frequency-independent latency shifts do not affect the main conclusions. The lack of significant effects of under-masking (relative to the fully masked condition) in the derived, narrowband ABRs obtained with pink clicks and noise matches the findings of Parker and Thornton (1978), who stated that “Common elements of the waveforms (due to under-masking) are cancelled in the subtraction operation and therefore play no part in contributing to the derived waveform”; however, similar comparisons have not been made when the spectrum of the click differs substantially from that of the noise.
The second goal of the passive listening experiments was to generate functions showing the manner in which the narrowband ABR amplitudes and latencies varied with click SPL. The results showed that saturation of the narrowband ABR P1 and P4 amplitudes occurred at peSPLs >130 dB re 1 μPa, but the specific saturation levels were frequency-dependent. This means that narrowband ABR amplitudes measured at a single, but relatively high, stimulus SPL may exhibit complex frequency patterns (e.g., Fig. 9), since saturation may occur in some frequency bands but not others. Slopes of the latency functions (Fig. 11) were between −5 and −8 μs/dB for all but one of the experimental conditions and did not show effects of the amplitude saturation; i.e., the latency slopes did not change when the SPL increased above the amplitude saturation point. Taken together, the amplitude and latency functions (Figs. 10 and 11) indicate that changes in the stimulus level within a single frequency band would be expected to change the resulting narrowband ABR peak latency, but may not change the amplitude if the SPLs are already within the saturation region. These general findings are similar to those reported for waves I and III in humans, where derived, narrowband ABR amplitudes exhibited dynamic ranges of 20 to 30 dB followed by saturation, but latencies continued to decrease at stimulus levels above those causing saturation (Eggermont and Don, 1980). These findings also suggest that timing-based neural computations in dolphin hearing (and biosonar) are likely to be more robust than amplitude-based computations.
IV. GENERAL DISCUSSION
A. Comparison of biosonar and passive listening data
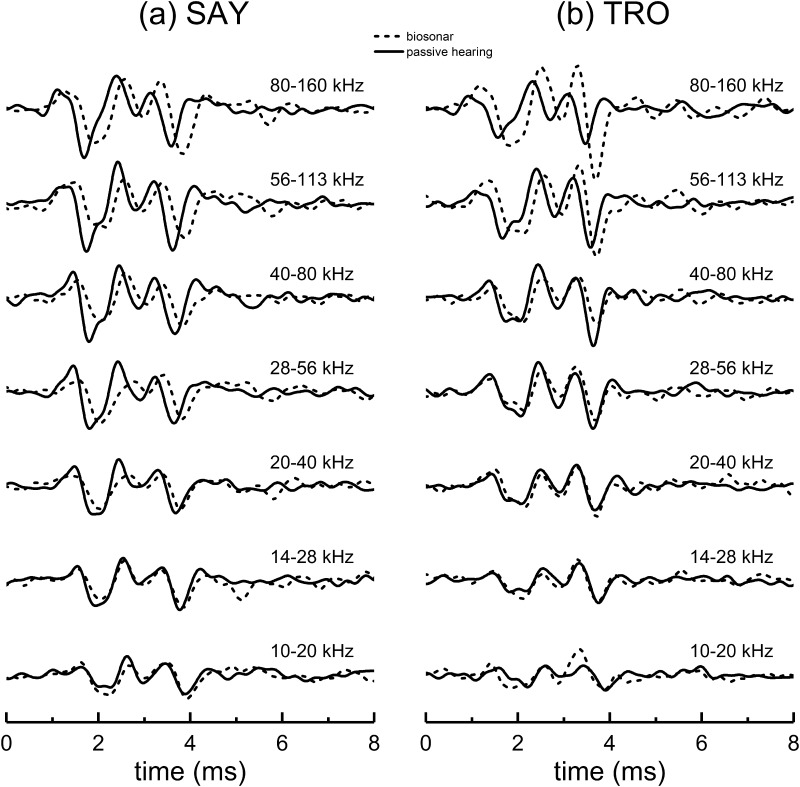
Figures 12 and 13 compare the ABR waveforms and mean narrowband ABR amplitudes and latencies for SAY and TRO during the biosonar task and the passive listening task (under-masked condition). The most striking differences occur in the latencies: biosonar latencies are close to the passive listening data at the lowest frequencies, but at higher frequencies (≥28 kHz) the biosonar latencies are longer and change much less with increasing frequency. Therefore, the neural representation of the self-heard biosonar click of the dolphin is highly synchronous and does not strongly resemble that of an FM downsweep. As each ABR wave corresponds to a different site of neural activity (e.g., P1 associated with auditory nerve, P4 with the inferior colliculus), the synchrony at different levels of the auditory system argues for synchronization occurring at the level of cochlear innervation with delays equally propagating through the ascending auditory pathway (i.e., the latency vs frequency curves in Fig. 13 are parallel).
FIG. 12.
Comparison of narrowband ABR waveforms obtained during the biosonar and passive listening (under-masked) tasks. For the lower frequency bands, the peak latencies for the biosonar and passive listening data are similar; however, there are substantial latency differences in the higher frequency bands.
B. Methodological considerations
1. Temporal effects of masking
When comparing the biosonar and passive listening data (Figs. 12 and 13), some consideration must be given to the differences in masking signals used for the two experiments. While the passive listening experiments used continuous masking noise, the biosonar experiments used pulsed maskers, presented infrequently, to prevent the dolphins from changing click emissions with HPN condition. Human psychophysical threshold measurements have demonstrated elevated masked thresholds when signals are presented shortly after the onset of pulsed maskers, a phenomenon called “overshoot” or the “temporal effect” (Elliott, 1965; Zwicker, 1965; Viemeister and Plack, 1993). Threshold elevations up to ∼10 dB have been reported, and are larger for shorter signals and broadband maskers (Fastl and Zwicker, 2007). A pulsed masker also likely elicits a synchronized onset response (e.g., ABR); therefore, the time between the onset of the noise burst and the biosonar click may have affected the self-heard click ABR (though in the present study, the 2-ms rise/fall time of the noise burst would have reduced this to some extent). If temporal effects of masking such as overshoot are observed in the ABR, and if this leads to greater latency effects on the higher-frequency regions of the cochlea, then jittering of the masking noise relative to the onset of the biosonar click may have changed the latency of the derived band ABR enough to obscure or reduce the systematic decrease in latency with increasing derived-band frequency in the biosonar experiment.
To assess the likelihood that the pulsed masker significantly influenced the latency shift observed between the passive listening and biosonar data, a limited amount of additional passive listening data were collected with SAY and TRO, using spectrally pink clicks and noise bursts, with the noise temporal envelope and jitter matching that used in the biosonar experiment. The high-pass cutoff of each noise burst was randomly varied on a click-by-click basis within each trial. Click and noise levels matched those used in the first passive listening experiment. ABRs were analyzed as in the biosonar experiment to derive narrowband ABRs from the broadband ABRs measured in the presence of HPN bursts. The results were similar to those of the first passive listening experiment: the sums of the derived, narrowband ABR waveforms matched the unmasked ABR waveforms, and the shapes of the latency functions [i.e., the best-fit value of k in Eq. (1)] for the under-masked and fully masked conditions were similar. The best fits of Eq. (1) to the latency vs derived-band frequency data were flatter (i.e., smaller value of k) than those obtained with continuous noise maskers; however, both the continuous and pulsed masker data showed larger changes in latency at high frequencies compared to the biosonar data (Fig. 14). Therefore, although the pulsed masker may have elevated the masking effect of the noise relative to the continuous noise condition, the latency patterns of the derived, narrowband ABRs did not appear to be fundamentally affected.
FIG. 14.
To assess whether the pulsed masker influenced the latency shift between the passive listening and biosonar data, a limited amount of passive listening data were collected using noise burst maskers with temporal envelopes and jitter matching that used in the biosonar experiment. Both sets of passive listening data showed greater latency change with frequency compared to the biosonar data, indicating that the latency patterns of the derived, narrowband ABRs did not appear to be fundamentally affected by the use of pulsed masking noise.
To eliminate any complications from the use of pulsed maskers, the biosonar experiment would need to be replicated with continuous noise maskers. This would likely require conditioning dolphins to utilize clicks with similar spectra and level regardless of the noise cutoff frequency. Previous work has demonstrated that dolphin click emission can be shaped to some extent via operant conditioning (Moore and Pawloski, 1990). This could perhaps be facilitated using a phantom echo system that only produced echoes if clicks met some pre-defined criteria.
2. Potential effects of under-masking
Masking noise levels achieved in the present study were insufficient to completely mask the self-heard click, thus some small amount (5–10 dB) of under-masking existed. Under-masking of the pink click in the passive listening experiment suggested that under-masking of the self-heard click was not the cause of the minimal latency shift with increasing frequency observed in the present study; however, the comparison with the biosonar data is not perfect since the biosonar click and pink noise have different spectra, while the passive listening experiments used clicks and noise with identical spectra. This potential issue could be addressed in future studies examining the effects of under-masking when the click stimuli and masking noise have substantially different spectra (e.g., pink noise and a “dolphin-like” click).
C. Potential causes of latency shifts
The latencies of the narrowband ABRs to the self-heard clicks were larger than those to the external, spectrally pink clicks at higher frequencies, despite the farfield biosonar click possessing relatively more high-frequency energy (at least up to 120 kHz) compared to the pink click. Three potential mechanisms are hypothesized to account for these latency differences: (1) spectral differences between self-heard acoustic clicks and external, spectrally pink clicks, (2) forward-masking from previously emitted biosonar clicks, and (3) neural inhibition accompanying the emission of biosonar clicks.
The lack of significant latency changes with increasing frequency in the self-heard click ABR compared to that observed with the spectrally pink click may indicate that the spectral amplitudes of the self-heard click decreased with increasing frequency; i.e., the self-heard acoustic click was effectively low-pass filtered compared to the spectrally pink click. It is feasible that the collective effect of sound propagation through anatomical structures (bone, soft tissues and airspaces) between the source of the echolocation click (the phonic lips) and the auditory bulla, combined with the lower frequency content of off-axis dolphin clicks (Finneran et al., 2014), could result in a net attenuation of higher-frequency components.
If the present results are due to reduced high-frequency energy in the self-heard clicks, the extent of low-pass filtering required to obtain the observed latency shifts can be estimated using the latency-intensity functions measured during the passive listening task (Fig. 11). Within each frequency band, the latency differences between the biosonar and passive listening data ranged from ∼50–90 μs at 28 kHz to ∼150–200 μs at 113 kHz, with the smallest differences occurring with P1 and the largest with N5. Assuming a 7-μs/dB latency-amplitude relationship (e.g., Fig. 11), these latencies represent within-band amplitude differences of 7 to 29 dB between the self-heard click and a spectrally pink click. Therefore, the latency patterns for the biosonar clicks could be explained by low-pass filtering of the self-heard click, with the amount of attenuation (relative to the pink click) ranging from ∼7 dB for the 28-kHz band to ∼29 dB for the 113-kHz band. Although the amplitude relationships between the narrowband ABRs from the passive listening and biosonar tasks (Fig. 13, left panels) do not show strong evidence of a low-pass filtering effect, saturation of the ABR within each frequency band may be responsible. Figure 9 shows that narrowband ABR amplitudes often showed little change once peSPLs of the spectrally pink click exceeded ∼130 dB re 1 μPa. Given the spectral and level differences between the farfield biosonar clicks and the clicks used for the passive listening experiments (Fig. 4), it is possible that the self-heard click possesses sufficient amplitude to saturate the ABR within many frequency bands. As the slope of the latency functions remain unchanged within the region of saturation, a range of self-heard click peSPLs could result in equal peak-peak amplitudes but different latencies.
It is also possible that forward masking from the previously emitted click affected the narrowband ABRs at higher frequencies more than those at lower frequencies. Finneran et al. (2013a) reported that effects of forward masking from dolphin echolocation clicks could persist for at least 100 ms; similarly, forward masking can affect wave V latency of the human ABR for a time period of up 100 ms (see, e.g., Burkard and Hecox, 1987). Also, Finneran et al. (2016a) showed that dolphin auditory steady-state responses (ASSRs) to externally presented tones at ∼50−100 kHz were not only reduced in amplitude after biosonar click emission, but that a residual amplitude reduction could occur when the ASSRs did not completely recover before emission of the next click. Residual suppression was observed with biosonar click p-p source levels from 204 to 209 dB re 1 μPa at 1 m and ICIs from ∼40 to 100 ms (Finneran et al., 2016a), similar to those from the present study (mean p-p source levels across HPN frequency were 205 and 208–209 dB re 1 μPa at 1 m for SAY and TRO, respectively, and median ICIs were 38–39 ms and 64–65 ms for SAY and TRO, respectively). Therefore, it is possible that higher-frequency neural responses to the self-heard clicks were suppressed to some extent by residual masking from the previous click, contributing to increased latencies for the higher-frequency neural responses.
It is also possible that there is some form of neural inhibition that reduces neural responses when biosonar pulses are emitted. In bats and humans (and likely other terrestrial animals), the acoustic reflex is elicited prior to vocalization (Henson, 1965; Borg and Zakrisson, 1975). It is not known if there is a functional acoustic reflex in dolphins; however, it is not unreasonable to suppose an alternative mechanism (e.g., neural inhibition) that reduces neural responses from emitted biosonar pulses (see Suga and Shimozawa, 1974).
D. Implications for biosonar
One of the main goals of this study was to test the hypothesis that frequency-dependent dispersion of the impulsive biosonar click within the dolphin cochlea results in a neural representation with similar characteristics to that of an FM downsweep. This prediction was partially based on the FM nature of the biosonar chirps of some echolocating bats as they relate to models of the neural systems underlying target ranging and shape perception (Simmons, 2012; Simmons and Gaudette, 2012; Simmons et al., 2014). Saillant et al. (1993) have described a plausible model [the spectrogram correlation and transformation (SCAT) receiver] in which target range perception is based upon neural delay lines and coincidence detectors that compute the time difference between the occurrences of specific frequencies in the bat's outgoing chirp and in returning echoes. As the FM nature (i.e., rate of modulation) of both the outgoing vocalization and the incoming echo are not affected during transmission, this computation can be done on a within-frequency basis as the delay between frequency-specific components of the vocalizations and echoes are constant across the entire FM sweep. In contrast, determinations of target shape based on echo highlights within an integration window (i.e., within approximately 200–300 μs) are potentially computed on an across frequency basis using neural delay lines and coincidence detectors (Simmons and Gaudette, 2012).
While this model is plausible based on behavioral and physiological data for FM bats, it is difficult to determine if a similar processing mode exists in bottlenose dolphins. Based on the present data, within-frequency comparisons at a neural level between dolphins' outgoing clicks and incoming echoes would be confounded by the neural representation of the click appearing impulsive, while incoming echoes would be subject to some degree of frequency distortion due to cochlear dispersion (and amplitude-latency trading): At high frequencies relevant to biosonar (i.e., ≳28 kHz), the self-heard click latencies are delayed relative to the external click by 100–200 μs; therefore, within-frequency delay comparisons would result in range errors of approximately 15–30 cm (assuming a sound speed of 1500 m/s). Similarly, transformation of echo spectral nulls into time delays using across-frequency delay lines and coincidence detectors would also seem to be problematic, given the observed latency differences between the neural representation of the self-heard clicks and external clicks (i.e., echoes). However, we cannot rule out the possibility that delay lines and coincidence detectors in the dolphin already compensate for the dispersion in delays at higher frequencies—the functional neural architecture of the dolphin at the single unit level is unknown. Furthermore, it must be kept in mind that the ABRs measured in the present study represent summed activity from multiple generator sites, and thus may not represent unit level activity. However, peak latency changes with frequency for P1, P4, and N5 were essentially parallel, suggesting that the primary latency effects observed in the present study are the result of processes occurring within or before the cochlea and thus would be expected to affect low-level neural activity in a similar fashion.
In summary, dolphins and bats share a number of behavioral and physiological similarities with regards to biosonar, but there might be differences at the level of neural processing that preclude the direct application of some models developed for FM bats to biosonar processing in dolphins. Due to the scarcity of neurophysiological data in dolphins relative to bats (primarily at the level of implanted electrodes and single unit recordings), it is difficult to speculate on the precise nature of these differences. ABRs have been measured in an FM bat (the big brown bat, Eptesicus fuscus) to external clicks and FM downsweeps (Burkard and Moss, 1994); however, ABRs to self-heard pulses have not been measured. For this reason, the degree to which the neural representations of self-heard pulses and external pulses match cannot be assessed and direct comparisons with the present study cannot be made.
E. Frequency-specific characteristics of the dolphin ABR
The ABR of the bottlenose dolphin (and other odontocete cetaceans) has been used to study auditory performance in both passive hearing and echolocation tasks. Studies typically rely on the amplitude of ABR peaks (or p-p amplitude of the entire ABR) as a metric of auditory response strength for a particular stimulus. It could be assumed that increasing ABR peak amplitudes for increasing stimulus SPLs result from monotonic (if not linear) increases in peak amplitudes across all stimulated cochlear frequency bands. Based on the data in this study, this does not appear to be the case; passive listening data show dynamic range within relatively narrow cochlear regions is small (20–30 dB). Increases in unmasked narrowband ABR amplitudes over larger ranges of stimulus SPL are more likely due to the spread of activation along the basilar membrane, primarily arising from an upward (i.e., basal) spread of activation as signal SPL increases. Understanding how summation across frequency bands contributes to the amplitude of unmasked broadband ABR amplitudes (e.g., click-evoked ABRs) is further complicated by the fact that the level at which saturation of narrowband ABRs occurs is frequency dependent.
The complexities of resolving cochlear place-specific contributions to ABR amplitudes produced in response to broadband signals also means that estimates of the dolphin's perception of self-heard clicks based on comparison of broadband ABRs to external and self-heard clicks are problematic; i.e., equal broadband ABR amplitudes for self-heard and externally presented clicks may only indicate similar received levels if the two acoustic stimuli are temporally and spectrally identical at the inner ear. In other cases, the complex interaction between frequency-dependent saturation and basilar spread of activation makes equal broadband ABR amplitudes difficult to interpret. Caution should therefore be exercised in conclusions based upon broadband ABRs in response to signals with different spectra.
F. Dolphin manipulation of biosonar emissions
A final note is in order regarding the difficulty experienced in this study attempting to acoustically mask the dolphins' self-heard biosonar pulses. Preliminary data revealed that if masking noise with a fixed high-pass cutoff frequency was continuously presented during trials, the dolphins would adjust click SPLs and bandwidth depending on the noise characteristics. Furthermore, when preliminary sessions used short-duration noise bursts with a fixed timing relationship to the emitted click, the dolphins manipulated ICIs to temporally place their clicks either before or after the noise bursts, sometimes resulting in ICIs much longer than would typically be expected for the short target range employed. It was only by estimating the instantaneous ICI on a click-by-click basis that noise bursts could be produced that temporally overlapped the biosonar clicks. These anecdotes reinforce long-reported observations that dolphins have exceptional control over many aspects of the timing, amplitude, and spectral content of their click emissions.
V. CONCLUSIONS
-
(1)
High-frequency neural responses (i.e., ABR peaks) in response to the bottlenose dolphin's self-heard click are delayed such that latency differences across the frequency range ∼28 to 160 kHz are small. The neural representation of the self-heard click is therefore highly synchronous and does not strongly resemble that of an FM downsweep.
-
(2)
The lack of systematic decrease in self-heard click-evoked ABR latencies could be caused by several factors, including: (a) attenuation of higher frequencies in the self-heard click due to sound transmission within the tissues of the head (i.e., self-heard biosonar clicks may have less high-frequency content compared to clicks recorded on the main beam axis in the farfield); (b) forward masking of the biosonar clicks by previously emitted clicks, resulting in frequency-dependent changes in ABR latency; (c) some form of active inhibition prior to the onset of the biosonar click that influences (inhibits) the neural response to self-heard clicks at higher-frequencies.
-
(3)
Peaks in the narrowband ABRs in dolphins show a limited dynamic range of ∼20 to 30 dB. This means that for stimuli more than 20 to 30 dB above threshold, the ABR amplitude increase observed with increasing stimulus SPL occurs via the broadening of activation across frequency bands at the cochlear level, rather than an increase in neural activity associated with the same cochlear place.
ACKNOWLEDGMENTS
The authors thank Randall Dear, Jim Powell, Megan Tormey, Gavin Goya, Amy Black, Danielle Ram, Roxanne Echon, Teri Wu, Katie Christman, Rachel Simmons, Lara Curtis, and the animal care, training staff, and interns at the Navy Marine Mammal Program. The authors also thank Eric Lal for assistance with the data collection and Robert Burkard for helpful discussions of the data and reviewing an earlier draft of this manuscript. The study followed a protocol approved by the Institutional Animal Care and Use Committee at the Biosciences Division, Space and Naval Warfare Systems Center (SSC) Pacific and the Navy Bureau of Medicine and Surgery, and followed all applicable U.S. Department of Defense guidelines. Financial support was provided by the Office of Naval Research Code 32 (Mine Countermeasures, Acoustics Phenomenology & Modeling Group).
References
- 1. Au, W. W. L. (1993). The Sonar of Dolphins ( Springer-Verlag, New York: ), 227 pp. [Google Scholar]
- 2. Au, W. W. L. , and Martin, S. W. (2012). “ Why dolphin biosonar performs so well in spite of mediocre ‘equipment,’ ” IET Radar, Sonar Navig. 6, 566−575. 10.1049/iet-rsn.2011.0194 [DOI] [Google Scholar]
- 3. Au, W. W. L. , and Simmons, J. A. (2007). “ Echolocation in dolphins and bats,” Phys. Today 60(9), 40−45. 10.1063/1.2784683 [DOI] [Google Scholar]
- 4. Borg, E. , and Zakrisson, J. E. (1975). “ The activity of the stapedius muscle in man during vocalization,” Acta Otolaryngol. 79, 325–333. 10.3109/00016487509124694 [DOI] [PubMed] [Google Scholar]
- 5. Burkard, R. (1984). “ Sound pressure level measurement and spectral analysis of brief acoustic transients,” Electroencephalogr. Clin. Neurophysiol. 57, 83–91. 10.1016/0013-4694(84)90010-5 [DOI] [PubMed] [Google Scholar]
- 6. Burkard, R. , and Hecox, K. E. (1987). “ The effect of broadband noise on the human brain-stem auditory evoked response. IV. Additivity of forward-masking and rate-induced wave V latency shifts,” J. Acoust. Soc. Am. 81, 1064–1072. 10.1121/1.394678 [DOI] [PubMed] [Google Scholar]
- 7. Burkard, R. , and Moss, C. F. (1994). “ The brain-stem auditory-evoked response in the big brown bat (Eptesicus fuscus) to clicks and frequency-modulated sweeps,” J. Acoust. Soc. Am. 96, 801–810. 10.1121/1.410318 [DOI] [PubMed] [Google Scholar]
- 8. Don, M. , and Eggermont, J. J. (1978). “ Analysis of the click-evoked brainstem potentials in man using high-pass noise masking,” J. Acoust. Soc. Am. 63, 1084–1092. 10.1121/1.381816 [DOI] [PubMed] [Google Scholar]
- 9. Eggermont, J. J. (1979). “ Narrow-band AP latencies in normal and recruiting human ears,” J. Acoust. Soc. Am. 65, 463–470. 10.1121/1.382345 [DOI] [PubMed] [Google Scholar]
- 10. Eggermont, J. J. , and Don, M. (1980). “ Analysis of the click-evoked brainstem potentials in humans using high-pass noise masking. II. Effect of click intensity,” J. Acoust. Soc. Am. 68, 1671–1675. 10.1121/1.385199 [DOI] [PubMed] [Google Scholar]
- 11. Elberling, C. , Don, M. , Cebulla, M. , and Sturzebecher, E. (2007). “ Auditory steady-state responses to chirp stimuli based on cochlear traveling wave delay,” J. Acoust. Soc. Am. 122, 2772–2785. 10.1121/1.2783985 [DOI] [PubMed] [Google Scholar]
- 12. Elberling, C. , and Wahlgreen, O. (1985). “ Estimation of auditory brainstem response, ABR, by means of Bayesian inference,” Scand. Audiol. 14, 89–96. 10.3109/01050398509045928 [DOI] [PubMed] [Google Scholar]
- 13. Elliott, L. L. (1965). “ Changes in the simultaneous masked threshold of brief tones,” J. Acoust. Soc. Am. 38, 738–746. 10.1121/1.1909798 [DOI] [PubMed] [Google Scholar]
- 14. Fastl, H. , and Zwicker, E. (2007). Psychoacoustics—Facts and Models ( Springer-Verlag, Berlin: ), 462 pp. [Google Scholar]
- 15. Finneran, J. J. , Branstetter, B. K. , Houser, D. S. , Moore, P. W. , Mulsow, J. , Martin, C. , and Perisho, S. (2014). “ High-resolution measurement of a bottlenose dolphin's (Tursiops truncatus) biosonar transmission beam pattern in the horizontal plane,” J. Acoust. Soc. Am. 136, 2025–2038. 10.1121/1.4895682 [DOI] [PubMed] [Google Scholar]
- 16. Finneran, J. J. , Echon, R. , Mulsow, J. , and Houser, D. S. (2016a). “ Short-term enhancement and suppression of dolphin auditory evoked responses following echolocation click emission,” J. Acoust. Soc. Am. 140, 296–307. 10.1121/1.4955093 [DOI] [PubMed] [Google Scholar]
- 17. Finneran, J. J. , Mulsow, J. , and Houser, D. S. (2013a). “ Auditory evoked potentials in a bottlenose dolphin during moderate-range echolocation tasks,” J. Acoust. Soc. Am. 134, 4532–4547. 10.1121/1.4826179 [DOI] [PubMed] [Google Scholar]
- 18. Finneran, J. J. , Mulsow, J. , Houser, D. S. , and Burkard, R. F. (2016b). “ Place specificity of the click-evoked auditory brainstem response in the bottlenose dolphin (Tursiops truncatus),” J. Acoust. Soc. Am. 140, 2593–2602. 10.1121/1.4964274 [DOI] [PubMed] [Google Scholar]
- 19. Finneran, J. J. , Wu, T. , Borror, N. , Tormey, M. , Brewer, A. , Black, A. , and Bakhtiari, K. (2013b). “ Bottlenose dolphin (Tursiops truncatus) detection of simulated echoes from normal and time-reversed clicks,” J. Acoust. Soc. Am. 134, 4548–4555. 10.1121/1.4824678 [DOI] [PubMed] [Google Scholar]
- 20.GraphPad Software (2014). “ GraphPad Prism (Version 6) [computer software]” (GraphPad Software, San Diego, CA).
- 21. Henson, O. W., Jr. (1965). “ The activity and function of the middle-ear muscles in echo-locating bats,” J. Physiol. 180, 871–887. 10.1113/jphysiol.1965.sp007737 [DOI] [PMC free article] [PubMed] [Google Scholar]
- 22. Herdman, A. T. , Picton, T. W. , and Stapells, D. R. (2002). “ Place specificity of multiple auditory steady-state responses,” J. Acoust. Soc. Am. 112, 1569–1582. 10.1121/1.1506367 [DOI] [PubMed] [Google Scholar]
- 23. Hoke, M. , Ross, B. , Wickesberg, R. , and Lutkenhoner, B. (1984). “ Weighted averaging—theory and application to electric response audiometry,” Electroencephalogr. Clin. Neurophysiol. 57, 484–489. 10.1016/0013-4694(84)90078-6 [DOI] [PubMed] [Google Scholar]
- 24. Masters, W. M. , and Jacobs, S. C. (1989). “ Target detection and range resolution by the big brown bat (Eptesicus fuscus),” J. Comp. Physiol. A 166, 65–73. 10.1007/BF00190211 [DOI] [Google Scholar]
- 25. Møhl, B. (1986). “ Detection by a pipistrelle bat of normal and reversed replica of its sonar pulses,” Acustica 61, 75–82. [Google Scholar]
- 26. Moore, P. W. B. , and Pawloski, D. A. (1990). “ Investigations on the control of echolocation pulses in the dolphin (Tursiops truncatus),” in Sensory Abilities of Cetaceans: Laboratory and Field Evidence, edited by Thomas J. A. and Kastelein R. A. ( Plenum, New York: ), pp. 305–316. [Google Scholar]
- 27. Nachtigall, P. E. (1980). “ Odontocete echolocation performance on object size, shape and material,” in Animal Sonar Systems, edited by Busnel R. G. and Fish J. F. ( Plenum, New York: ), pp. 71–95. [Google Scholar]
- 28. Parker, D. J. , and Thornton, A. R. (1978). “ Frequency specific components of the cochlear nerve and brainstem evoked responses of the human auditory system,” Scand. Audiol. 7, 53–60. 10.3109/01050397809043132 [DOI] [PubMed] [Google Scholar]
- 29. Popov, V. , and Supin, A. Y. (1990). “ Electrophysiological studies of hearing in some cetaceans and a manatee,” in Sensory Abilities in Cetaceans, edited by Thomas J. A. and Kastelein R. A. ( Plenum, New York: ), pp. 405–415. [Google Scholar]
- 30. Saillant, P. A. , Simmons, J. A. , Dear, S. P. , and McMullen, T. A. (1993). “ A computational model of echo processing and acoustic imaging in frequency-modulated echolocating bats: The spectrogram correlation and transformation receiver,” J. Acoust. Soc. Am. 94, 2691–2712. 10.1121/1.407353 [DOI] [PubMed] [Google Scholar]
- 31. Simmons, J. A. (2012). “ Bats use a neuronally implemented computational acoustic model to form sonar images,” Curr. Opin. Neurobiol. 22, 311–319. 10.1016/j.conb.2012.02.007 [DOI] [PubMed] [Google Scholar]
- 32. Simmons, J. A. , and Gaudette, J. E. (2012). “ Biosonar echo processing by frequency modulated bats,” IET Radar, Sonar Navig. 6, 556–565. 10.1049/iet-rsn.2012.0009 [DOI] [Google Scholar]
- 33. Simmons, J. A. , Houser, D. , and Kloepper, L. (2014). “ Localization and classification of targets by echolocating bats and dolphins,” in Biosonar, edited by Surlykke A., Nachtigall P. E., Fay R. R., and Popper A. N. ( Springer-Verlag, New York: ), pp. 169–193. [Google Scholar]
- 34. Suga, N. , and Shimozawa, T. (1974). “ Site of neural attenuation of responses to self-vocalized sounds in echolocating bats,” Science 183, 1211–1213. 10.1126/science.183.4130.1211 [DOI] [PubMed] [Google Scholar]
- 35. Supin, A. Y. , Nachtigall, P. E. , Pawloski, J. , and Au, W. W. L. (2003). “ Evoked potential recording during echolocation in a false killer whale Pseudorca crassidens,” J. Acoust. Soc. Am. 113, 2408–2411. 10.1121/1.1561497 [DOI] [PubMed] [Google Scholar]
- 36. Teas, D. C. , Eldredge, D. H. , and Davis, H. (1962). “ Cochlear responses to acoustic transients: An interpretation of whole-nerve action potentials,” J. Acoust. Soc. Am. 34, 1438–1459. 10.1121/1.1918366 [DOI] [Google Scholar]
- 37. Viemeister, N. F. , and Plack, C. J. (1993). “ Time analysis,” in Human Psychophysics, edited by Yost W. A., Popper A. N., and Fay R. R. ( Springer-Verlag, New York: ), pp. 116–154. [Google Scholar]
- 38. Zwicker, E. (1965). “ Temporal effects in simultaneous masking by white-noise bursts,” J. Acoust. Soc. Am. 37, 653–663. 10.1121/1.1909389 [DOI] [PubMed] [Google Scholar]


