

Abstract
Objective
To test the hypothesis that there is increased low-frequency activity located predominantly in the frontal lobe in patients with major depressive disorder using magnetoencephalography.
Methods
We carried out an unmatched or separate sampling case–control study of 31 medication-free patients who met the Diagnostic and Statistical Manual of Mental Disorders, fourth edition (DSM-IV), criteria for major depressive disorder and were outpatients of the Hospital Central de la Defensa, Madrid, and 22 healthy control subjects with no history of mental illness. A logistic regression analysis was employed to examine the predictive value of magnetoencephalography dipole density scores in the diagnosis of depression. We attempted to locate generators of focal magnetic slow waves by employing a single moving dipole model and by calculating dipole densities in prefrontal, frontal, parietal, temporal and occipital areas. The study lasted from February 2001 to January 2003.
Results
Only 2 dipole density scores, right occipital delta and left temporal delta, were significantly related to depression. According to the comparison of univariate and multivariate models and odds ratios, the right occipital delta dipole density is the factor with the greatest predictive power for depression, and the only one to show a significant correlation with severity of depression.
Conclusions
We did not find any frontal lobe functional alteration. Our study provides, to the best of our knowledge, the first evidence of abnormal focal magnetic low-frequency activity in the occipital lobe of untreated patients with depression. Increased occipital lobe delta dipole density seems to be a reliable risk factor for depression, which correlates with disease severity according to the Hamilton Rating Scale for Depression.
Medical subject headings: brain mapping, cerebrovascular circulation, depression, magnetoencephalography
Abstract
Objectif
Vérifier l'hypothèse selon laquelle la magnétoencéphalographie révèle une activité accrue de basse fréquence principalement dans le lobe frontal chez les patients atteints de dépression grave.
Méthodes
Nous avons procédé à une étude cas-témoin sans jumelage ou par échantillonnage distinct portant sur 31 patients atteints de dépression qui ne prenaient pas de médicaments, satisfaisaient aux critères de la quatrième édition du Diagnostic and Statistical Manual of Mental Disorders (DSM-IV) et étaient traités en service externe à l'Hôpital Central de la Defensa à Madrid et sur 22 sujets témoins en bonne santé qui n'avaient pas d'antécédents de maladie mentale. On a procédé à une analyse de régression logistique pour étudier la valeur prédictive des résultats de densité dipolaire de la magnétoencéphalographie dans le diagnostic de la dépression. Nous avons tenté de trouver les générateurs d'ondes magnétiques focales lentes en utilisant un seul modèle dipolaire mobile et en calculant les densités dipolaires dans les régions préfrontale, frontale, pariétale, temporale et occipitale. L'étude a duré de février 2001 à janvier 2003.
Résultats
On a constaté que seulement deux liens de densité dipolaire, soit delta dans la région occipitale droite et delta dans la région temporale gauche, présentaient un lien significatif avec la dépression. Selon la comparaison des modèles à variable unique et à variables multiples et les coefficients de probabilité, la densité de l'onde dipolaire delta dans la région occipitale droite est le facteur qui présente le plus important pouvoir prédicteur de dépression et le seul à montrer un lien significatif avec la gravité de la dépression.
Conclusions
Nous n'avons pas trouvé d'altération fonctionnelle du lobe frontal. Notre étude présente, au meilleur de notre connaissance, les premières preuves d'activité de basse fréquence magnétique focale anormale dans le lobe occipital chez les patients atteints de dépression non traitée. La densité dipolaire accrue de l'onde delta dans le lobe occipital semble constituer un facteur de risque de dépression fiable, en corrélation avec la gravité de la maladie selon l'échelle de dépression de Hamilton.
Introduction
Neuroimaging technology allows the investigation of neurophysiologic, neuroanatomical and neurochemical correlates of mood disorders in vivo.1 However, the results derived from these studies are still controversial. Studies from the early 1980s of young, depressed patients reported that regional cerebral blood flow was unchanged in depression,2 or even increased.3 Nowadays, a pattern of reduced frontal and prefrontal activation in depressed patients is a major finding in single-photon-emission computed tomography (SPECT) or positron emission tomography (PET) studies,4,5 although it should not be considered a specific characteristic of depression. It should be mentioned that this frontal hypofunctioning is frequently associated with cingulate,6 temporal,7,8 limbic9 or basal ganglia10 alterations. The last-named provide further evidence to support the “serotonergic hypothesis” of depression. As Drevets et al1 indicate, the serotonin-1A (5-HT1A) receptor system is implicated in mood disorders because of a blunted physiologic response to 5-HT1A receptor agonists.
Nevertheless, the most compelling evidence regarding focal neural disturbances in depression probably derives from magnetic resonance imaging research. A pioneering review of this subject11 indicated that depression is associated with a definite reduction in frontal lobe volume. For example, Kumar et al12 found significantly smaller frontal lobe volumes, together with diffuse high-density lesions, in patients with major depression. Moreover, reduced frontal volumes predicted a higher risk of depression. A recent study by this group also found frontal white-matter biochemical abnormalities in late-life depression.13
These data suggest an important role for the frontal and prefrontal cortex in major depression accompanied, to a lesser extent, by other cortical and subcortical alterations. As a consequence, focal cortical hypoactivity in depression might be also identified by other techniques that measure neural functioning.
Several electroencephalographic (EEG) studies have revealed an increased alpha or theta power in patients with depression especially in the left anterior region of the brain, the so-called frontal alpha asymmetry.14,15 This evidence has been interpreted as the expression of a frontal hypoactivation, although other findings contradict this point of view.16 Magnetoencephalography (MEG) and magnetic source imaging detect focal neural activity at intervals where ongoing background activity is low and can localize the source of the activity. Following previous studies of the clinical application of frequency-band and dipole density (DD) analysis,17,18 Fehr et al19 developed a methodology that allows the localization of the source of focal slow waves. Determining the focal dipole density of delta and theta activity, a higher frequency of slow-wave generators was observed, particularly in temporal regions, in patients with schizophrenia as compared with control groups. Fernández et al20,21 confirmed the clinical relevance of this methodology by demonstrating an increased focal temporoparietal delta and theta DD in patients with Alzheimer's disease as compared with controls, a finding that correlates with a significant reduction of hippocampal volumes.
Accordingly, the present study examined focal slow-wave activity in patients with major depressive disorder. Because slow waves are associated with white-matter abnormalities in EEG22 and cortical atrophy in MEG recordings,21 we hypothesized that cortical slow-wave generators should be enhanced particularly in the frontal lobes in patients with a diagnosis of major depressive disorder.
Methods
Thirty-one patients (17 female) from the Hospital Central de la Defensa psychiatry unit, Madrid, Spain, who fulfilled the Diagnostic and Statistical Manual of Mental Disorders, fourth edition (DSM-IV),23 criteria for major depressive disorder participated in the study. None of the patients presented with substance abuse or other neurologic, medical or psychiatric diseases (except for major depressive disorder). The mean age of the depressed patients was 46 (standard deviation [SD] 13) years. The patients were at least moderately depressed as reflected by the 25-item Hamilton Rating Scale for Depression24 scores (mean 23.3, SD 7.47). Subjects completed a minimum 3-week medication washout before the MEG recordings. Ten patients required a moderate dose of ketazolam (15 mg daily), whereas 2 patients required a higher dose (30 mg daily) for clinical management 1 week before the recordings.
Twenty-two healthy control subjects (11 female) also participated in the study. None of them had a history of major depressive disorder, substance abuse, or a neurologic or medical disorder. The control subjects were recruited by advertisement. The mean age of controls was 47 (SD 12) years.
Before the study, all participants signed an informed consent form. In case of legal incapacity, the consent was signed by a legal representative. The study was approved by the Investigation and Ethics Committee of the Hospital Central de la Defensa. The study lasted from February 2001 to January 2003.
The MEG was carried out using a 148-channel whole-head magnetometer (Magnes 2500 WH, 4-D Neuroimaging, San Diego, Calif.) for 10 minutes during a resting period. While lying comfortably on a bed, subjects were asked to stay awake (drowsiness was controlled during the recordings) and to avoid head and eye movement by fixating on a black point on the ceiling. The MEG was recorded with a 678.17-Hz sampling rate, using a bandpass filter of 0.1–200 Hz. The electro-oculogram was recorded from 4 electrodes attached to the left and right outer canthus and above and below the left eye. The electrocardiogram was monitored with electrodes attached to the right collar bone and the lowest left rib.
Each 10-minute data set was decimated, which consisted of filtering the data in order to respect Nyquist criteria,25 followed by downsampling by a factor of 16 (resulting sample frequency 42.39 Hz) and bandpass filtering before the analysis in the delta (1.5–4.0 Hz) and theta (4.0–8.0 Hz) bands. Dipole densities were estimated based on an equivalent current dipole in a homogeneous sphere calculated for each artifact-free time segment of the individual recordings.
Artifact-free time segments of varying lengths were determined by visual inspection. Artifacts originated from low-frequency contamination due to eye movements, controlled by the electro-oculogram. Single equivalent dipoles were fitted for each time point in the artifact-free epochs. Only dipole fit solutions at time points with a root mean square {RMS = [√1/nΣ(xι)2]} over 100 fT and a goodness of fit (GOF) over 0.90 were accepted for further analysis. For statistical analysis, the total brain volume was divided into 10 regions, representing frontal, parietal, prefrontal, temporal and occipital areas in both hemispheres, and the number of successful dipole fits was determined for each of these regions (Fig. 1). The total number of dipoles per second that fit the criteria in the delta and theta bands was determined for each subject and region. In order to avoid the possible influence of individual variability in the artifact-free epoch lengths over the dipole density scores, the raw number of dipoles per region was normalized by calculating the formula:
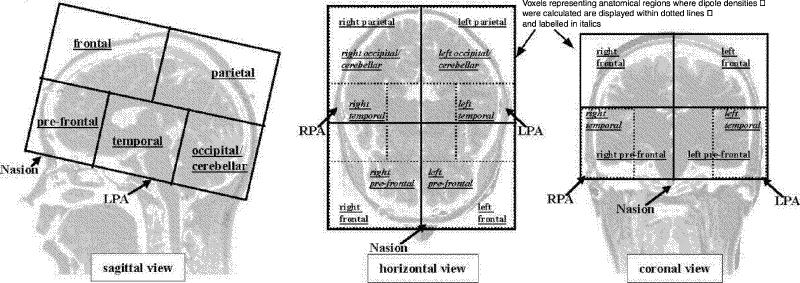
Fig. 1: Schematic overview of the regions for which dipole densities were calculated. LPA = left preauricular; RPA = right preauricular.
Number of dipoles per second = raw number of dipoles/sampling rate х absolute number of recorded points (where the absolute number of recorded points is the final number of recorded points in the measurement after eliminating the artifacts).
This “number of dipoles per second per region” is the final score used for the statistical analysis, represented by 20 DD variables: left frontal delta (LF_D), right frontal delta (RF_D), left parietal delta (LP_D), right parietal delta (RP_D), left prefrontal delta (LPF_D), right prefrontal delta (RPF_D), left temporal delta (LT_D), right temporal delta (RT_D), left occipital delta (LO_D), right occipital delta (RO_D), left frontal theta (LF_T), right frontal theta (RF_T), left parietal theta (LP_T), right parietal theta (RP_T), left prefrontal theta (LPF_T), right prefrontal theta (RPF_T), left temporal theta (LT_T), right temporal theta (RT_T), left occipital theta (LO_T) and right occipital theta (RO_T). The methods used have been described elsewhere.19,20
Differences in the dipole density solutions between groups (patients and controls) were evaluated by means of a 2 х 10 (group х region) repeated-measures analysis of variance (ANOVA). In cases of statistical significance, the pairwise mean comparison was carried out by Tukey B post hoc analysis.
Subsequently, a multivariate logistic regression model was developed to predict the probability of depression using the methods suggested by Hosmer and Lemeshow.26 The precision of the fitting prediction equation was then evaluated using receiver operating characteristic (ROC) curve analysis. The area under each ROC curve was also calculated.
A Spearman correlation coefficient was used to examine the relation between significant DD scores and clinical indices of depression severity, according to the Hamilton Rating Scale for Depression.
Statistical analyses were performed using SPSS and EGRET statistical packages. Statistical significance was set at p < 0.05.
Results
For the delta band, the density of focal slow waves demonstrated a significant main effect of region as a factor (F9,459 = 9.85, p < 0.05) and its interaction group х region (F9,459 = 2.68, p < 0.05). The main effect of region as a factor, independent of group, shows a higher level of slow activity over prefrontal and parietal regions. The interaction effect demonstrates that the increase of delta activity in the group with depression was significantly higher over only 1 specific region: RO_D (p < 0.01).
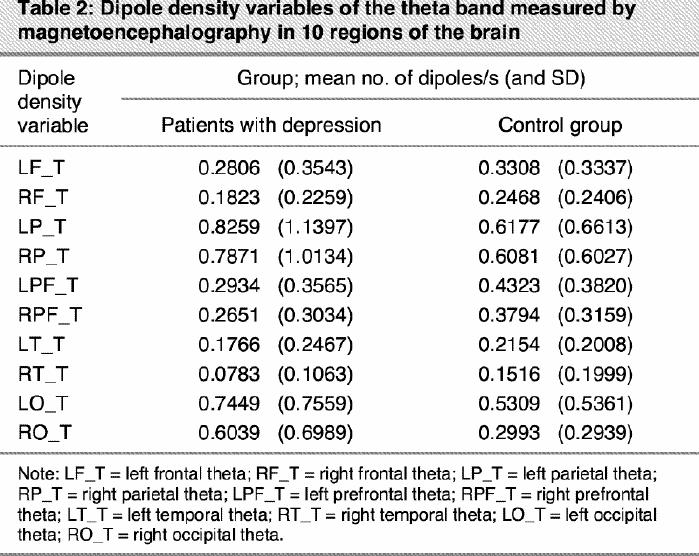
For the theta band only the region main effect (F9,459 = 13.10; p < 0.001) was significant, indicating a strong increase in theta activity in parietal areas, independent of the group (Table 1, Table 2).
Table 1
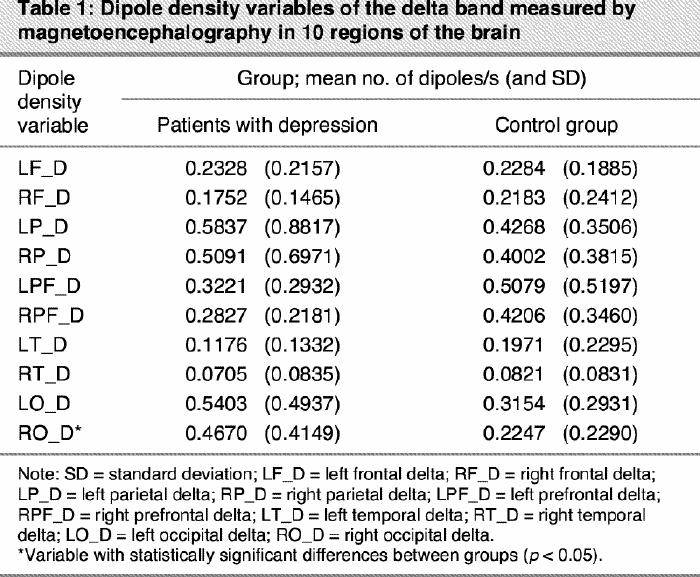
Table 2
A number of logistic regression equations were estimated to determine predictors of depression. Data (DD and Hamilton scores) came from an unmatched or separate sampling case–control study design. The implication of this is that inferences about the intercept parameter are not possible without knowledge of the sampling fractions, within cases and controls, τ1 and τ0, whereas the remaining parameters may be estimated using the methods developed for cohort data. We used, for the intercept parameter α the estimator27
with
being the intercept parameter estimator from the cohort model.
In the model-building process, we sought the most parsimonious model that still explained the data. The variable selection process began with a careful univariate analysis of each variable using the likelihood ratio tests (LRT) with a p value of 0.25 as screening criterion26,28 to select candidate variables for the multivariate model. LRT were also used to compare the statistical significance of every multivariate model containing different numbers of variables. Following this schema, 6 variables (RPF_D, LT_D, RO_D, RPF_T, RT_T and RO_T) appeared to be associated with the outcome, depression. These results are presented in Table 3. Then, a multivariate logistic model including the 6 selected variables was fitted. The relevance of each variable was verified through an examination of its Wald test statistic; the p values are presented in column 3 of Table 4.
Table 3
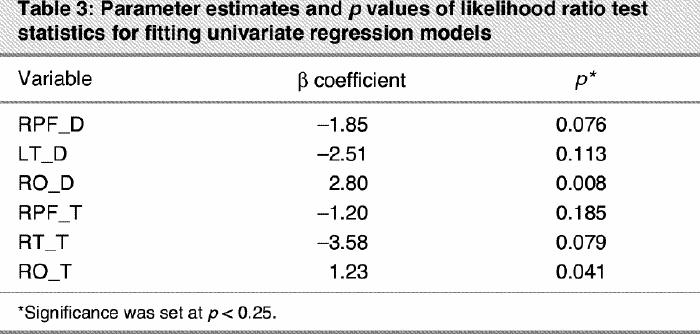
Table 4
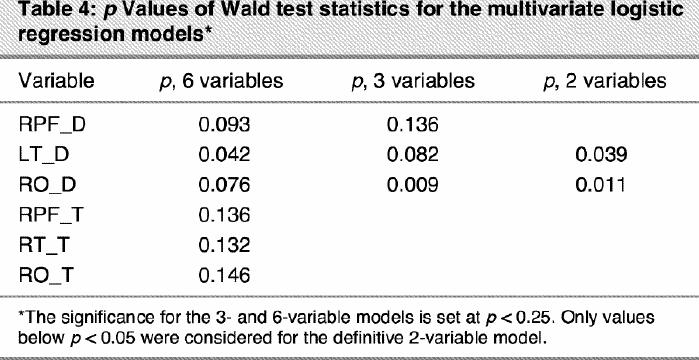
Only 3 variables, RPF_D, RO_D and LT_D, demonstrated a predictive power in the multivariate model. This suggested a new representative model that contained only variables RPF_D, RO_D and LT_D. The models containing 6 and 3 variables were compared via the LRT (χ32 = 6.10, p = 0.11), showing that the 3 variables discarded (RPF_T, RT_T, RO_T) added nonrelevant information to the model. The p values (Wald test) for fitting the new 3-variables model are presented in column 2 of Table 4.
As can be seen in Table 4, RPF_D was no longer significant in the 3-variables model, with a p value (Wald test) of 0.14. Thus, we fitted a new model that contained only variables RO_D and LT_D. The models containing 3 and 2 variables were compared via the LRT (χ12 = 2.58, p = 0.11), demonstrating that RPF_D added nonsignificant information to the model. The p values (Wald test) for fitting the bivariate model are presented in column 3 of Table 4.
The model-building process continued by ascertaining the correct scale in the logit model of RO_D and LT_D.26 The analysis showed evidence of linearity in both cases. Finally we checked for the interaction RO_D х LT_D. The interaction did not afford a significant improvement over the main effects model (χ12 = 0.01, p = 0.92). The final fitted model is presented in Table 5. All the fitted models showed that RO_D is the factor with the greatest predictive power for depression (see p values in Table 3, Table 4 and Table 5). LT_D is not significant in the univariate model and only reaches a significant value when accompanied by RO_D. Therefore, although LT_D improves the predictive reliability of the model, RO_D is the critical factor associated with a higher risk of depression, as demonstrated by its odds ratio (OR 40.8, Table 5). Figure 2 represents how the probability of depression increases when RO_D scores increase.
Table 5
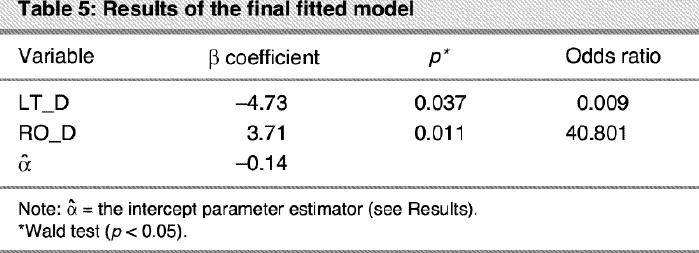
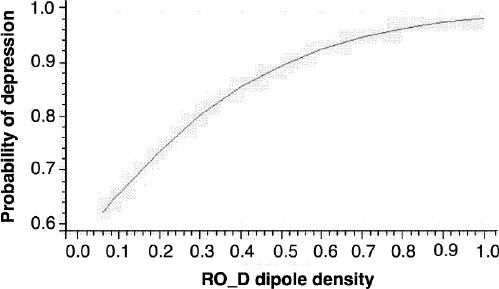
Fig. 2: The probability of depression increases as right occipital delta (RO_D) dipole density increases, when the left temporal delta value remains constant.
A receiver operating characteristic (ROC) curve was used to evaluate the precision of the final model in Table 5. The area under the ROC curve is 0.79 with a 95% confidence interval (0.65–0.92). At the 0.5 cut point, sensitivity was 0.84, specificity was 0.73 and total classification accuracy was 0.81. Figure 3 shows this curve.
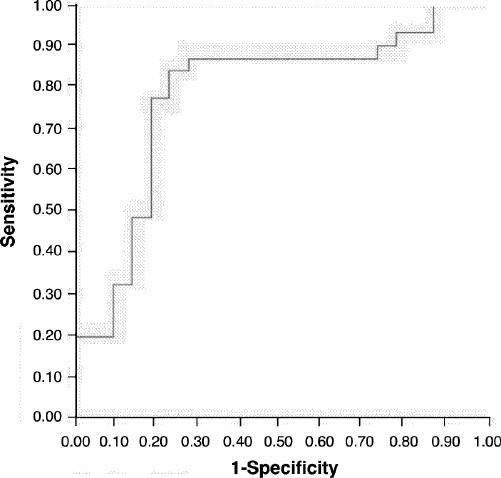
Fig. 3: Receiver operating characteristic (ROC) curve for the results of the logistic regression model represented inTable 3.
To evaluate specific probabilities of depression we should use the estimator
. The depression rate for the Spanish population was roughly ascertained to be 17%. For this rate,27
= 1.79.
Finally, once the statistical relevance of RO_D and LT_D was established, their scores were correlated with Hamilton's raw scores and severity of depression scale. Significant correlations were obtained only for RO_D in both Hamilton's scores: Hamilton's raw scores (r = 0.48, p < 0.001) and Hamilton's severity of depression scale (r = 0.34, p < 0.001). Figure 4 displays a representative example with the localization of delta activity on the right parieto-occipital region of a patient with major depressive disorder.
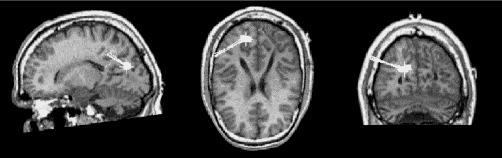
Fig. 4: Localization of the sources of predominant right occipital delta activity superimposed on corresponding sagittal, coronal and axial magnetic resonance images. Full squares represent source localizations and tails represent orientation of the magnetic flux.
Discussion
Logistic regression analysis demonstrated that the most critical factor in distinguishing patients with depression and controls was delta activity in the right occipital lobe, a result that did not confirm our preliminary hypothesis. The sensitivity and specificity of the regression model permit a reliable classification of depressed patients and controls. Moreover, an increased RO_D DD elevated the relative risk of depression and was significantly correlated with Hamilton scores. Therefore, the calculation of occipital DD might be considered a promising diagnostic tool for depression, especially in clinical conditions such as pseudo-depressive dementia, in which a clear differential diagnosis is critical.
These results, although unexpected, are in agreement with previous “classical” literature reports, in which similar findings were described. Abrams and Taylor29 investigated EEG patterns in patients with schizophrenia and in a large series of patients with affective disorders, including mania and endogenous depression. The cortical distribution of neurophysiologic abnormalities, defined as slowing, fast activity or sharp waves, was completely different for the 2 groups: whereas patients with schizophrenia showed more temporal lobe EEG abnormalities, patients with affective disorder had a pattern of parieto-occipital regional alterations. The cortical, hemispheric distribution of these patterns was also different: patients with schizophrenia presented a left temporal predominance, whereas those with depression tended to show right parieto-occipital alterations. More interestingly, the major source of EEG abnormalities (70%) consisted of slow-wave activity. This study was the first to show parieto-occipital alterations associated with affective disorders, but no obvious neurophysiologic interpretations were made, even when a previous investigation demonstrating occipital slowing in children with behavioural disorders was cited.30 Subsequent research confirmed these observations. Ulrich et al31 found that good responders to antidepressants showed an increased power for the low- frequency range in both left and right occipital regions. More recent investigations32,33,34,35 have indicated that reduced occipital alpha power associated with parieto-occipital or right hemisphere slow-wave activity is a common finding in depression.
The question addressed by all these studies is the following: what might be the origin for a regional background activity slowing in depression? As various researchers22,36 have pointed out, deafferentation and cholinergic deficits are major sources of slow-wave activity in the human brain. Observations of white- and grey-matter lesions in depression usually involve deep white matter, subcortical grey matter and periventricular regions,11 along with some biochemical changes affecting frontal white and grey matter.13 Tupler et al37 reported one of the very few cases of left posterior cortex white-matter lesions in depressed patients.
Otherwise, there is no clear evidence of a cholinergic deficit in depression. Alzheimer's disease has been held to be the human model of how low levels of acetylcholine in cerebrospinal fluid correlate with cortically generated slow-wave activity.36 In this sense, an atrophic nucleus basalis (the major source of corticipetal cholinergic afferents) is associated with an increased EEG delta power. Nevertheless, some relevant investigations have revealed that a decreased acetylcholine level is not sufficient to generate cortical slow activity. First, Vanderwolf and Baker38 introduced the notion of a serotonergic mediation for hippocampal slow activity. Subsequent studies, both in human (Alzheimer's disease) and animal models,39,40 have shown that lowering central serotonergic levels reduces beta activity and produces EEG slowing. Moreover, a neurochemical mechanism to explain this process has been proposed. According to Dringenberg et al,41 lower serotonin (or other monoamines) levels “can contribute to the reduction of the inhibitory after-hyperpolarization (IAHP) that follows action potentials in cortical pyramidal cells. The extracellular currents generated by IAHP seem to summate in the extracellular fluid to give rise to large amplitude, low frequency EEG waves.”
Although it is broadly accepted that a diffuse reduction in the serotonin level in the brain is the major neurochemical finding in depression, a more confined reduction of this substance is controversial. Thus, is it possible to justify the notion of a serotonergic occipital dysfunction in these patients? At least 2 studies may indicate an affirmative answer. These investigations42,43 focused on the effects of the selective serotonin reuptake inhibitors (SSRIs) fluvoxamine and sertraline on glucose metabolism and 5-HT2 receptors, respectively, using PET scans in patients with depression. The results indicated, in both cases, that 2 regions substantially enhanced their functional status with SSRI treatment: the frontal and occipital lobes. When frontal versus occipital receptors and metabolic ratios were compared, the largest quantitative change occurred in the occipital lobe. These results were only scarcely discussed.
To our knowledge, this is the first study in which spontaneous MEG activity was measured in patients with untreated depression and, as a consequence, the interpretation of our data is still tentative. The results seem to attribute a potential role for MEG in the detection of focal occipital abnormalities associated with depression. Particularly, the identification of occipital lobe dysfunctions might represent an interesting challenge for neuroimaging techniques, as some innovative studies have shown.44,45 A reduced occipital γ-aminobutyric acid (GABA)-ergic level has been recently demonstrated44 by means of proton magnetic resonance spectroscopy in a small sample of patients with depression. This abnormal reduction was in part reversed after SSRI treatment.45 The authors interpreted this change as a direct modulation effect of serotonin neurons on cortical GABAergic interneurons. The linkage of a proven regional serotonergic–GABAergic deficit and its neurophysiologic counterpart, which was only partially highlighted by the present study, deserves further investigation.
Acknowledgments
We thank Organon for their support for the realization of the study, and we thank Dr. F. Quesney for his advice.
Footnotes
Competing interests: None declared for Drs. Rodriguez-Palancas, López-Ibor, Zuluaga, Turrero and López-Ibor. Drs. Fernández, Maestú, Amo and Ortiz have received research funding from Organon.
Correspondence to: Dr. Tomás Ortiz, Centro MEG Dr. Pérez-Modrego, Facultad de Medicina, Pabellón 8, Avenida Complutense S/N, Universidad Complutense de Madrid, 28040 Madrid, Spain; cmeg@rect.ucm.es
Submitted Aug. 21, 2003; Revised Nov. 26, 2003; Feb. 11, 2004; Accepted Feb. 24, 2004
References
- 1.Drevets WC, Frank E, Price JC, Kupfer DJ, Holt D, Greer PJ, et al. PET imaging of serotonin 1A receptor binding in depression. Biol Psychiatry 1999;46:1375-87. [DOI] [PubMed]
- 2.Gur RE, Skolnick BE, Gur RC, Carroff S, Rieger W, Obrist WD, et al. Brain function in psychiatric disorders II. Regional cerebral blood flow in medicated unipolar depressives. Arch Gen Psychiatry 1984;41(7):695-9. [DOI] [PubMed]
- 3.Rosenberg SJ, Peterson RA, Hayes JR, Hatcher J, Headen S. Depression in medical in-patients. Br J Med Psychol 1988;61:245-54. [DOI] [PubMed]
- 4.Dolan RJ, Bench CJ, Brown RG, Scott LC, Frackowiak RS. Neuropsychological dysfunction in depression: the relationship to regional blood flow. Psychol Med 1994;24:849-57. [DOI] [PubMed]
- 5.Ebert D, Ebmeier KP. The role of the cingulate gyrus in depression: from functional anatomy to neurochemistry. Biol Psychiatry 1996; 39: 1044-50. [DOI] [PubMed]
- 6.Bench CJ, Frackowiack RS, Dolan RJ. Changes in regional cerebral blood flow on recovery from depression. Psychol Med 1995;25:247-91. [DOI] [PubMed]
- 7.Austin MP, Dougall N, Ross M, Murray C, O'Carroll RE, Moffoot A, et al. Single photon emission tomography with 99mTc- exametazine in major depression and the pattern of brain activity underlying the psychotic/neurotic continuun. J Affect Disord 1992;26:31-43. [DOI] [PubMed]
- 8.Lesser IM, Mena I, Boone KB, Miller BL, Mehringer CM, Wohl M. Reduction of cerebral blood flow in older depressed patients. Arch Gen Psychiatry 1994;51:677-86. [DOI] [PubMed]
- 9.Ito H, Kawashima R, Awata S, Ono S, Sato K, Goto R, et al. Hypoperfusion in the limbic system and prefrontal cortex in depression: SPECT with anatomic standardization technique. J Nucl Med 1996; 37: 410-4. [PubMed]
- 10.Viedebach P. PET measurments of brain glucose metabolism and blood flow in major depressive disorder: a critical review. Acta Psychiatr Scand 2000;101:11-20. [DOI] [PubMed]
- 11.Steffens DC, Krishnan KRR. Structural neuroimaging and mood disorders: recent findings, implications for classification, and future directions. Biol Psychiatry 1988;43:705-12. [DOI] [PubMed]
- 12.Kumar A, Bilker W, Jin Z, Udupa J. Atrophy and high intensity lesions: complementary neurobiological mechanisms in late-life major depression. Neuropsychopharmacology 2000;22:264-74. [DOI] [PubMed]
- 13.Kumar A, Thomas A, Lavretsky H, Yue K, Huda A, Curran J, et al. Frontal white matter biochemical abnormalities in late-life major depression detected with proton magnetic resonance spectroscopy. Am J Psychiatry 2002;159:630-6. [DOI] [PubMed]
- 14.Monakhov K, Perris C. Neurophysiological correlates of depressive symptomatology. Neuropsychobiology 1980;6:268-79. [DOI] [PubMed]
- 15.Alper K. Quantitative EEG and evoked potentials in adult psychiatry. In: Panksepp J, editor. Advances in biological psychiatry. Vol. 1. Greenwich (Conn.): JAI Press; 1995. p. 65-112.
- 16.Pollock VE, Schneider LS. Quantitative, waking EEG research on depression. Biol Psychiatry 1990;25:20-3. [DOI] [PubMed]
- 17.Vieth J, Kober H, Grummich P. Slow wave and beta wave activity associated with white matter structural brain lesions, localized by the dipole density plot. In: Baumgartner C, Deecke L, Stroink G, Willianson SJ, editors. Biomagnetism: fundamental research and clinical applications. Amsterdam: Elsevier/IOS-Press; 1995. p. 50-4.
- 18.De Munck JC, De Jongh A, Van Dijk BW. The localization of spontaneous brain activity: an efficient way to analyze large data sets. IEEE Trans Biomed Eng 2001;11:1221-8. [DOI] [PubMed]
- 19.Fehr T, Kissler J, Moratti S, Wienbruch C, Rockstroh B, Elbert T. Source distribution of neuromagnetic slow waves and MEG-delta activity in schizophrenic patients. Biol Psychiatry 2001;50:108-16. [DOI] [PubMed]
- 20.Fernández A, Maestú F, Amo C, Gil P, Fehr T, Wienbruch C, et al. Focal temporo-parietal slow activity in Alzheimer's disease revealed by magnetoencephalography. Biol Psychiatry 2002;52:764-70. [DOI] [PubMed]
- 21.Fernández A, Arrazola J, Maestú F, Amo C, Gil-Gregorio P, Wienbruch C, et al. Correlations of hippocampal atrophy and focal low frequency magnetic activity in Alzheimer's disease: a volumetric MRI-MEG study. Am J Neuroradiol 2003;24:481-7. [PMC free article] [PubMed]
- 22.Steriade M, Gloor P, Llinás RR, Lopes da Silva FH, Mesulam MM. Basic mechanisms of cerebral rhythmic activities. Electroencephalogr Clin Neurophysiol 1990;76:481-508. [DOI] [PubMed]
- 23.American Psychiatric Association. Diagnostic and Statistical Manual of Mental Disorders. 4th ed. Washington: The Association; 1994.
- 24.Hamilton M. A rating scale for depression. J Neurol Neurosurg Psychiatry 1960;23:56-62. [DOI] [PMC free article] [PubMed]
- 25.Oppenhein AV, Schafer RW. Digital signal processing. Englewood Cliffs (NJ): Prentice-Hall; 1974.
- 26.Hosmer D, Lemeshow S. Applied logistic regression. New York: John Wiley & Sons; 1989.
- 27.Bock J, Afifi A. Estimation of probabilities using the logistic model in retrospective studies. Comput Biomed Res 1988;21:449-70. [DOI] [PubMed]
- 28.Bendel R, Afifi A. Comparison of stopping rules in forward regression. J Am Stat Assoc 1977;72:46-53.
- 29.Abrams R, Taylor MA. Differential EEG patterns in affective disorder and schizophrenia. Arch Gen Psychiatry 1979;36:1355-8. [DOI] [PubMed]
- 30.Hughes JR. A review of the positive spike phenomenon. In: Wilson WP, editor. Applications of electroencephalography in psychiatry. Durham (NC): Duke University Press; 1965. p. 54-101.
- 31.Ulrich G, Renfordt E, Zeller G, Frick K. Interrelation between changes in the EEG and psychopathology under pharmacotherapy for endogenous depression. A contribution to the predictor question. Pharmacopsychiatry 1984;17:178-83. [DOI] [PubMed]
- 32.Davidson RJ, Abercrombie H, Nitschke JB, Putman K. Regional brain function, emotion and disorders of emotion. Curr Opin Neurobiol 1999;9:228-34. [DOI] [PubMed]
- 33.Knott V, Mahoney C, Kennedy S, Evans K. EEG power, frequency, asymmetry and coherence in male depression. Psychiatry Res 2001; 106: 123-40. [DOI] [PubMed]
- 34.Kwon JS, Youn T, Jung HY. Right hemisphere abnormalities in major depression: quantitative electroencephalographic findings before and after treatment. J Affect Disord 1996;40:169-73. [DOI] [PubMed]
- 35.Pozzi D, Golimstock A, Petracchi M, GarcÍa H, Starkstein S. Quantified electroencephalographic changes in depressed patients with and without dementia. Biol Psychiatry 1995;38:677-83. [DOI] [PubMed]
- 36.Riekkinen P, Buzsaki G, Riekkinen P Jr, Soininen H, Partanen J. The cholinergic system and EEG slow waves. Electroencephr Clin Neurophysiol 1995;78:89-96. [DOI] [PubMed]
- 37.Tupler LA, Krishnan KR, McDonald WM, Dombeck CB, D'Souza S, Steffens DC. Anatomic localization and laterality of MRI signal hyperintensities in late-life depression. J Psychosom Res 2002;53: 665-76. [DOI] [PubMed]
- 38.Vanderwolf CH, Baker GB. Evidence that serotonin mediates non-cholinergic neocortical low voltage fast activity, non-cholinergic hippocampal rhythmical slow activity and contributes to intelligent behavior. Brain Res 1986;374:342-56. [DOI] [PubMed]
- 39.Cross AJ. Serotonin in Alzheimer-type dementia and other dementing illnesess. Ann N Y Acad Sci 1990;600:405-15. [DOI] [PubMed]
- 40.Dringenberg HC, Zalan RM. Serotonin-dependent maintenance of spatial performance and electroencephalography activation after cholinergic blockade: effects of serotonergic receptor antagonist. Brain Res 1999;837:242-53. [DOI] [PubMed]
- 41.Dringenberg HC, Diavolitsis P, Noseworthy PA. Effect of tacrine on EEG slowing in the rat: enhancement by concurrent monoamine therapy. Neurobiol Aging 2000;21:135-43. [DOI] [PubMed]
- 42.Buchsbaum MS, Wu J, Siegel BV, Hackett E, Trenary M, Abel L. Effects of sertraline on regional metabolic rate in patients with affective disorder. Biol Psychiatry 1997;41:15-22. [DOI] [PubMed]
- 43.Moresco RM, Colombo C, Fazio F, Bonfanti A, Lucignani G, Messa C, et al. Effects of fluvoxamine treatment on the in vivo binding of [F-18]FESP in drug naive depressed patients: a PET study. Neuroimage 2000;12:452-65. [DOI] [PubMed]
- 44.Sanacora G, Mason GF, Rothman DL, Behar KL, Hyder F, Petroff OA. Reduced cortical γ-aminobutyric acid levels in depressed patients determined by proton magnetic resonance spectroscopy. Arch Gen Psychiatry 1999;56:1043-7. [DOI] [PubMed]
- 45.Sanacora G, Mason GF, Rothman DL, Krystal JH. Increased occipital cortex GABA concentrations in depressed patients after therapy with selective serotonin reuptake inhibitors. Am J Psychiatry 2002; 159: 663-5. [DOI] [PubMed]