

Abstract
Circulating microRNAs (c-miRNAs) in human plasma have been described as a potential marker of exercise. The present study investigated the effects of three acute resistance training (RT) protocols on the time-course changes of the c-miRNAs profiles in young males. The subjects (n = 45) were randomly divided into three groups: muscular strength endurance (SE), muscular hypertrophy (MH) and maximum strength (MS). Venous blood samples were obtained before exercise and immediately, 1 h and 24 h after each RT protocol to assess the following biological parameters: c-miRNAs, anabolic and catabolic hormones, inflammatory cytokines and muscle damage markers. The results revealed that the levels of two c-miRNAs (miR-208b and miR-532), six c-miRNAs (miR-133a, miR-133b, miR-206, miR-181a, miR-21 and miR-221) and two c-miRNAs (miR-133a and miR-133b) changed significantly in response to the SE, MH and MS protocols (p < 0.05), respectively. The nature and dynamic processes of the c-miRNAs response were likely influenced by the RT modality and intensity. Moreover, miR-532 was negatively correlated with insulin-like growth factor-1 and positively correlated with interleukin-10, whereas miR-133a was negatively correlated with cortisol and positively correlated with testosterone/cortisol. These findings suggest that these c-miRNAs may serve as markers for monitoring the RT responses.
Introduction
Resistance training (RT) is an effective method of exercise for improving muscular fitness1–3. Manipulation of acute program variables to efficiently achieve a specific training outcome (such as muscular hypertrophy, strength and local muscular endurance), has been proposed and recommended by many studies1–3. The preservation of muscle mass is necessary to maintain mobility and quality of life for apparently healthy adults of all ages, athletes and deconditioned older or frail individuals2.
The acute response to RT is an inherently complex and multifaceted phenomenon, which is difficult to gauge owing to the multitudinous training variables that contribute to the training load. Despite the complexity associated with quantifying RT, monitoring such responses or chronic adaptations is essential so that the exercises that best address individual needs and training objectives can be performed. Several RT protocols appear to potentiate traditional biomarker responses and have been developed to enhance various aspects of the neuromuscular system1–3, such as anabolic and catabolic hormones (e.g., testosterone, cortisol and insulin-like growth factor-1)4, 5, circulating inflammatory cytokines (e.g., interleukin-6, interleukin-10 and C-reactive protein)6, 7 and muscle damage markers (e.g., creatine kinase)6. These parameters may contribute to monitoring the training responses or neuromuscular adaptations4–7, including identification of the recovery period, adaptation patterns, direction and probable changes of these markers following different resistance exercise sessions8, 9.
Recently, microRNAs (miRNAs), which are expressed in a development-, cell type- and tissue-specific mode, have been established as crucial regulators of multiple biological phenomena10. Exercise has been shown to be an underlying activator of gene expression. Additionally, miRNAs play a central role in the post-transcriptional regulation of gene expression for a broad range of biological responses to various modes of exercise11. Accordingly, circulating miRNAs (c-miRNA) levels appear to differ between endurance and strength athletes12. Time-dependent alterations in c-miRNAs have been observed over several days during recovery from a muscular hypertrophy training protocol13. Thus, c-miRNAs have been proposed as promising biomarkers of exercise capacity.
It is known that several RT protocols, which differ in the configuration of the acute program variables (e.g., muscle action, loading and volume, selection of exercise pattern and order, rest periods, and repetition velocity and frequency), cause different physiological responses1, 3. At present, there is no consensus regarding the optimal way to control such variables. Due to the stability of c-miRNAs in plasma or serum14, c-miRNAs may be used as new biomarkers for a comprehensive evaluation of the specific adaptations induced by different exercises. Accordingly, knowledge of the time-course changes of different c-miRNAs in response to strength exercise may provide more information for monitoring the physiological stress induced by RT.
Therefore, the purpose of the present study was to investigate the time-course acute responses of c-miRNAs to different RT protocols: strength endurance (SE), muscular hypertrophy (MH) and maximum strength (MS). We hypothesized that acute changes of c-miRNAs would differ in response to the three RT protocols. Furthermore, the aim of our study was to examine whether the alterations of c-miRNAs were correlated with conventional anabolic and catabolic hormones, inflammatory cytokines and muscle damage biomarkers to gauge their physiological roles.
Results
Subject characteristics
The characteristics and one repetition maximum (1RM) of the subjects are shown in Table 1. Statistical analysis revealed that there were no baseline differences in the subject characteristics between groups.
Table 1.
Clinical characteristics of participants and absolute load (kilograms) used during the RT session.
| Age (year) | BMI (kg·m−2) | Heart rate (beats·min−1) | Bench press (kg) | Squat (kg) | Pull down (kg) | Overhead press (kg) | Standing dumbbell curl (kg) | |
|---|---|---|---|---|---|---|---|---|
| SE | 19.36 ± 0.14 | 21.30 ± 0.25 | 74.64 ± 0.89 | 50.71 ± 1.23 | 82.86 ± 2.51 | 82.86 ± 1.98 | 36.96 ± 1.07 | 14.20 ± 0.39 |
| MH | 19.72 ± 0.20 | 22.12 ± 0.31 | 72.66 ± 1.41 | 53.10 ± 2.01 | 79.83 ± 1.50 | 84.66 ± 1.95 | 36.55 ± 1.22 | 15.00 ± 0.48 |
| MS | 18.87 ± 0.12 | 21.90 ± 0.30 | 72.10 ± 1.76 | 50.83 ± 1.57 | 85.83 ± 2.34 | 84.67 ± 2.17 | 31.75 ± 0.68 | 14.82 ± 0.41 |
Values represent the mean ± SEM obtained from 15 subjects separately in each of the three groups.
Circulating blood parameters in response to the three resistance training protocols
For each subject, blood samples were collected before exercise (Pre), immediately after exercise (0 h), after 1 h of recovery (1 h) and after 24 h of recovery (24 h) for the three resistance protocols. Exercise significantly increased the blood concentrations of lactate (LA) 0 h postexercise when compared to Pre, with a different range for the three RT protocols (SE: 1.2 ± 0.1 mmol·L−1 vs. 9.0 ± 0.5 mmol·L−1, p < 0.05; MH: 1.1 ± 0.1 mmol·L−1 vs. 10.6 ± 0.6 mmol·L−1, p < 0.05; MS: 1.1 ± 0.1 mmol·L−1 vs. 4.8 ± 0.4 mmol·L−1, p < 0.05), and all nearly decreased to the baseline level at 1 h postexercise.
The data for hormones, muscle damage biomarkers and inflammatory cytokines in response to the three RT protocols are summarized in Fig. 1. Both SE and MH protocols could induce significant changes of plasma testosterone and cortisol levels, with peak values observed 0 h postexercise (p < 0.05) (Fig. 1A,B). Plasma levels of cortisol were increased in response to MS, peaking after 24 h recovery (p < 0.05) (Fig. 1B). All of the three protocols could change the ratios of testosterone and cortisol (T/C), peaking for SE and MH whereas declining to minimum for MS after 24 h recovery (p < 0.05) (Fig. 1C). The plasma levels of insulin-like growth factor-1 (IGF-1) were altered in response to SE and MH, with peak values observed 0 h postexercise (p < 0.05) for SE whereas minimum values observed after 24 h recovery (p < 0.05) for MS (Fig. 1D).
Figure 1.
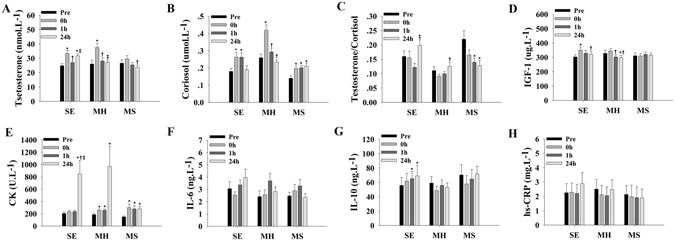
Alterations of blood parameters in response to three types of strength training protocol (n = 15 for each group). The plasma levels of hormones (A,B,C and D), muscle damage markers (E) and inflammatory cytokines (F,G and H) obtained at baseline (Pre), immediately after exercise (0 h), after 1 h of recovery (1 h) and after 24 h of recovery (24 h) for three resistance protocols (SE, MH, and MS). *indicates differences compared to Pre, p < 0.05; †indicates differences compared to 0 h, p < 0.05; ‡indicates differences compared to 1 h, p < 0.05. Values represent the mean ± SEM.
Plasma levels of creatine kinase (CK) were affected by the three protocols, with peak values observed after 24 h recovery (p < 0.05) for SE and MH, and 0 h postexercise (p < 0.05) for MS (Fig. 1E). The plasma levels of interleukin-6 (IL-6), interleukin-10 (IL-10) and hypersensitive C-reactive protein (hs-CRP) did not respond to MH and MS (p values between 0.07 and 0.98) (Fig. 1F–H). The plasma IL-10 levels were increased for SE, peaking after 24 h recovery (p < 0.05) (Fig. 1G).
Circulating miRNAs screening by TaqMan Low Density Array
The global plasma miRNAs expression patterns in response to the SE, MH and MS protocols were analyzed using TaqMan Low Density Array (TLDA). The Pearson correlation coefficient (R) for the three paired groups was 0.90 for SE, 0.95 for MH, and 0.82 for MS (Fig. 2A–C). A miRNA was considered to be differently changed if its Ct value was below 35 and if there was a larger than 2-fold change in concentration. Class-comparison analysis of all 754 human miRNAs showed that plasma miRNAs responded differently to the three RT protocols (SE: 1 miRNA increased, 93 miRNAs decreased; MH: 75 miRNAs increased, 7 miRNAs decreased; MS: 16 miRNAs increased, 60 miRNAs decreased). The markedly altered miRNAs in plasma (fold change > 10) after the SE, MH, and MS protocols are listed in Table 2. As shown in Fig. 2, 8 miRNAs (miR-205, miR-206, miR-208b, miR-216a, miR-219, miR-532, miR-542-5p and miR-628-5p) were considered for subsequent validation individually because they showed the greatest fold change in response to (1) one of the three RT protocols only (miR-208b for SE, miR-542-5p for MH, and miR-206 for MS), (2) two of the three RT protocols (miR-219 and miR-532 for SE and MS, and miR-628-5p for MH and MS), or (3) all of the three RT protocols (miR-216a and miR-205). Additionally, given that exercise can induce disturbances in skeletal muscle structure and function as well as a cascade of inflammatory responses9, 8 miRNAs related to muscle or inflammation were also selected, including miR-1, miR-133a, miR-133b, miR-146a, miR-181a, miR-21, miR-221 and miR-37815–17. Five of the selected miRNAs (miR-1, miR-133a, miR-133b, miR-206 and miR-208b) belong to the myomiRs, which are exclusively or preferentially expressed in muscle18. All of the 16 selected miRNAs were quantified individually among the three RT protocols.
Figure 2.
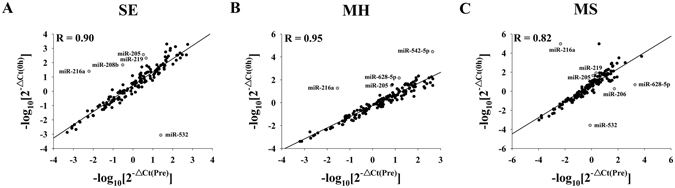
Pearson correlation scatter plot of the circulating miRNA levels for SE (A), MH (B) and MS (C) as determined by TLDA. The Ct values were normalized to the calculated mean Ct value of the Let-7d/g/i of each pooled sample (ΔCt).
Table 2.
Markedly altered miRNAs in pooled plasma samples from baseline (Pre) compared with those from immediately after exercise (0 h) in the SE, MH and MS groups as determined by TLDA.
| SE | MH | MS | |||||||||
|---|---|---|---|---|---|---|---|---|---|---|---|
| Relative expression | Log2(Fold change) | Relative expression | Log2(Fold change) | Relative expression | Log2(Fold change) | ||||||
| miRNA | Pre | 0 h | miRNA | Pre | 0 h | miRNA | Pre | 0 h | |||
| Increased | Increased | Increased | |||||||||
| miR-532-5p | 0.04001 | 1168.79638 | 14.83 | miR-214–3p | 0.01499 | 0.28228 | 4.24 | miR-532–5p | 1.30000 | 12242.07083 | 13.20 |
| Decreased | miR-551b-5p | 0.00223 | 0.03075 | 3.79 | miR-628–5p | 0.00053 | 0.66777 | 10.31 | |||
| miR-184 | 0.20166 | 0.01648 | −3.61 | miR-31–5p | 0.00499 | 0.05294 | 3.41 | miR-206 | 0.01914 | 1.77427 | 6.53 |
| miR-148b-3p | 0.02277 | 0.00178 | −3.68 | Decreased | Decreased | ||||||
| miR-135b-5p | 0.01304 | 0.00100 | −3.70 | miR-628–5p | 0.06715 | 0.00685 | −3.29 | miR-205–5p | 0.77325 | 0.07342 | −3.40 |
| miR-320b | 1.06079 | 0.08151 | −3.70 | miR-542–5p | 0.00227 | 0.00003 | −6.05 | miR-219–5p | 0.46054 | 0.03957 | −3.54 |
| miR-99b-3p | 10.93159 | 0.78567 | −3.80 | miR-216a | 35.10579 | 0.05364 | −8.97 | miR-204–5p | 0.27257 | 0.00003 | −13.29 |
| miR-551b-5p | 0.36030 | 0.01997 | −4.17 | miR-216a | 222.05428 | 0.00003 | −22.62 | ||||
| miR-183–5p | 0.02004 | 0.00050 | −5.33 | ||||||||
| miR-219–5p | 0.21909 | 0.00485 | −5.50 | ||||||||
| miR-205–5p | 0.30140 | 0.00275 | −6.78 | ||||||||
| miR-208b | 3.30777 | 0.01446 | −7.84 | ||||||||
| miR-216a | 163.23403 | 0.04021 | −12.29 | ||||||||
The relative expression was expressed based on the formula (2−△Ct) and the Ct values were normalized on the calculated mean Ct value of the Let-7d/g/i of each pooled sample (ΔCt). Fold changes of miRNAs species were calculated using the 2−ΔΔCt method.
Circulating miRNAs in response to the acute muscle endurance protocol and association with conventional biomarkers
For each of the three groups, the Ct values for Let-7d/g/i before and after resistance exercise showed low variability (see Supplementary Fig. S1). The plasma levels of four myomiRs (miR-1, miR-133a, miR-133b and miR-206) and other tissue-specific miRNAs or unknown origin miRNAs displayed no significant changes at different time points (p values between 0.06 and 0.97). The relative concentrations of the 16 c-miRNAs are presented in Table 3.
Table 3.
The relative concentrations of 16 plasma miRNAs chosen from TLDA determined by RT-qPCR assay for the SE, MH and MS protocols.
| miRNA | SE | MH | MS | |||||||||
|---|---|---|---|---|---|---|---|---|---|---|---|---|
| Pre | 0 h | 1 h | 24 h | Pre | 0 h | 1 h | 24 h | Pre | 0 h | 1 h | 24 h | |
| miR-1 | 0.14 ± 0.02 | 0.17 ± 0.05 | 0.22 ± 0.04 | 0.12 ± 0.03 | 0.24 ± 0.05 | 0.19 ± 0.05 | 0.23 ± 0.05 | 0.33 ± 0.13 | 0.27 ± 0.06 | 0.24 ± 0.04 | 0.31 ± 0.06 | 0.29 ± 0.06 |
| miR-133a | 0.46 ± 0.09 | 0.46 ± 0.17 | 0.46 ± 0.11 | 0.43 ± 0.15 | 0.33 ± 0.04 | 0.17 ± 0.55* | 0.33 ± 0.06 | 0.28 ± 0.04 | 1.34 ± 0.30 | 0.90 ± 0.19* | 1.22 ± 0.27 | 1.17 ± 0.36 |
| miR-133b | 0.11 ± 0.02 | 0.12 ± 0.02 | 0.14 ± 0.03 | 0.11 ± 0.01 | 0.10 ± 0.01 | 0.08 ± 0.01 | 0.12 ± 0.04 | 0.14 ± 0.02† | 0.13 ± 0.02 | 0.11 ± 0.01 | 0.14 ± 0.02† | 0.11 ± 0.01 |
| miR-146a | 4.01 ± 0.21 | 3.65 ± 0.10 | 6.23 ± 2.01) | 4.17 ± 1.07 | 1.63 ± 0.38 | 1.15 ± 0.25 | 1.01 ± 0.21 | 1.26 ± 0.22 | 1.99 ± 0.31 | 2.33 ± 0.09 | 2.15 ± 0.10 | 1.79 ± 0.18 |
| miR-181a | 0.1 ± 0.02 | 0.08 ± 0.02 | 0.09 ± 0.01 | 0.07 ± 0.01 | 0.07 ± 0.02 | 0.07 ± 0.02 | 0.12 ± 0.03*,† | 0.06 ± 0.01‡ | 0.07 ± 0.01 | 0.06 ± 0.01 | 0.07 ± 0.01 | 0.05 ± 0.01 |
| miR-21 | 5.87 ± 0.67 | 4.35 ± 1.28 | 6.77 ± 0.99 | 4.89 ± 0.75 | 5.66 ± 0.79 | 3.93 ± 0.71* | 6.62 ± 1.00† | 5.17 ± 1.10 | 3.37 ± 0.63 | 3.03 ± 0.53 | 3.16 ± 0.52 | 2.63 ± 0.37 |
| miR-205 | 0.08 ± 0.01 | 0.06 ± 0.01 | 0.08 ± 0.01 | 0.08 ± 0.02 | 0.10 ± 0.01 | 0.12 ± 0.05 | 0.10 ± 0.01 | 0.10 ± 0.01 | 0.13 ± 0.02 | 0.13 ± 0.01 | 0.15 ± 0.02 | 0.14 ± 0.02 |
| miR-206 | 14.6 ± 2.32 | 13.1 ± 2.63 | 16.9 ± 3.23 | 13.1 ± 3.31 | 11.6 ± 1.60 | 8.9 ± 0.96 | 14.0 ± 1.34 | 10.7 ± 0.99† | 10.4 ± 1.61 | 8.2 ± 1.35 | 11.3 ± 1.90 | 7.3 ± 1.55 |
| miR-208b | 0.22 ± 0.04 | 0.13 ± 0.03* | 0.17 ± 0.03 | 0.12 ± 0.03* | 0.23 ± 0.06 | 0.17 ± 0.02 | 0.22 ± 0.07 | 0.24 ± 0.08 | 0.23 ± 0.03 | 0.17 ± 0.03 | 0.14 ± 0.02 | 0.16 ± 0.03 |
| miR-216a | ND | ND | ND | |||||||||
| miR-219 | 0.06 ± 0.01 | 0.05 ± 0.01 | 0.05 ± 0.01 | 0.04 ± 0.01 | 0.07 ± 0.01 | 0.06 ± 0.01 | 0.06 ± 0.01 | 0.07 ± 0.01 | 0.04 ± 0.01 | 0.05 (0.01) | 0.06 ± 0.01 | 0.06 ± 0.01 |
| miR-221 | 0.27 ± 0.02 | 0.31 ± 0.04 | 0.29 ± 0.03 | 0.24 ± 0.01 | 0.13 ± 0.01 | 0.16 ± 0.02 | 0.08 ± 0.69† | 0.15 ± 0.02‡ | 0.15 ± 0.07 | 0.12 ± 0.04 | 0.12 ± 0.05 | 0.12 ± 0.01 |
| miR-378 | 2.84 ± 0.30 | 2.48 ± 0.31 | 2.85 ± 0.49 | 2.54 ± 0.17 | 3.34 ± 0.41 | 4.08 ± 0.72 | 3.90 ± 0.56 | 3.73 ± 0.50 | 3.20 ± 1.03 | 3.05 ± 0.1 | 3.25 ± 0.45 | 2.98 ± 0.56 |
| miR-532 | 0.53 ± 0.08 | 0.61 ± 0.08 | 0.64 ± 0.08* | 0.69 ± 0.08* | 0.85 ± 0.57 | 0.77 ± 0.47 | 0.57 ± 0.28 | 0.86 ± 0.57 | 0.69 ± 0.05 | 0.58 ± 0.06 | 0.53 ± 0.08 | 0.50 ± 0.09 |
| miR-542 | 0.04 ± 0.01 | 0.03 ± 0.01 | 0.03 ± 0.01 | 0.03 ± 0.01 | 0.07 ± 0.01 | 0.06 ± 0.01 | 0.07 ± 0.01 | 0.06 ± 0.01 | 0.03 ± 0.01 | 0.03 ± 0.01 | 0.03 ± 0.01 | 0.03 ± 0.01 |
| miR-628 | 0.42 ± 0.03 | 0.39 ± 0.02 | 0.39 ± 0.04 | 0.34 ± 0.03 | 0.33 ± 0.06 | 0.34 ± 0.06 | 0.32 ± 0.05 | 0.29 ± 0.05 | 0.47 ± 0.02 | 0.42 ± 0.02 | 0.49 ± 0.04 | 0.41 ± 0.02 |
The relative concentrations of the circulating miRNAs were normalized to the Let-7d/g/i and presented as the mean ± SEM. miRNAs were obtained from plasma samples at baseline (Pre), immediately after exercise (0 h), after 1 h of recovery (1 h), after 24 h of recovery (24 h). *p < 0.05 compared to Pre; † p < 0.05 compared to 0 h; ‡ p < 0.05 compared to 1 h. ND, non-detected values. Values obtained from 15 subjects separately in each of the three groups.
However, the plasma levels of miR-532 were markedly increased after 1 h recovery (p < 0.05) and remained elevated after 24 h recovery (p < 0.05) (Fig. 3A). Additionally, the plasma levels of another myomiR, miR-208b, were observably decreased 0 h postexercise (p < 0.05) and did not return to the basal level after 24 h recovery (p < 0.05) (Fig. 3B).
Figure 3.
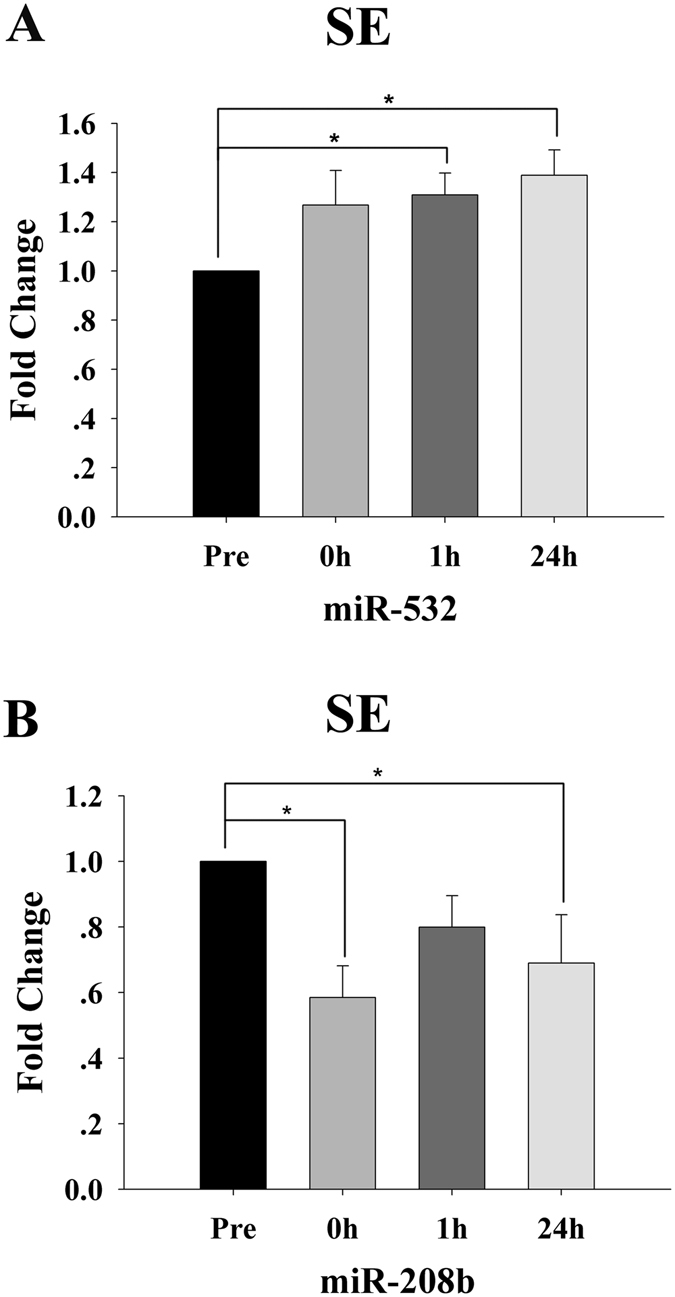
Time-course changes in the plasma levels of miR-532 (A) and miR-208b (B) for the resistance endurance (SE) protocol (n = 15). For each subject, the c-miRNA levels at baseline (Pre) were assigned a fold change of 1, and measurements obtained immediately after exercise (0 h), after 1 h of recovery (1 h) and after 24 h of recovery (24 h) were compared to the baseline. *Indicates differences compared to Pre, p < 0.05. Values represent the mean ± SEM.
In particular, IL-10 displayed a consistent increase (Fig. 4A) similar to that for miR-532 (Fig. 4B). A distinct positive correlation (R = 0.42, p = 0.004; Fig. 4D) was observed between changes in plasma levels of miR-532 and IL-10. Moreover, a significant negative correlation (R = −0.33, p = 0.03) was observed between alterations in the plasma miR-532 level and the IGF-1 level (Fig. 4B,C,E).
Figure 4.
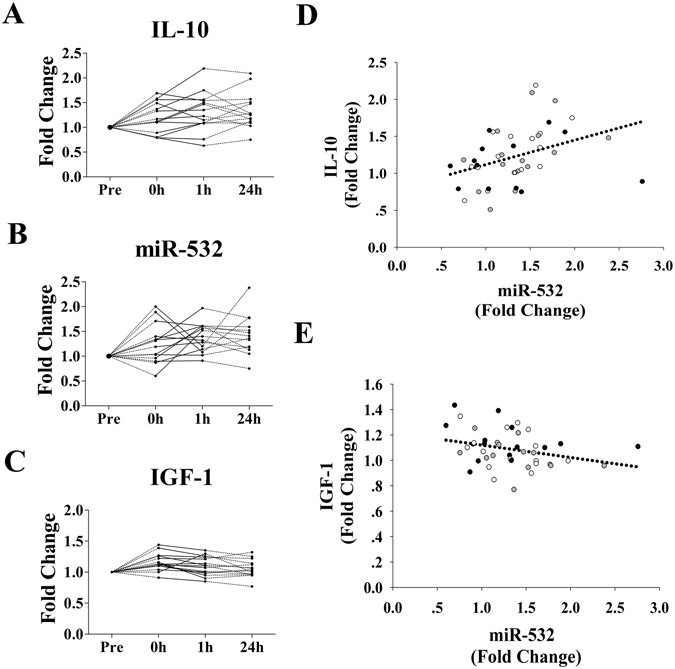
Alterations in miR-532 are directly correlated with changes in plasma IL-10 and IGF-1 levels (n = 15). For each subject, the plasma levels of miR-532, IL-10 and IGF-1 at baseline (Pre) were assigned a fold change of 1, and measurements obtained immediately after exercise (0 h), after 1 h of recovery (1 h) and after 24 h of recovery (24 h) were compared to the baseline. Scatterplots show the plasma levels of IL-10 (A), miR-532 (B) and IGF-1 (C). A direction correlation is observed between the levels of plasma miR-532 and IL-10 (D) and IGF-1 (E). The correlation analysis indicates the sum result of the three time points (black dots indicate the values for 0 h; white dots indicate the values for 1 h; and gray dots indicate the values for 24 h).
Circulating miRNAs in response to the acute muscle hypertrophy protocol and association with conventional biomarkers
Three myomiRs, miR-133a, miR-133b and miR-206 that were not affected by SE, showed different expression patterns in response to MH. The plasma levels of miR-133a were significantly decreased (p < 0.05) 0 h postexercise, and restored to the baseline level after 1 h recovery (p > 0.05) (Fig. 5A). The plasma levels of miR-133b level were markedly increased after 24 h recovery (p < 0.05) (Fig. 5B). The plasma miR-206 reached peak levels after 1 h recovery (p < 0.05) and decreased to the baseline level after 24 h recovery (p > 0.05) (Fig. 5C).
Figure 5.
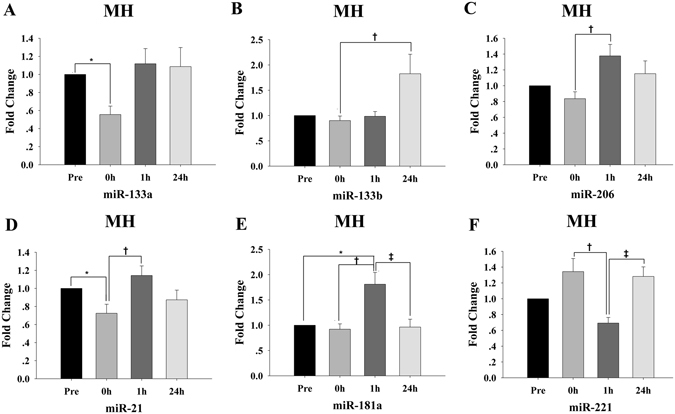
Time-course changes in specific circulating miRNAs for the muscle hypertrophy (MH) protocol (n = 15). (A–F) For each participant, the c-miRNA levels at baseline (Pre) were assigned a fold change of 1, and measurements obtained immediately after exercise (0 h), after 1 h of recovery (1 h) and after 24 h of recovery (24 h) were compared to the baseline. *indicates differences compared to Pre, p < 0.05; †indicates differences compared to 0 h, p < 0.05; ‡indicates differences compared to 1 h, p < 0.05. Values represent the mean ± SEM.
Additionally, other muscle or inflammation-related miRNAs also responded to MH. The plasma levels of miR-21 were markedly decreased 0 h postexercise (p < 0.05) and reached peak values after 1 h recovery (Fig. 5D). The plasma miR-181a levels peaked after1 h recovery (p < 0.05) and decreased to the baseline value after 24 h recovery (p > 0.05) (Fig. 5E). The plasma levels of miR-221 displayed a nonsignificant increase 0 h postexercise, following with a significant decrease after 1 h recovery (p < 0.05) and increased again after 24 h recovery (p < 0.05) (Fig. 5F).
No distinct changes in the plasma levels of the other 10 miRNAs were observed (p values between 0.06 and 0.96) (Table 3). There were no correlations between the levels of the six changed c-miRNAs and conventional parameters (R values between −0.43 and 0.43, p values between 0.08 and 0.96).
Circulating miRNAs in response to the maximum muscle resistance protocol and association with conventional biomarkers
Two myomiRs, miR-133a and miR-133b which responded to MH, were also affected by MS. The plasma levels of miR-133a reached its minimum 0 h postexercise (p < 0.05) and restored to the basal level after 1 h recovery (p > 0.05) (Fig. 6A). The plasma miR-133b levels were not observably changed 0 h postexercise, peaking after 1 h recovery (p < 0.05) (Fig. 6B).
Figure 6.
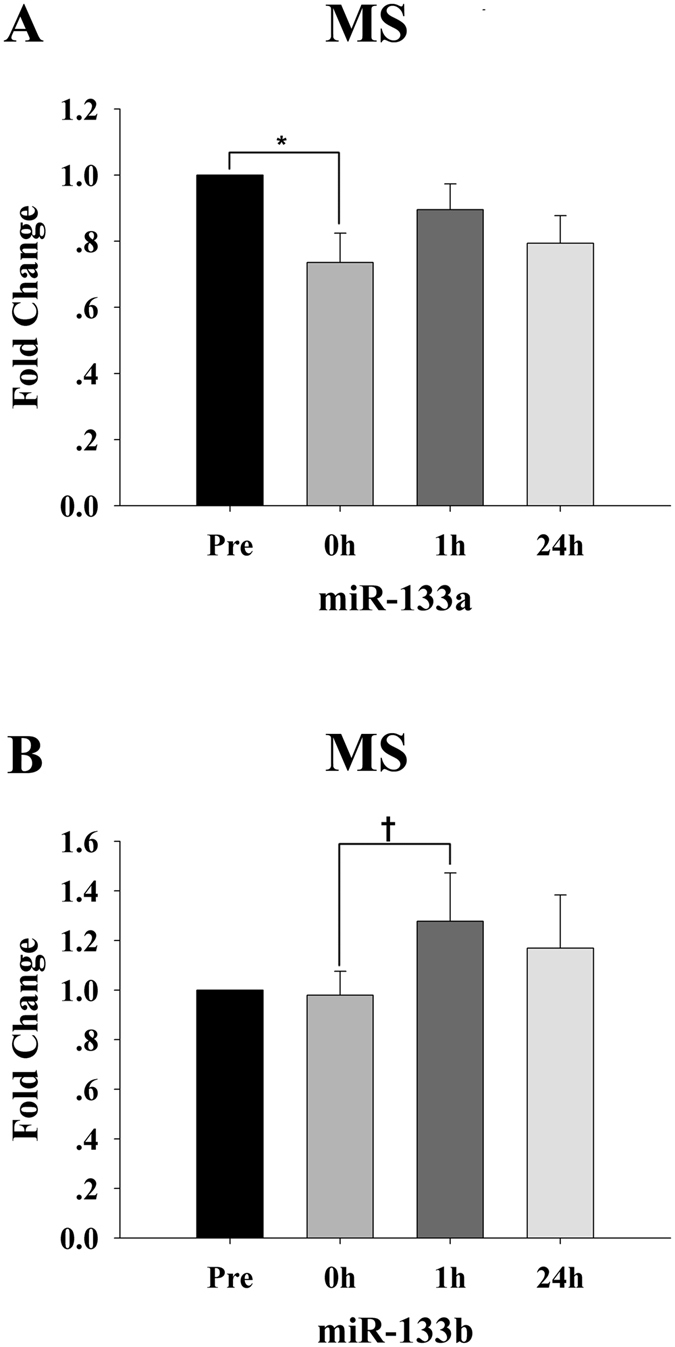
Time-course changes in the plasma levels of miR-133a (A) and miR-133b (B) for the maximum strength (MS) protocol (n = 15). For each subject, the c-miRNA levels at baseline (Pre) were assigned a fold change of 1, and measurements obtained immediately after exercise (0 h), after 1 h of recovery (1 h) and after 24 h of recovery (24 h) were compared to the baseline. *Indicates differences compared to Pre, p < 0.05; †indicates differences compared to 0 h, p < 0.05. Values represent the mean ± SEM.
Additionally, no significant changes were found for other c-miRNAs at different time points (p values between 0.13 and 0.97) (Table 3). Correlation analysis indicated that changes in miR-133a had a negative correlation with cortisol (R = −0.53, p = 0.04; Fig. 7A,B,D) and a positive correlation with T/C (R = 0.59, p = 0.02; Fig. 7B,C,E).
Figure 7.
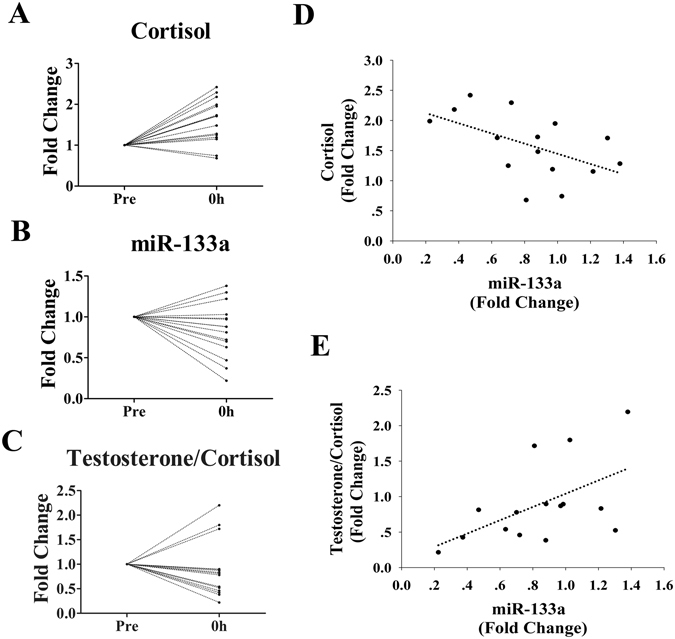
Correlations of miR-133a with plasma cortisol and testosterone/cortisol levels (n = 15). For each subject, the plasma levels of miR-133a, cortisol and testosterone at baseline (Pre) were assigned a fold change of 1, and measurements obtained immediately after exercise (0 h), after 1 h of recovery (1 h) and after 24 h of recovery (24 h) were compared to the baseline. Scatterplots show the plasma levels of cortisol (A), miR-133a (B) and testosterone/cortisol (C). A direct correlation is observed between plasma levels of miR-133a and cortisol (D) and testosterone/cortisol (E).
Summary of the validated and predicted targets of the changed circulating miRNAs
Subsequently, we summarized the validated target genes regulated by the altered plasma miRNAs which responded to the three RT protocols. The target genes and their functions that involved in muscle biogenesis and structure as well as exercise induced adaptations (such as inflammations and angiogenesis) are shown as Supplementary Table S1. To explore the potential roles of emerging miR-532, we performed a bioinformatics prediction of the possible targets via the use of multiple target prediction databases (DIANA, Microinspector, Miranda, Mirtarget, Mitarget, Nbmirtar, Pictar, Pita, Rna22, Rnahybrid and Targetscan). The targets which were simultaneously predicted by at least five prediction databases were selected for subsequent Gene Ontology (GO) analysis. The predicted miR-532 targets and the involved biological processes which are potentially related to exercise induced adaptations (such as energy metabolism and immune response) are listed in Table 4.
Table 4.
The predicted targets of miR-532 and the involved biological processes analyzed by Gene Ontology.
| Biological process | Predicted targets |
|---|---|
| Generation of precursor metabolites and energy (GO: 0006091) | CS |
| PYROXD1 | |
| ERO1L | |
| Carbohydrate metabolic process (GO: 0005975) | DBT |
| NMUR2 | |
| CS | |
| ARSJ | |
| PPP1R3A | |
| SI | |
| ARSG | |
| CDK6 | |
| PPP1R3D | |
| Lipid metabolic process (GO: 0006629) | B3GNT1 |
| NR2C2 | |
| Tricarboxylic acid cycle (GO: 0006099) | CS |
| Immune response (GO: 0006955) | ULBP1 |
| IL6ST | |
| NCF2 | |
| NFKB1 | |
| TNFRSF1B | |
| GBP1 | |
| SESTD1 |
Discussion
Each RT modality leads to differentiated molecular and structural adaptations not only in the exercised muscle but also in distant tissues, resulting in a whole body adaptive response1. Overall, the results of the present study suggest that RT can lead to distinct time course changes in the profiles of c-miRNAs, and these changes likely depend on the RT modality or intensity. Moreover, the correlations of miR-532 and miR-133a in particular with conventional parameters suggested their potential roles as biomarkers of resistance exercise.
Regimented RT is well-established as an effective mechanism to achieve a specific training outcome by specifying acute RT program variables1. Although these training variables are conducive to good performance and post-exercise adaptations to resistance exercise, the relative intensity (%1RM) appears to be a key factor19. Additionally, maximizing the specific response to RT is thought to be best achieved by proper manipulation of exercise1–3. Specific signaling pathways are critical for the structural remodeling and functional adjustment of skeletal muscle in response to exercise-induced physiological and biochemical stimuli20, 21. The principle of super-compensation is necessary to increase exercise stimulus and for adaptations to occur22. The time-course changes for an acute hormonal and cytokine or c-miRNA response to RT might provide a thorough understanding of the molecular events that occur during exercise and later recovery phases.
Traditionally, changes in anabolic-catabolic hormones, muscle damage markers and inflammatory mediators have been widely used to monitor and understand these acute program variables23. In our study, these conventional biomarkers, such as testosterone, cortisol, T/C, IGF-1, CK and IL-10 showed different dynamic responses to the different RT protocols. While the pro-inflammatory biomarkers, such as IL-6 and hs-CRP24, did not show any changes at different time points. These results are in partly consistent with previous studies24, 25. At present, although the mechanism about exercise induced release of these biomarkers remains incompletely understood, the physiological implications have been addressed24, 25.
The c-miRNAs, which are present and highly stable in the bloodstream, have been proposed as potential new biomarkers of specific exercise responses12, 15, 26, 27. In our study, the plasma levels of several myomiRs (including miR-133a, miR-133b, miR-206 and miR-208b) showed dynamic changes in response to RT, whereas the plasma miR-1 did not respond to RT. Such differential changes for these myomiRs in circulation might indicate the different degrees of muscle fiber recruitment or stress/adaptations in response to RT. Additionally, the direct correlations between the changes in plasma cortisol level and the T/C ratio and miR-133a level that were observed for the MS protocol likely indicated stressful training (overreaching)1. Moreover, cortisol was significantly, albeit weakly, associated with gains in type II fiber area28. Thus, the plasma miR-133a level may be a potentially useful biomarker of an actual physiological strain or tissue-remodeling processes for the MS protocol.
In the present study, other c-miRNAs besides myomiRs also displayed different responses to the three RT protocols. For the SE protocol, time-course analysis showed that the plasma miR-532 level increased during early recovery and remained elevated for a long time. For the MH protocol, the plasma levels of three c-miRNAs, miR-21, miR-181a and miR-221, also showed dynamic changes. The plasma levels of miR-21, which plays a crucial role in the inflammatory response29, has been found to change after a single bout of endurance exercise15. In our study, the time course of the plasma miR-21 level, starting with a decrease immediately after exercise followed by an increase during early recovery, may reflect the balance between the initial pro-inflammatory and later immunoregulatory anti-inflammatory responses29. There is increasing evidence that many of the pro-oxidative and pro-inflammatory processes that occur after acute exercise may be vital for the long-term adaptive responses to exercise training30. The plasma levels of miR-181a, a possible biomarker of acute muscle wasting31, was increased during early recovery. Moreover, the plasma miR-221 which is related to vascular biology and fat and glucose metabolism32, also showed dynamic responses in the present study. Additionally, the plasma miR-146a level, which increased in response to acute endurance exercise26 and decreased 3 days post-resistance exercise13, did not respond to RT in our study. The plasma levels of miR-378 which is associated with muscle mass gains in vivo 33, remained unchanged for the three RT protocols. The differences between the findings of our study and other studies may relate to exercise modality and the timing of the blood draws or training state12, 26, 33.
Furthermore, a negative correlation between the changes in plasma levels of IGF-1 and miR-532, as well as a positive correlation between that of IL-10 and miR-532 were observed in the present study. The increased IGF-1 level may exert positive effects on adaption to resistance exercise, i.e., muscle hypertrophy or connective tissue25. Moreover, exercise training improved the inflammatory profile by increasing the levels of the anti-inflammatory cytokine IL-10 in post-myocardial infarction patients34. In consideration of the correlations being the combined results for all data points, it is conceivable that there were c-miRNA-hormone stress or adaptation associations. Moreover, the predicted target genes of miR-532 revealed the potential role of miR-532 in metabolism processes or inflammation response related to RT. Thus, miR-532 may also be a biomarker for the beneficial effect of physical exercise or tissue-remodeling processes in response to RT.
Taken together, these results suggest that not all c-miRNAs from skeletal muscle or other tissues respond to an RT stimulus. Furthermore, the variation of c-miRNAs and traditional blood parameters noted above is likely related to the type or amount of muscle activated during resistance exercise. In our study, the absolute workloads for the three RT protocols were the same, thus the differential expression of c-miRNAs may be related to relative intensity. Plasma miRNAs, such as miR-133a, miR-133b, miR-181a, miR-206, miR-208b, miR-21, miR-221 and miR-532, may therefore represent important novel indicators of skeletal muscle, inflammation or metabolism stress or adaptations to RT protocols with different intensity.
Currently, whether the RT induced dynamic changes in c-miRNAs during exercise and the recovery phase directly reflect intracellular miRNA turnover is unknown. A previous study showed that extracellular dystrophy-associated miRNA levels show a dynamic mode of expression that mirrors the process of muscle pathology35. It is likely that the levels of different c-miRNAs induced by RT protocols may reflect specific training-related dynamic activities. Thus, c-miRNAs could be useful biomarkers for physiological mediators of exercise-induced stress or adaptations during exercise or the recovery phase.
The mechanism and function underlying the uptake and release of c-miRNAs following exercise are still unclear36, 37, and need to be studied further. However, characterizing these responses is an important step in understanding of the roles of exercise induced c-miRNA changes. Exercise induced c-miRNA elevations may represent a more generalized response to internal and/or external stress. Factors, including mechanical, oxidative or nitrosative stress, damaged cells26, changes in blood cell numbers38 or hemolysis39 and the release of secreted extracellular vesicles (exosomes)40, likely induce c-miRNAs production during exercise. However, c-miRNAs responded differently to the RT protocols in the present study, indicating a specific response to the demands of the exercise rather than a global exercise-induced c-miRNA response.
In summary, the findings of the present study indicate that RT can lead to changes in c-miRNA levels with transient and delayed kinetics. The amounts and differential expression of c-miRNAs in response to acute RT, which potentially depend on the relative intensity or other RT variables, may point to a physiological role in the phenotypic changes and metabolic and inflammatory processes induced by exercise.
Limitations
This study has some limitations. First, the post-exercise analysis was only limited to 24 h after exercise, thus the delayed kinetics changes in c-miRNA profiles for a longer period of recovery were undetected. Second, the participants in the present study had maintained a regular exercise regimen for a period of time. The RT-associated alterations in some c-miRNAs are likely distinct between the untrained state and trained state. Additionally, we only analyzed the differences of the c-miRNAs and blood parameters in the same RT protocol. For practical and ethical reasons, the three RT protocols were performed by different individuals. To avoid the statistical difference that may be caused by the intrinsic and inherent discrepancy of different participants, we did not compare the c-miRNAs and conventional parameters among different RT protocols.
Materials and Methods
Subjects
Forty-five university cadets who led similar lives were requested to volunteer for this study. The participants had maintained a regular exercise regimen for 10 months, and none had weight machine training experience. Exclusion criteria included any history of neuromuscular, cardiovascular, hormonal and metabolic diseases. The subjects were prohibited from taking any medications, and the subjects maintained the same dietary intake throughout the study.
Blood samples were collected according to protocols approved by the Human Research Ethics Committee of Nanjing University. Written informed consent was obtained from all of the subjects. The Human Research Ethics Committee of Nanjing University approved the study protocol in conformity with the Declaration of Helsinki, and all experiments were carried out in accordance with approved guidelines of the Nanjing University.
Experimental design
The forty-five students were randomly assigned to one of three groups: strength endurance exercise group (SE), muscular hypertrophy group (MH) and maximum strength group (MS). One week was dedicated exclusively to the individual’s 1RM test and familiarization of the participants with the equipment and exercise protocol. For each resistance exercise protocol, blood was collected before (Pre), immediately after exercise (0 h), 1 h after exercise (1 h) and 24 h after exercise (24 h) to assess the c-miRNAs and traditional biomarkers. For each group, the blood samples drawn before the exercise were set as a control.
Resistance exercise protocols
The training protocols consisted of five exercises, which activated large or small muscle masses and were performed in the following order: bench press, squat, pulldown, overhead press and standing dumbbell curl. All exercises were performed using free weights or universal weight machines. The maximum strength for every exercise was measured using the 1RM method41.
The training protocols were designed in conformity with previous studies1, 5. In brief, the SE protocol consisted of three sets of 16–20 repetitions at 40% of the 1RM intensity with a 1-minute rest interval between exercises and sets. The MH protocol consisted of three sets of 12 repetitions at 70% of the 1RM intensity with a 2-minute rest interval between exercises and sets. The MS protocol consisted of four sets of 6 repetitions at 90% of the 1RM intensity with a 3-minute rest interval between exercises and sets. All subjects used a complete range of motion and a cadence of a 1- to 2-second positive phase and a 1- to 2-second negative phase. The total workload for the three RT protocols was kept as similar as possible.
Experimental protocol
The subjects checked into the laboratory at 4 p.m. and did not perform physical exercise for 72 h before the experimental session. Each subject performed the experimental sessions at the same time of day. All subjects performed a 5-minute warm-up of treadmill walking and calisthenics and a specific warm-up for each exercise with a constant range of motion and without an external load; this warm-up consisted of approximately 10 repetitions, and then, the subjects had a 5-minute recovery interval. Each group performed experiments according to their training protocols.
Blood samples
During each acute exercise experiment, five milliliters of blood was collected before exercise and immediately, 1 h and 24 h after exercise in standard anticoagulant (EDTAK2)-treated vacutainer tubes for every subject. All blood samples were centrifuged at 1500 × g for 10 minutes immediately after each blood draw to pellet cellular elements and then centrifuged at 10,000 × g for 5 minutes at 4 °C to completely remove cell debris. The supernatant plasma was then collected and immediately frozen at −80 °C.
Biochemical analyses
Blood samples were collected before and immediately and 1 h after exercise for determination of LA. Blood LA was determined using an automatic lactate analyzer (EKF Diagnostic GmbH, Barleben, Germany). Testosterone and cortisol were measured using chemiluminescent microparticle immunoassays (Beckman Coulter Inc., Brea, CA, USA). IGF-1 was measured using chemiluminescence immunoassays (Diagnostic Products Corporation, Los Angeles, USA). IL-6 was measured using electrochemiluminescence immunoassays (Roche Diagnostics, Mannheim, Germany). CK and hs-CRP were measured using an automatic clinical chemistry analyzer (Hitachi 7600, Japan). The concentration of IL-10 was measured using a commercial radioimmunoassay kit (Beijing North Institute of Biological Technology, China).
Circulating miRNA screening using a TaqMan Low Density Array
The TLDA was used as described previously42. For the three RT protocols, an equal volume of plasma from 10 participants was mixed separately to form the Pre and 0 h sample pools (each sample pool contained 10 ml). RNA was isolated from each pooled sample using TRIzol reagent, and reverse transcription was carried out using a TaqMan MicroRNA Reverse Transcription Kit and Megaplex RT Primers. The miRNA screening of 754 different human miRNAs was performed using the TLDA on an ABI PRISM 7900HT Fast Real-Time PCR System (Applied Biosystems). The concentrations of plasma miRNAs were normalized to Let-7d/g/i trio43. The results are shown using the Ct (cycle threshold) value and normalized to the calculated mean Ct value of the Let-7d/g/i of each pooled sample (ΔCt). The relative expression was determined using the comparative Ct method (2−ΔΔCt).
RNA isolation and quantification of circulating miRNAs
RNA isolation and RT-qPCR were performed as described previously42. The total RNA, including miRNAs, was extracted from 100 µL plasma using a 1-step phenol/chloro form purification protocol. To control for variability in the RNA extraction and purification procedures, all samples from a given subject were handled in the same batch. Hydrolysis probe-based RT-qPCR was carried out using a TaqMan PCR kit and an Applied Biosystems 7300 Sequence Detection System44. The Ct values were determined using default threshold settings, and the average Ct value was calculated from triplicate PCRs. Ct values were normalized to the Let-7d/g/i trio, and the fold change of individual miRNA was determined using the 2−ΔΔCt equation. The ΔCt was calculated by subtracting the Ct values of the Let-7d/g/i trio from the mean Ct values of the target miRNAs. The ΔCt values were then compared (ΔΔCt) with each participant’s own resting baseline value at the Pre time point (normalized to a fold change of 1).
Statistical analysis
The GraphPad Prism 5 and SigmaPlot 10.0 packages were used. Data are presented as the means ± standard error of the mean (SEM). The normality of the data distribution was tested using the Shapiro-Wilk normality test. The non-parametric Friedman test was performed to compare miRNA, inflammatory cytokine and muscle damage marker concentrations. The differences in other variables were compared using repeated measures ANOVA. When appropriate (p value < 0.05), a Dunn multiple comparison (miRNAs, inflammatory cytokines and muscle damage markers) or a Bonferroni multiple comparison (other variables) post hoc test was used to compare groups of different time points. Each result labeled with p < 0.05 indicates p values that resulted from the post hoc test. Correlations of miRNA profiles between baseline and immediately after exercise were calculated using Pearson correlation analysis, and correlations of miRNAs and other blood parameters were performed using Spearman rank correlation analysis as appropriate for the data distribution. A p value < 0.05 was considered statistically significant.
Electronic supplementary material
Acknowledgements
The authors acknowledge that this work was supported by the National Basic Research Program of China (2014CB542300), the National Natural Science Foundation of China (81101330, 31271378, and 81250044), the Natural Science Foundation of Jiangsu Province (BK2012014) and the Research Special Fund for Public Welfare Industry of Health (201302018). This work was also supported by the Program for New Century Excellent Talents in University from Ministry of Education of China (NCET-12-0261).
Author Contributions
C.Y.Z., X.C. and J.M. conceived and designed the study. J.M. and S.C. drafted the article and revised it critically for important intellectual content. S.C. performed the statistical analysis. S.C., C.Z. and X.Y. performed the experiments. B.S., X.G. and D.C. enrolled participants and collected blood samples. All of the authors reviewed and approved the manuscript.
Competing Interests
The authors declare that they have no competing interests.
Footnotes
Electronic supplementary material
Supplementary information accompanies this paper at doi:10.1038/s41598-017-02294-y
Publisher's note: Springer Nature remains neutral with regard to jurisdictional claims in published maps and institutional affiliations.
Contributor Information
Chen-Yu Zhang, Email: cyzhang@nju.edu.cn.
Xi Chen, Email: xichen@nju.edu.cn.
Jizheng Ma, Email: mjz_mjj@163.com.
References
- 1.Bird SP, Tarpenning KM, Marino FE. Designing resistance training programmes to enhance muscular fitness: a review of the acute programme variables. Sports Med. 2005;35:841–851. doi: 10.2165/00007256-200535100-00002. [DOI] [PubMed] [Google Scholar]
- 2.Garber CE, et al. American College of Sports Medicine position stand. Quantity and quality of exercise for developing and maintaining cardiorespiratory, musculoskeletal, and neuromotor fitness in apparently healthy adults: guidance for prescribing exercise. Med Sci Sports Exerc. 2011;43:1334–1359. doi: 10.1249/MSS.0b013e318213fefb. [DOI] [PubMed] [Google Scholar]
- 3.American College of Sports, M American College of Sports Medicine position stand. Progression models in resistance training for healthy adults. Med Sci Sports Exerc. 2009;41:687–708. doi: 10.1249/MSS.0b013e3181915670. [DOI] [PubMed] [Google Scholar]
- 4.Schroeder ET, Villanueva M, West DD, Phillips SM. Are acute post-resistance exercise increases in testosterone, growth hormone, and IGF-1 necessary to stimulate skeletal muscle anabolism and hypertrophy? Med Sci Sports Exerc. 2013;45:2044–2051. doi: 10.1249/MSS.0000000000000147. [DOI] [PubMed] [Google Scholar]
- 5.Smilios I, Pilianidis T, Karamouzis M, Tokmakidis SP. Hormonal responses after various resistance exercise protocols. Med Sci Sports Exerc. 2003;35:644–654. doi: 10.1249/01.MSS.0000058366.04460.5F. [DOI] [PubMed] [Google Scholar]
- 6.Benini R, Prado Nunes PR, Orsatti CL, Barcelos LC, Orsatti FL. Effects of acute total body resistance exercise on hormonal and cytokines changes in men and women. J Sports Med Phys Fitness. 2015;55:337–344. [PubMed] [Google Scholar]
- 7.Neme Ide B, Alessandro Soares Nunes L, Brenzikofer R, Macedo DV. Time course of muscle damage and inflammatory responses to resistance training with eccentric overload in trained individuals. Mediators Inflamm. 2013;2013:204942–6. doi: 10.1155/2013/204942. [DOI] [PMC free article] [PubMed] [Google Scholar]
- 8.Izquierdo M, et al. Cytokine and hormone responses to resistance training. Eur J Appl Physiol. 2009;107:397–409. doi: 10.1007/s00421-009-1139-x. [DOI] [PubMed] [Google Scholar]
- 9.Calle MC, Fernandez ML. Effects of resistance training on the inflammatory response. Nutr Res Pract. 2010;4:259–269. doi: 10.4162/nrp.2010.4.4.259. [DOI] [PMC free article] [PubMed] [Google Scholar]
- 10.Sood P, Krek A, Zavolan M, Macino G, Rajewsky N. Cell-type-specific signatures of microRNAs on target mRNA expression. Proc Natl Acad Sci USA. 2006;103:2746–2751. doi: 10.1073/pnas.0511045103. [DOI] [PMC free article] [PubMed] [Google Scholar]
- 11.Kirby TJ, McCarthy JJ. MicroRNAs in skeletal muscle biology and exercise adaptation. Free Radic Biol Med. 2013;64:95–105. doi: 10.1016/j.freeradbiomed.2013.07.004. [DOI] [PMC free article] [PubMed] [Google Scholar]
- 12.Wardle SL, et al. Plasma microRNA levels differ between endurance and strength athletes. PLoS One. 2015;10:e0122107. doi: 10.1371/journal.pone.0122107. [DOI] [PMC free article] [PubMed] [Google Scholar]
- 13.Sawada S, et al. Profiling of circulating microRNAs after a bout of acute resistance exercise in humans. PLoS One. 2013;8:e70823. doi: 10.1371/journal.pone.0070823. [DOI] [PMC free article] [PubMed] [Google Scholar]
- 14.De Guire V, et al. Circulating miRNAs as sensitive and specific biomarkers for the diagnosis and monitoring of human diseases: promises and challenges. Clin Biochem. 2013;46:846–860. doi: 10.1016/j.clinbiochem.2013.03.015. [DOI] [PubMed] [Google Scholar]
- 15.Baggish AL, et al. Dynamic regulation of circulating microRNA during acute exhaustive exercise and sustained aerobic exercise training. J Physiol. 2011;589:3983–3994. doi: 10.1113/jphysiol.2011.213363. [DOI] [PMC free article] [PubMed] [Google Scholar]
- 16.Gagan J, Dey BK, Layer R, Yan Z, Dutta A. MicroRNA-378 targets the myogenic repressor MyoR during myoblast differentiation. J Biol Chem. 2011;286:19431–19438. doi: 10.1074/jbc.M111.219006. [DOI] [PMC free article] [PubMed] [Google Scholar]
- 17.Naguibneva I, et al. The microRNA miR-181 targets the homeobox protein Hox-A11 during mammalian myoblast differentiation. Nat Cell Biol. 2006;8:278–284. doi: 10.1038/ncb1373. [DOI] [PubMed] [Google Scholar]
- 18.Horak M, Novak J, Bienertova-Vasku J. Muscle-specific microRNAs in skeletal muscle development. Dev Biol. 2016;410:1–13. doi: 10.1016/j.ydbio.2015.12.013. [DOI] [PubMed] [Google Scholar]
- 19.Fry AC. The role of resistance exercise intensity on muscle fibre adaptations. Sports Med. 2004;34:663–679. doi: 10.2165/00007256-200434100-00004. [DOI] [PubMed] [Google Scholar]
- 20.Hoppeler H, Klossner S, Fluck M. Gene expression in working skeletal muscle. Adv Exp Med Biol. 2007;618:245–254. doi: 10.1007/978-0-387-75434-5_19. [DOI] [PubMed] [Google Scholar]
- 21.Louis E, Raue U, Yang Y, Jemiolo B, Trappe S. Time course of proteolytic, cytokine, and myostatin gene expression after acute exercise in human skeletal muscle. J Appl Physiol (1985) 2007;103:1744–1751. doi: 10.1152/japplphysiol.00679.2007. [DOI] [PubMed] [Google Scholar]
- 22.Izquierdo M, et al. Differential effects of strength training leading to failure versus not to failure on hormonal responses, strength, and muscle power gains. J Appl Physiol (1985) 2006;100:1647–1656. doi: 10.1152/japplphysiol.01400.2005. [DOI] [PubMed] [Google Scholar]
- 23.Schoenfeld BJ. Does exercise-induced muscle damage play a role in skeletal muscle hypertrophy? J Strength Cond Res. 2012;26:1441–1453. doi: 10.1519/JSC.0b013e31824f207e. [DOI] [PubMed] [Google Scholar]
- 24.Cornish SM, Johnson ST. Systemic cytokine response to three bouts of eccentric exercise. Results Immunol. 2014;4:23–29. doi: 10.1016/j.rinim.2014.04.002. [DOI] [PMC free article] [PubMed] [Google Scholar]
- 25.Hasani-Ranjbar S, Soleymani Far E, Heshmat R, Rajabi H, Kosari H. Time course responses of serum GH, insulin, IGF-1, IGFBP1, and IGFBP3 concentrations after heavy resistance exercise in trained and untrained men. Endocrine. 2012;41:144–151. doi: 10.1007/s12020-011-9537-3. [DOI] [PubMed] [Google Scholar]
- 26.Baggish AL, et al. Rapid upregulation and clearance of distinct circulating microRNAs after prolonged aerobic exercise. J Appl Physiol (1985) 2014;116:522–531. doi: 10.1152/japplphysiol.01141.2013. [DOI] [PMC free article] [PubMed] [Google Scholar]
- 27.Mooren FC, Viereck J, Kruger K, Thum T. Circulating microRNAs as potential biomarkers of aerobic exercise capacity. Am J Physiol Heart Circ Physiol. 2014;306:H557–563. doi: 10.1152/ajpheart.00711.2013. [DOI] [PMC free article] [PubMed] [Google Scholar]
- 28.West DW, Phillips SM. Associations of exercise-induced hormone profiles and gains in strength and hypertrophy in a large cohort after weight training. Eur J Appl Physiol. 2012;112:2693–2702. doi: 10.1007/s00421-011-2246-z. [DOI] [PMC free article] [PubMed] [Google Scholar]
- 29.Sheedy FJ. Turning 21: Induction of miR-21 as a Key Switch in the Inflammatory Response. Front Immunol. 2015;6:19. doi: 10.3389/fimmu.2015.00019. [DOI] [PMC free article] [PubMed] [Google Scholar]
- 30.Allen J, Sun Y, Woods JA. Exercise and the Regulation of Inflammatory Responses. Prog Mol Biol Transl Sci. 2015;135:337–354. doi: 10.1016/bs.pmbts.2015.07.003. [DOI] [PubMed] [Google Scholar]
- 31.Bloch SA, et al. MiR-181a: a potential biomarker of acute muscle wasting following elective high-risk cardiothoracic surgery. Crit Care. 2015;19:147. doi: 10.1186/s13054-015-0853-5. [DOI] [PMC free article] [PubMed] [Google Scholar]
- 32.Chistiakov DA, Sobenin IA, Orekhov AN, Bobryshev YV. Human miR-221/222 in Physiological and Atherosclerotic Vascular Remodeling. Biomed Res Int. 2015;2015:354517–18. doi: 10.1155/2015/354517. [DOI] [PMC free article] [PubMed] [Google Scholar]
- 33.Davidsen PK, et al. High responders to resistance exercise training demonstrate differential regulation of skeletal muscle microRNA expression. J Appl Physiol (1985) 2011;110:309–317. doi: 10.1152/japplphysiol.00901.2010. [DOI] [PubMed] [Google Scholar]
- 34.Ribeiro F, et al. Exercise training increases interleukin-10 after an acute myocardial infarction: a randomised clinical trial. Int J Sports Med. 2012;33:192–198. doi: 10.1055/s-0031-1297959. [DOI] [PubMed] [Google Scholar]
- 35.Roberts TC, et al. Extracellular microRNAs are dynamic non-vesicular biomarkers of muscle turnover. Nucleic Acids Res. 2013;41:9500–9513. doi: 10.1093/nar/gkt724. [DOI] [PMC free article] [PubMed] [Google Scholar]
- 36.Russell AP, et al. Regulation of miRNAs in human skeletal muscle following acute endurance exercise and short-term endurance training. J Physiol. 2013;591:4637–4653. doi: 10.1113/jphysiol.2013.255695. [DOI] [PMC free article] [PubMed] [Google Scholar]
- 37.Aoi W. Frontier impact of microRNAs in skeletal muscle research: a future perspective. Front Physiol. 2014;5:495. doi: 10.3389/fphys.2014.00039. [DOI] [PMC free article] [PubMed] [Google Scholar]
- 38.Connes P, Simmonds MJ, Brun JF, Baskurt OK. Exercise hemorheology: classical data, recent findings and unresolved issues. Clin Hemorheol Microcirc. 2013;53:187–199. doi: 10.3233/CH-2012-1643. [DOI] [PubMed] [Google Scholar]
- 39.Kirschner MB, et al. Haemolysis during sample preparation alters microRNA content of plasma. PLoS One. 2011;6:e24145. doi: 10.1371/journal.pone.0024145. [DOI] [PMC free article] [PubMed] [Google Scholar]
- 40.Fruhbeis C, Helmig S, Tug S, Simon P, Kramer-Albers EM. Physical exercise induces rapid release of small extracellular vesicles into the circulation. J Extracell Vesicles. 2015;4:28239. doi: 10.3402/jev.v4.28239. [DOI] [PMC free article] [PubMed] [Google Scholar]
- 41.Lins-Filho Ode L, et al. Effects of exercise intensity on rating of perceived exertion during a multiple-set resistance exercise session. J Strength Cond Res. 2012;26:466–472. doi: 10.1519/JSC.0b013e31822602fa. [DOI] [PubMed] [Google Scholar]
- 42.Wang C, et al. A Five-miRNA Panel Identified From a Multicentric Case-control Study Serves as a Novel Diagnostic Tool for Ethnically Diverse Non-small-cell Lung Cancer Patients. EBioMedicine. 2015;2:1377–1385. doi: 10.1016/j.ebiom.2015.07.034. [DOI] [PMC free article] [PubMed] [Google Scholar]
- 43.Chen X, et al. A combination of Let-7d, Let-7g and Let-7i serves as a stable reference for normalization of serum microRNAs. PLoS One. 2013;8:e79652. doi: 10.1371/journal.pone.0079652. [DOI] [PMC free article] [PubMed] [Google Scholar]
- 44.Liu R, et al. A five-microRNA signature identified from genome-wide serum microRNA expression profiling serves as a fingerprint for gastric cancer diagnosis. Eur J Cancer. 2011;47:784–791. doi: 10.1016/j.ejca.2010.10.025. [DOI] [PubMed] [Google Scholar]
Associated Data
This section collects any data citations, data availability statements, or supplementary materials included in this article.