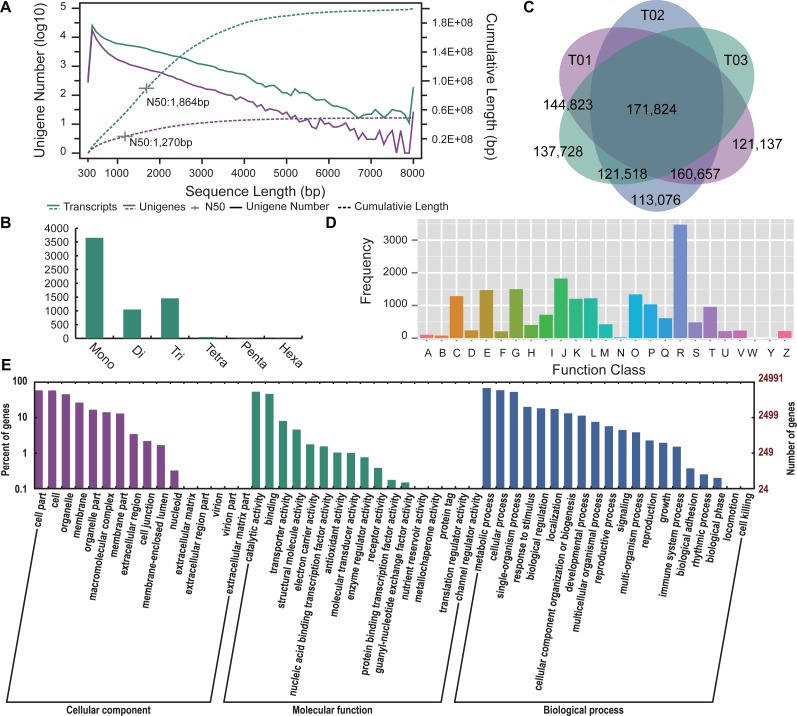
Figure 2. Assembly and annotation of the transcripts and unigenes of the Chinese goldthread.
(A) Distribution of transcripts and unigenes length. The left y-axis and solid lines are the distributions of number (log10-transformed) of assemblies in each 100-bp bin, while the right y-axis and dashed lines are the cumulative length curves for each assembly. (B) Number distribution of SSRs identified in unigenes (length ≥ 1 kb). Mono, Mono-nucleotide; Di, Di-nucleotide; Tri, Tri-nucleotide SSRs; Tetra, Tetra-nucleotide SSRs; Penta, Penta-nucleotide SSRs; Hexa, Hexa-nucleotide SSRs. (C) Venn diagrams illustrating SNPs either shared or unique to each accession (Zhenping , T01; Zunyi, T02; Shizhu, T03). (D) COG functional classification of unigenes. (E) GO functional classification of unigenes.

