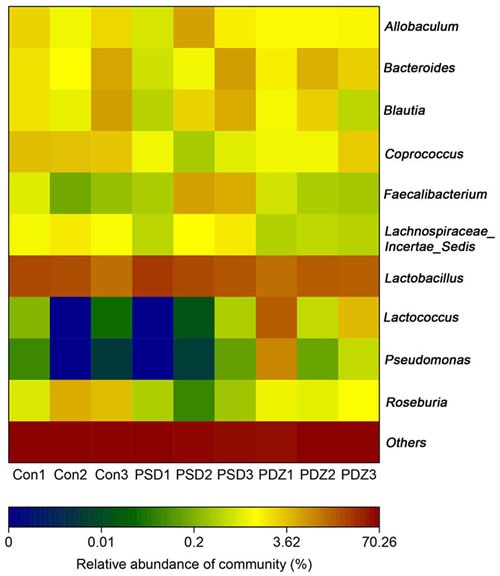
Figure 5. The heat map of 16S rRNA gene sequencing analysis of colonic mucosa at the genus level.

Heat map of the relative abundance of microbial species altered by PSDACD and ZBPYR treatment. Red colors indicate high values, whereas blue colors mean low values for the percent of reads classified at that rank.
