Abstract
Mass spectrometry has played a significant role in the identification of unknown phosphoproteins and sites of phosphorylation in biological samples. Analyses of protein phosphorylation, particularly large scale phosphoproteomic experiments, have recently been enhanced by efficient enrichment, fast and accurate instrumentation, and better software, but challenges remain because of the low stoichiometry of phosphorylation and poor phosphopeptide ionization efficiency and fragmentation due to neutral loss. Phosphoproteomics has become an important dimension in systems biology studies, and it is essential to have efficient analytical tools to cover a broad range of signaling events. To evaluate current mass spectrometric performance, we present here a novel method to estimate the efficiency of phosphopeptide identification by tandem mass spectrometry. Phosphopeptides were directly isolated from whole plant cell extracts, dephosphorylated, and then incubated with one of three purified kinases—Casein Kinase II, Mitogen-activated protein kinase 6, and SNF-related protein kinase 2.6—along with 16O4- and 18O4-ATP separately for in vitro kinase reactions. Phosphopeptides were enriched and analyzed by LC-MS. The phosphopeptide identification rate was estimated by comparing phosphopeptides identified by tandem mass spectrometry with phosphopeptide pairs generated by stable isotope labeled kinase reactions. Overall, we found that current high speed and high accuracy mass spectrometers can only identify 20–40% of total phosphopeptides primarily due to relatively poor fragmentation, additional modifications, and low abundance, highlighting the urgent need for continuous efforts to improve phosphopeptide identification efficiency.
Graphical abstract
Introduction
It is estimated that there are over 500 protein kinases in mammals and over 1000 in plants, and an estimated half or more of all proteins are phosphorylated at certain points during their lifespan [1, 2]. Reversible phosphorylation of proteins is involved in the regulation of most, if not all, cellular processes [3]. Abnormal phosphorylation has been implicated in a number of diseases, most notably cancer [4]. The accurate determination of sites of phosphorylation and dynamics of this modification in response to extracellular stimulation is important for elucidating complex disease mechanisms and global regulatory networks. Development of methods for analyzing phosphorylated proteins, therefore, has been an active field of research in the signaling, mass spectrometry, and proteomics communities.
Advances in mass spectrometry (MS)-based proteomics have driven increasing efforts to identify reliable approaches for the large scale analysis of phosphoproteins (phosphoproteomics) that include both the identification of protein phosphorylation sites and the quantification of changes in phosphorylation at individual sites [5]. Phosphorylation is often a low stoichiometric event [6]. To identify specific sites of phosphorylation, it is essential to have an efficient strategy for the selective enrichment of actual phosphopeptides. Current approaches include immobilized metal ion or metal oxide affinity chromatography (IMAC and MOAC) [7–10] and polymer-based metal ion affinity capture (polyMAC) for general phosphopeptide enrichment [11] and anti-phosphotyrosine antibodies for the isolation of phosphotyrosine-containing peptides [12]. High throughput analysis of phosphorylation using directed enrichment methods followed by mass spectrometry (MS) has become a standard approach for phosphoprotein detection.
While phosphoproteomics has increasingly become an important, typically more informative, dimension in omics studies, its challenges have persisted [13]. The primary challenge in examining protein phosphorylation is its low stoichiometry. Phosphorylated proteins, especially those involved in signaling, are often expressed in relatively low amounts in a cell, and few of these proteins exist in a phosphorylated form at any one time. Furthermore, phosphopeptides have low ionization efficiency due to their negatively charged phosphate groups [14], and they can exhibit poor fragmentation in tandem mass spectra due to neutral loss of the phosphate groups [15]. Finally, informatics approaches for processing the results of mass spectrometry data for phosphopeptides are not yet mature [16].
There have been a number of attempts to improve phosphopeptide identification efficiency, particularly by alternative activation methods [17]. Faster and more accurate LC-MS systems have also made a significant contribution toward enhancing the coverage of the phosphoproteome, but it is not still clear what percentage of the phosphopeptide population is routinely identified by tandem mass spectrometry (MS/MS) and whether current phosphoproteomic strategies provide true representations of the phosphoproteome for systems biology analyses. Due to the dynamic nature of phosphorylation, low coverage of the phosphoproteome at certain cellular states might lead to biased or even incorrect conclusions. Here, we present a novel strategy to estimate the efficiency of phosphopeptide identification by tandem mass spectrometry. Instead of using a large pool of synthetic phosphopeptides which is costly to generate [18] and still incomprehensive, we created a phosphopeptide pool directly from whole cell extracts. To generate phosphopeptides with distinctively recognizable features in the mass spectra, we introduced in vitro kinase reactions with 16O4- and 18O4-ATP to generate phosphopeptide pairs with similar intensity that are separated by 6 Da on mass spectra. Previous literature and our own data indicate that the 18O atoms on the γ-phosphoryl group do not exchange with water during kinase reactions [19]. Thus, the efficiency of phosphopeptide identification can be estimated by comparing the phosphopeptides identified by MS/MS with the total number of phosphopeptide pairs that demonstrate the distinctive mass shift.
Methods
Plant Materials and Growth
The seeds of Col-0 wild type Arabidopsis were geminated on half-strength Murashige and Skoog (MS) medium (1 % sucrose with 0.6% phytogel). Five days after germination, seedlings were transferred into 40 ml half-strength MS liquid medium with 1% sucrose at 22 °C in continuous light on a rotary shaker set at 100 rpm. For osmotic stress treatment, twelve-day-old seedlings were transferred into fresh medium containing 800 mM Mannitol for 30 min. In parallel, the seedlings transferred into fresh medium were used as the control.
Protein Extraction and Digestion
Plant tissues were ground with mortar and pestle in liquid nitrogen, and the ground tissues were lysed in 6 M guanidine hydrochloride containing 100 mM Tris-HCl (pH = 8.5) with EDTA-free protease inhibitor cocktail (Roche, Madison, WI) and phosphatase inhibitor cocktail (Sigma-Aldrich, St. Louis, MO). Proteins were reduced and alkylated with 10 mM tris-(2-carboxyethyl)phosphine (TECP) and 40 mM chloroacetamide (CAA) at 95 °C for 5 min. Alkylated proteins were subjected to methanol-chloroform precipitation, and precipitated protein pellets were solubilized in 8 M urea containing 50 mM triethylammonium bicarbonate (TEAB). Protein amount was quantified by BCA assay (Thermo Fisher Scientific, Rockford, IL). Protein extracts were diluted to 4 M urea and digested with Lys-C (Wako, Japan) in a 1:100 (w/w) enzyme-to-protein ratio overnight at 37 °C. Digests were acidified with 10% trifluoroacetic acid (TFA) to a pH ~2 and desalted using a 100 mg Sep-Pak C18 column (Waters, Milford, MA).
Stable Isotope Labeled In Vitro Kinase Reaction
The in vitro kinase reaction was performed based on previous reports [20, 21] with some modifications. The Lys-C digested peptides (200 μg) were treated with a thermosensitive alkaline phosphatase (TSAP) (Roche, Madison, WI) in a 1:100 (w/w) enzyme-to-peptide ratio at 37 °C overnight for dephosphorylation, and the dephosphorylated peptides were desalted using Sep-Pak C18 column. The desalted peptides were re-suspended in kinase reaction buffer (50 mM Tris-HCl, 10 mM MgCl2, and 1 mM DTT, pH 7.5) with either 1 mM 16O-ATP or γ-[18O4]-ATP (Cambridge Isotope Laboratories, MA). The suspended peptides were incubated with the recombinant SNF-related protein kinase 2.6 (SnRK2.6), Mitogen-activated protein kinase 6 (MPK6), or Casein Kinase II (CK2) (500 ng) at 30 °C overnight. The kinase reaction was quenched by acidifying with 10% TFA to a final concentration of 1%, and the peptides were desalted by Sep-Pak C18 column. The light and heavy phosphopeptides were mixed and further digested by trypsin at 37 °C for 6 h. Tryptic phosphopeptides were desalted by Sep-Pak column, and then were enriched by PolyMAC-Ti reagent, and the eluates were dried in a SpeedVac for LC-MS/MS analysis.
PolyMAC Enrichment
Phosphopeptide enrichment was performed according to the reported PolyMAC-Ti protocol [11] with some modifications. Tryptic peptides (200 μg) were re-suspended in 100 μL of loading buffer (80% acetonitrile (ACN) with 1% TFA) and incubated with 25 μL of the PolyMAC-Ti reagent for 20 min. A magnetic rack was used to collect the magnetic beads to the sides of the tubes, and the flow-through was discarded. The magnetic beads were washed with 200 μL of washing buffer 1 (80% ACN, 0.2% TFA with 25 mM glycolic acid) for 5 min and washing buffer 2 (80% ACN in water) for 30 seconds. Phosphopeptides were then eluted with 200 μL of 400 mM NH4OH with 50% ACN and dried in a SpeedVac.
LC-MS/MS Analysis
The phosphopeptides were dissolved in 5 μL of 0.3% formic acid (FA) with 3% ACN and injected into an Easy-nLC 1000 (Thermo Fisher Scientific). Peptides were separated on a 45 cm in-house packed column (360 μm OD × 75 μm ID) containing C18 resin (2.2 μm, 100Å, Michrom Bioresources) with a 30 cm column heater (Analytical Sales and Services) set at 50 °C. The mobile phase buffer consisted of 0.1% FA in ultra-pure water (buffer A) with an eluting buffer of 0.1% FA in 80% ACN (buffer B) run over a linear 60 min gradient of 5%–30% buffer B at a flow rate of 250 nL/min. The Easy-nLC 1000 was coupled online with a LTQ-Orbitrap Velos Pro mass spectrometer (Thermo Fisher Scientific). The mass spectrometer was operated in the data-dependent mode in which a full MS scan (from m/z 350–1500 with the resolution of 30,000 at m/z 400) was followed by the 5 most intense ions being subjected to collision-induced dissociation (CID) fragmentation. CID fragmentation was performed and acquired in the linear ion trap (normalized collision energy (NCE) 30%, AGC 3e4, max injection time 100 ms, isolation window 3 m/z, and dynamic exclusion 60 s).
Data Processing
The raw files were searched directly against the Arabidopsis thaliana database (TAIR10) with no redundant entries using MaxQuant software (version 1.5.4.1) [22] with the Andromeda search engine. Initial precursor mass tolerance was set at 20 ppm, the final tolerance was set at 6 ppm, and the ITMS MS/MS tolerance was set at 0.6 Da. Search criteria included a static carbamidomethylation of cysteines (+57.0214 Da) and variable modifications of (1) oxidation (+15.9949 Da) on methionine residues, (2) acetylation (+42.011 Da) at the N-terminus of proteins, (3) phosphorylation (+79.996 Da), and (4) heavy phosphorylation (+85.979 Da) on serine, threonine or tyrosine residues. The match between runs function was enabled with 1.0 min match time window. The searches were performed with trypsin digestion and allowed a maximum of two missed cleavages on the peptides analyzed from the sequence database. The false discovery rates for proteins, peptides and phosphosites were set at 0.01. The minimum peptide length was six amino acids, and a minimum Andromeda score cut-off was set at 40 for modified peptides. A site localization probability of 0.75 was used as the cut-off for localization of phosphorylation sites. The MS/MS spectra can be viewed through the MaxQuant viewer. For the ProteomeDiscoverer searches, the raw files were searched directly against the same Arabidopsis thaliana database (TAIR10) with no redundant entries using the SEQUEST HT algorithm in Proteome Discoverer version 2.1 (Thermo Fisher Scientific). Peptide precursor mass tolerance was set at 10 ppm, and MS/MS tolerance was set at 0.6 Da. Search criteria included a static carbamidomethylation of cysteines (+57.0214 Da) and variable modifications of (1) oxidation (+15.9949 Da) on methionine residues, (2) acetylation (+42.011 Da) on protein N-termini, (3) phosphorylation (+79.996 Da), and (4) heavy phosphorylation (+85.979 Da) on serine, threonine or tyrosine residues. Searches were performed with full tryptic digestion and allowed a maximum of two missed cleavages on the peptides analyzed from the sequence database. Relaxed and strict false discovery rates (FDR) were set to 0.05 and 0.01, respectively. All localized phosphorylation sites were submitted to Motif-X [23] to determine kinase phosphorylation motifs with the TAIR10 database as the background. The significance was set at 0.000001, the width was set at 13, and the number of occurrences was set at 20. The light and heavy phosphopeptide and peak pairs were identified through the LAXIC algorithm [24]. All of the light and heavy phosphopeptide and peak pairs are listed in the supplementary tables, and the raw data and analysis files for the proteomic analyses have been deposited to the ProteomeXchange Consortium (http://proteomecentral.proteomexchange.org) via the jPOST partner repository (http://jpost.org) [25] with the data set identifier PXD005079.
Results and Discussion
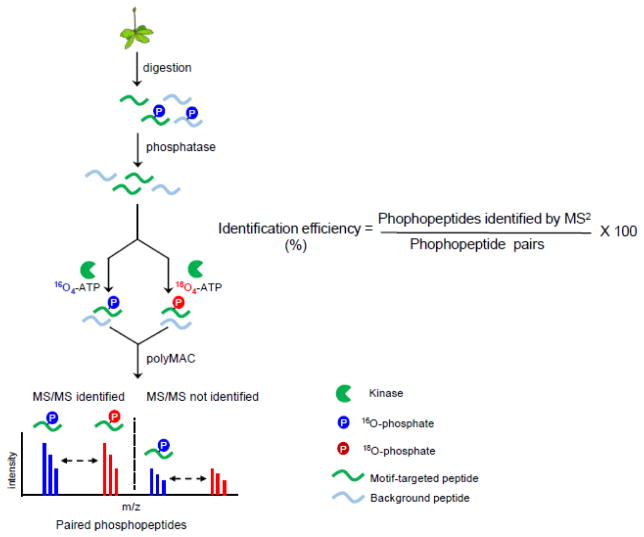
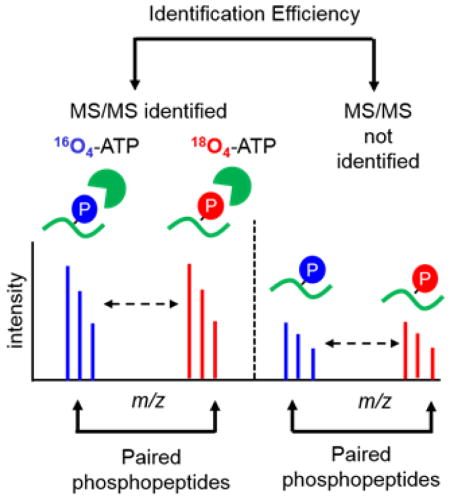
The strategy to estimate the efficiency of phosphopeptide identification was devised based on our previous phosphoproteomic studies on kinase substrates [20, 21]. The general strategy to estimate the efficiency of phosphopeptide identification by MS/MS is illustrated in Figure 1. To generate a comprehensive pool of phosphopeptides, proteins were extracted from whole cell lysates such as whole cell extracts from plants. After digestion with Lys-C to generate peptides, the peptides were incubated with a thermosensitive alkaline phosphatase overnight to remove phosphate groups on the peptides and to generate a pool of peptide candidates for the in vitro kinase reactions. We chose three kinases, casein kinase 2 (CK2), mitogen-activated protein kinase 6 (MPK6) and SNF-related protein kinase 2.6 (SnRK2.6), for their known high specificity toward acidic, proline-directed, and basic motifs, respectively. These three kinases also have high enzymatic activity in vitro and can potentially phosphorylate hundreds of substrates. The most important feature of this strategy is the generation of a large number of phosphopeptides that are invisible in MS/MS but have distinctive characteristics that can be unambiguously recognized even if their sequences are unknown. In doing so, we devised in vitro kinase reactions with γ-16O4- and γ-18O4-ATP in parallel. The kinase reaction transfers one or more γ-phosphate groups from ATP to substrate peptides, thus generating light- and heavy- phosphorylated peptides with similar intensities, assuming the same kinase has similar reactivity with γ-16O4- or γ-18O4-ATP. After the kinase reactions, samples were pooled together, and phosphopeptides were enriched with PolyMAC before LC-MS analyses. Data were searched against the appropriate protein database for sequence information. In-house LAXIC software was used to pick and quantify peptide pairs with the required characteristic features [24]. Finally, the efficiency of phosphopeptide identification can be estimated by comparing the phosphopeptides identified by MS/MS with the total number of phosphopeptide pairs.
Figure 1.
The workflow to estimate efficiency of phosphopeptide identification by tandem mass spectrometry. The ratio of phosphopeptides identified by MS/MS over total paired phosphopeptides identified in single-stage MS represents the phosphopeptide identification efficiency. See main text for details.
We generated whole cell lysates from Arabidopsis seedlings in this study. The plant has over 1000 encoded kinases, and whole cell lysates likely contain tens of thousands of phosphorylation sites[2, 26]. Two plant kinases, MAPK6 and SnRK2.6, were recombinantly expressed and purified. Along with human recombinant CK2, the three kinases were incubated with Arabidopsis lysate and γ-16O4- or γ-18O4-ATP separately. Each kinase reaction can generate hundreds of phosphopeptides, which is sufficient for this study but still well within the capacity of a typical high resolution LC-MS system today. This strategy also minimizes the instrumentation factor. While it is conceivable that the speed of mass spectrometers affects the identification rate of phosphopeptides, this factor would be minor with the current approach.
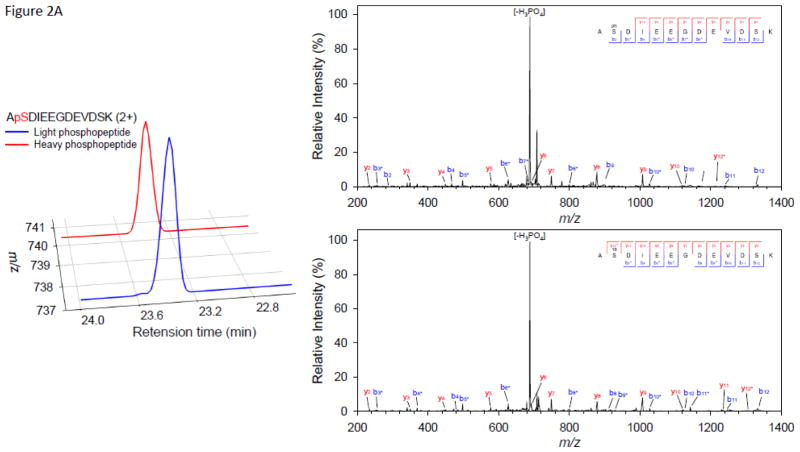
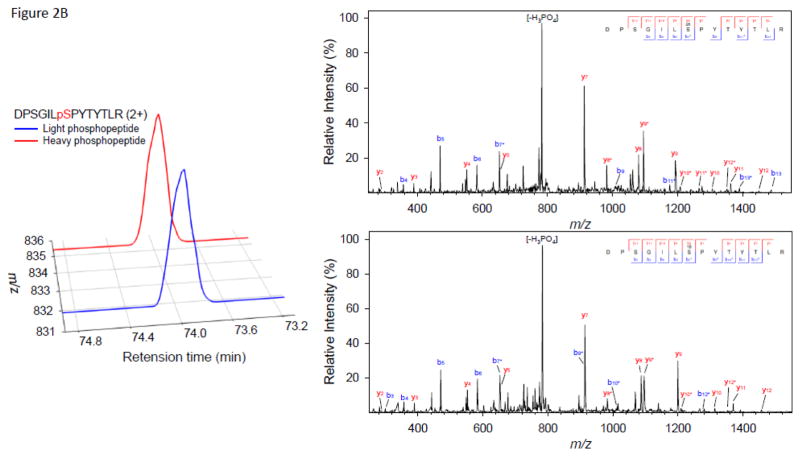
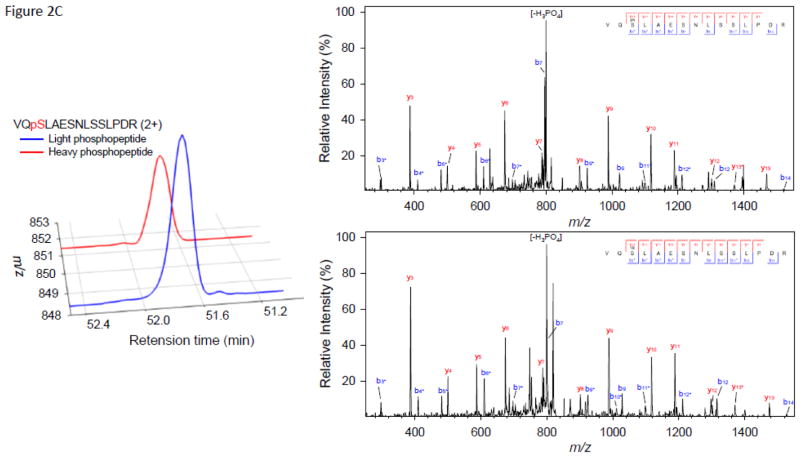
As anticipated, we observed multiple peak doublets in the mass spectra. With a high speed mass spectrometer such as the Orbitrap Velos, most of these precursor ions were selected for MS/MS. Figure 2 illustrates examples of three peptides phosphorylated by CK2, MPK6, or SnRK2.6, respectively. The extracted ion chromatogram (XIC) and MS/MS spectra of the paired light/heavy NUP50 phosphopeptide ApSDIEEGDEVDSK are shown in Figure 2A. The peptide was phosphorylated by CK2, and the doubly-charged, heavy phosphate-labeled phosphopeptide (red line) has a 3.00 m/z shift from the doubly-charged, light phosphate-labeled phosphopetide (blue line). No significant retention time shift was observed as a result of heavy phosphate labeling. The MS/MS spectrum shows the identification of paired light/heavy phosphopeptide with the expected acidic phosphorylation motif. Similarly, the XIC and MS/MS spectra of the paired light/heavy CAD5 phosphopeptide DPSGILpSPYTYTLR phosphorylated by MPK6 are shown in Figure 2B. The phosphopeptide sequence has the characteristic proline-directed phosphorylation motif; Figure 2C shows the XIC and MS/MS spectra of the paired light/heavy AT5G05600 phosphopeptide VQpSLAESNLSSLPDR phosphorylated by SnRK2.6. The MS/MS spectra shows the identification of paired light/heavy phosphopeptide with the basic phosphorylation motif [-I-x-R-x-x-pS-]. Although the examples provided in Figure 2 show that the light- and heavy-labeled phosphopeptide pairs have similar intensity and were sequenced by MS/MS, not all phosphopeptide pairs have similar intensity. In many cases, the light-labeled phosphopeptide has higher intensity than its heavy-labeled counterpart (see supplementary table S1–S3). The exact cause is not clear. While we expected similar kinase reactivity with light or heavy ATP, it is possible that γ-18O4-ATP has a bigger size which might prevent it from fitting inside the ATP binding pocket perfectly. We will investigate this phenomenon in a separate study. All doublet peaks with appropriate mass difference and similar intensity were deconvoluted and counted as phosphopeptides, no matter whether they were sequenced by MS/MS or not.
Figure 2.
Selected examples of extracted ion chromatogram and MS/MS spectra of motif-targeted paired phosphopeptides from three in vitro kinase reactions. (A) NUP50 phosphopeptide ApSDIEEGDEVDSK phosphorylated by CK2. (B) CAD5 phosphopeptide DPSGILpSPYTYTLR phosphorylated by MPK6. (C) AT5G05600 phosphopeptide VQpSLAESNLSSLPDR phosphorylated by SnRK2.6.
Six in vitro kinase reactions, the result of three kinases with light and heavy ATP separately, generated thousands of phosphopeptides in vitro. We searched MS/MS spectra against the Arabidopsis proteome database. In total, 1498, 1472, and 1837 doublet phosphopeptides were identified by CK2, MPK6, and SnRK2.6, respectively. The data indicates high, specific in vitro kinase activity for all three kinases. Motif analyses of the identified phosphopeptides resulted in the acidic motif for the CK2 kinase reaction, [-(pS/pT)-(D/E)-x-(D/E)-], the proline-directed phosphorylation motif for MPK6, [-(pS/pT)-P-], and the basic phosphorylation motif for SnRK2.6, [-(I/L)-x-R-x-x-(pS/pT)-] (Figure 3). The results from these motif analyses are highly consistent with previous literature reports and known substrate specificity of the three kinases [27–29].
Figure 3.
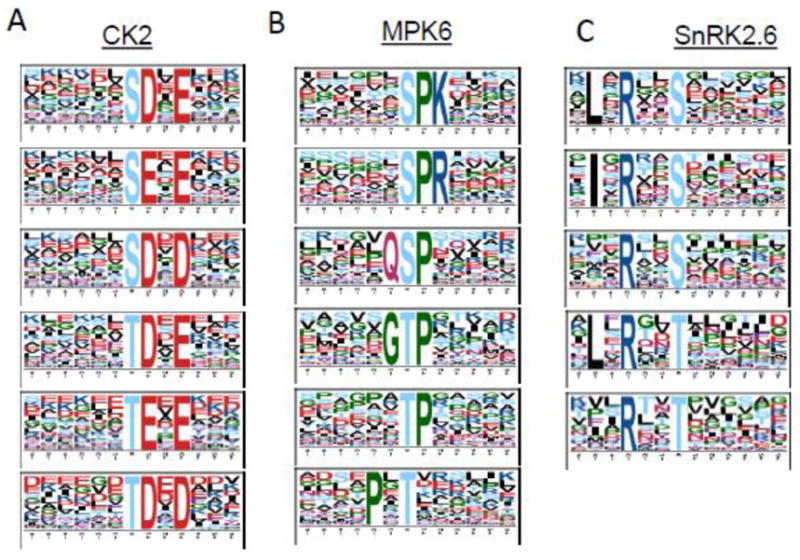
Motif analysis of identified light/heavy phosphopeptides. The phosphorylation motifs of identified light/heavy phosphopeptides were extracted by Motif-X from (A) CK2, (B) MPK6, and (C) SnRK2.6 kinase reactions.
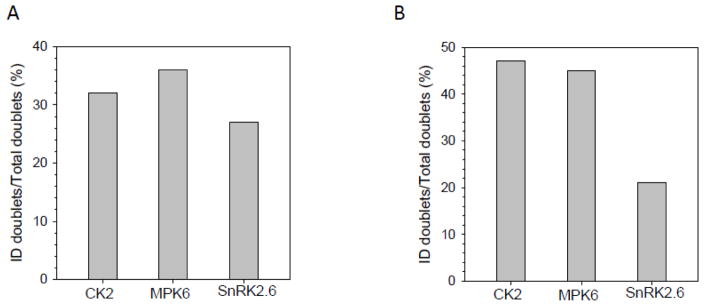
The advancement of high speed and high accuracy mass spectrometers, along with ultra high performance liquid chromatography (UHPLC), has greatly improved the coverage of phosphoproteomes. However, considering the high dynamics of protein phosphorylation, it is not clear whether current LC-MS technology can provide sufficient coverage of most phosphoroteomes. In our phosphopeptide samples prepared before LC-MS analyses, virtually all phosphopeptides were generated from in vitro kinase reactions. Assuming similar reactivity with light- or heavy-ATP, we expected to observe all phosphopeptides in doublets with similar intensities. We applied our in-house software LAXIC [24] to identify all peaks pairs that were separated by 16O and 18O phosphoral groups with similar intensities, and we calculated the successful phosphopeptide identification rate through three steps. First, the light and heavy peak pairs were identified from MS scans through two criteria: (1) the mass difference of 6 Da between the two peaks, and (2) the peaks were detected in the same full MS scan. Next, the light/heavy phosphopeptide pairs were selected from light and heavy phosphopeptides identified through MS/MS which fit the two criteria we mentioned above. Finally, the successful phosphopeptide identification rate was acquired via the ratio of the identified light/heavy phosphopeptide pairs over the identified light/heavy peak pairs. In total, we identified 4752, 4053, and 6749 pairs in samples related to the kinase reactions of CK2, MPK6, and SnRK2.6, respectively (Supplementary Table S1–S3), that meet the criteria. Accordingly, we calculated the efficiency of phosphopeptide identification (Table 1 and Figure 4) by comparing the number of phosphopeptides identified by MS2 (Supplementary Table S4–S9) against the number of phosphopeptide peak pairs in the MS spectra. The percentages of successful phosphopeptide identification are 31%, 36%, and 27% for CK2, MPK6, and SnRK2.6, respectively. On average, only about 30% of phosphopeptides were identified by our current LC-MS instrument.
Table 1.
Number of phosphopeptide pairs in MS spectra and phosphopeptides identified by MS2. MQ is MaxQuant and PD is Proteome Discover.
| Kinase | Doublet | Doublet-MQ | Doublet-PD |
|---|---|---|---|
| CK2 | 4752 | 1498 | 2213 |
| MPK6 | 4053 | 1472 | 1816 |
| SnRK2.6 | 6749 | 1837 | 1405 |
Figure 4.
Comparison of phosphopeptide identification efficiencies between kinase reactions and search engines. The percentages of identification efficiency from (A) MaxQuant and (B) Sequest search engines were calculated by dividing phosphopeptides identified by MS/MS over total phosphopeptide pairs.
We also examined the effect of different search algorithms. Besides MaxQuant, we also searched the MS/MS spectra using Proteome Discoverer 2.1. MaxQuant is based on Andromeda while Proteome Discoverer uses Sequest HT as the search engine. Overall, with the same FDR cutoff value (FDR <1%), there are some obvious difference in the number of phosphopeptides identified by Andromeda (MaxQuant) or Sequest HT (Proteome Discoverer), but the efficiency of phosphopeptide identification is within a similar range (Table 1 and Figure 4).
There are multiple factors that may contribute to the relatively low efficiency of phosphopeptide identification (~30%). One obvious possibility is poor fragmentation of phosphopeptides in MS2 spectra. We generated two plots to show the proportion and number of phosphopeptide doublets versus cut-off value (Figure 5A and 5B). The plots are quite informative. The maximum proportion of phosphopeptide doublets subjected to MS/MS is around 60%, indicating that 40% of the phosphopeptide doublets were not selected for MS/MS in our study. These phosphopeptide doublets that were not selected for MS/MS are likely of low abundance. When phosphopeptide abundance is low enough, the isotope pattern cannot be identified, and monoisotopic peaks cannot be recognized for MS/MS. Among the 60% of phosphopeptide pairs that were selected for MS/MS, the phosphopeptides in MPK6’s samples have the highest identification efficiency. This is consistent with previous data that indicates proline-containing peptides have a high degree of peptide backbone fragment [30], which may facilitate identification, and the fact that most of MPK6’s substrate peptides have the [(-pS/pT)-P-] motif. Moreover, other reasons such as additional modifications on the phosphopeptides [31] or variant isoforms not listed in the database may contribute to the high percentage of unassigned spectra.
Figure 5.
(A) Proportion of phosphopeptide doublets versus cut-off value; (B) Number of phosphopeptide doublets versus cut-off value.
Conclusion
Large scale analysis of protein phosphorylation, or phosphoproteomics, has become an important component of systems biology studies. While the advances of mass spectrometers in speed and accuracy, along with the introduction of ultra high performance liquid chromatograph, have greatly improved phosphoproteome coverage, it is critical to evaluate whether the phosphoproteomic data is comprehensive, especially considering that protein phosphorylation is highly dynamic. We have presented a novel method to estimate the efficiency of phosphopeptide identification by generating a large pool of phosphopeptides through direct isolation from cell lysates and in vitro kinase reactions. These phosphopeptides can be recognized according to specific features, though they may or may not be isolated for MS/MS. Examination of MS/MS data and MS features indicates that, on average, 30% of phosphopeptides were identified by MS/MS. Poor fragmentation and low abundance contribute to 70% of the phosphopeptides not being identified by MS/MS. This study highlights the need for additional efforts to increase the yield of phosphopeptides for MS analyses, possibly through better sample preparation, phosphopeptide enrichment, and LC resolution, and to further improve phosphopeptide fragmentation through alternative methods.
Supplementary Material
Acknowledgments
This study was partially supported by NIH grants 1R01GM111788 and 5R01GM088317 and NSF grant 1506752.
Footnotes
Dedicated to Prof. R. Graham Cooks’ achievements and his life-long devotion to nothing but mass spectrometry
References
- 1.Manning G, Whyte DB, Martinez R, Hunter T, Sudarsanam S. The protein kinase complement of the human genome. Science. 2002;298:1912. doi: 10.1126/science.1075762. [DOI] [PubMed] [Google Scholar]
- 2.Schulze WX. Proteomics approaches to understand protein phosphorylation in pathway modulation. Curr Opin Plant Biol. 2010;13:280–287. doi: 10.1016/j.pbi.2009.12.008. [DOI] [PubMed] [Google Scholar]
- 3.Cohen P. The origins of protein phosphorylation. Nat Cell Biol. 2002;4:E127–E130. doi: 10.1038/ncb0502-e127. [DOI] [PubMed] [Google Scholar]
- 4.Hunter T. Signaling - 2000 and beyond. Cell. 2000;100:113–127. doi: 10.1016/s0092-8674(00)81688-8. [DOI] [PubMed] [Google Scholar]
- 5.Dephoure N, Zhou C, Villen J, Beausoleil SA, Bakalarski CE, Elledge SJ, et al. A quantitative atlas of mitotic phosphorylation. P Natl Acad Sci USA. 2008;105:10762–10767. doi: 10.1073/pnas.0805139105. [DOI] [PMC free article] [PubMed] [Google Scholar]
- 6.Mann M, Ong SE, Gronborg M, Steen H, Jensen ON, Pandey A. Analysis of protein phosphorylation using mass spectrometry: deciphering the phosphoproteome. Trends Biotechnol. 2002;20:261–268. doi: 10.1016/s0167-7799(02)01944-3. [DOI] [PubMed] [Google Scholar]
- 7.Stensballe A, Andersen S, Jensen ON. Characterization of phosphoproteins from electrophoretic gels by nanoscale Fe(III) affinity chromatography with off-line mass spectrometry analysis. Proteomics. 2001;1:207–222. doi: 10.1002/1615-9861(200102)1:2<207::AID-PROT207>3.0.CO;2-3. [DOI] [PubMed] [Google Scholar]
- 8.Tsai CF, Hsu CC, Hung JN, Wang YT, Choong WK, Zeng MY, et al. Sequential Phosphoproteomic Enrichment through Complementary Metal-Directed Immobilized Metal Ion Affinity Chromatography. Anal Chem. 2014;86:685–693. doi: 10.1021/ac4031175. [DOI] [PubMed] [Google Scholar]
- 9.Larsen MR, Thingholm TE, Jensen ON, Roepstorff P, Jorgensen TJD. Highly selective enrichment of phosphorylated peptides from peptide mixtures using titanium dioxide microcolumns. Molecular & Cellular Proteomics. 2005;4:873–886. doi: 10.1074/mcp.T500007-MCP200. [DOI] [PubMed] [Google Scholar]
- 10.Sugiyama N, Masuda T, Shinoda K, Nakamura A, Tomita M, Ishihama Y. Phosphopeptide enrichment by aliphatic hydroxy acid-modified metal oxide chromatography for nano-LC-MS/MS in proteomics applications. Molecular & Cellular Proteomics. 2007;6:1103–1109. doi: 10.1074/mcp.T600060-MCP200. [DOI] [PubMed] [Google Scholar]
- 11.Iliuk AB, Martin VA, Alicie BM, Geahlen RL, Tao WA. In-depth analyses of kinase-dependent tyrosine phosphoproteomes based on metal ion-functionalized soluble nanopolymers. Mol Cell Proteomics. 2010;9:2162–2172. doi: 10.1074/mcp.M110.000091. [DOI] [PMC free article] [PubMed] [Google Scholar]
- 12.Rush J, Moritz A, Lee KA, Guo A, Goss VL, Spek EJ, et al. Immunoaffinity profiling of tyrosine phosphorylation in cancer cells. Nature Biotechnology. 2005;23:94–101. doi: 10.1038/nbt1046. [DOI] [PubMed] [Google Scholar]
- 13.Engholm-Keller K, Larsen MR. Technologies and challenges in large-scale phosphoproteomics. Proteomics. 2013;13:910–931. doi: 10.1002/pmic.201200484. [DOI] [PubMed] [Google Scholar]
- 14.Winter D, Seidler J, Ziv Y, Shiloh Y, Lehmann WD. Citrate boosts the performance of phosphopeptide analysis by UPLC-ESI-MS/MS. J Proteome Res. 2009;8:418–424. doi: 10.1021/pr800304n. [DOI] [PubMed] [Google Scholar]
- 15.Leitner A, Foettinger A, Lindner W. Improving fragmentation of poorly fragmenting peptides and phosphopeptides during collision-induced dissociation by malondialdehyde modification of arginine residues. Journal of mass spectrometry: JMS. 2007;42:950–959. doi: 10.1002/jms.1233. [DOI] [PubMed] [Google Scholar]
- 16.Iliuk AB, Arrington JV, Tao WA. Analytical challenges translating mass spectrometry-based phosphoproteomics from discovery to clinical applications. Electrophoresis. 2014;35:3430–3440. doi: 10.1002/elps.201400153. [DOI] [PMC free article] [PubMed] [Google Scholar]
- 17.Boersema PJ, Mohammed S, Heck AJ. Phosphopeptide fragmentation and analysis by mass spectrometry. J Mass Spectrom. 2009;44:861–878. doi: 10.1002/jms.1599. [DOI] [PubMed] [Google Scholar]
- 18.Marx H, Lemeer S, Schliep JE, Matheron L, Mohammed S, Cox J, et al. A large synthetic peptide and phosphopeptide reference library for mass spectrometry-based proteomics. Nature biotechnology. 2013;31:557–564. doi: 10.1038/nbt.2585. [DOI] [PubMed] [Google Scholar]
- 19.Zhou M, Meng Z, Jobson AG, Pommier Y, Veenstra TD. Detection of in vitro kinase generated protein phosphorylation sites using gamma[18O4]-ATP and mass spectrometry. Anal Chem. 2007;79:7603–7610. doi: 10.1021/ac071584r. [DOI] [PubMed] [Google Scholar]
- 20.Xue L, Wang WH, Iliuk A, Hu LH, Galan JA, Yu S, et al. Sensitive kinase assay linked with phosphoproteomics for identifying direct kinase substrates. P Natl Acad Sci USA. 2012;109:5615–5620. doi: 10.1073/pnas.1119418109. [DOI] [PMC free article] [PubMed] [Google Scholar]
- 21.Xue L, Wang P, Cao P, Zhu JK, Tao WA. Identification of extracellular signal-regulated kinase 1 (ERK1) direct substrates using stable isotope labeled kinase assay-linked phosphoproteomics. Mol Cell Proteomics. 2014;13:3199–3210. doi: 10.1074/mcp.O114.038588. [DOI] [PMC free article] [PubMed] [Google Scholar]
- 22.Cox J, Mann M. MaxQuant enables high peptide identification rates, individualized p.p.b.-range mass accuracies and proteome-wide protein quantification. Nature Biotechnology. 2008;26:1367–1372. doi: 10.1038/nbt.1511. [DOI] [PubMed] [Google Scholar]
- 23.Schwartz D, Gygi SP. An iterative statistical approach to the identification of protein phosphorylation motifs from large-scale data sets. Nat Biotechnol. 2005;23:1391–1398. doi: 10.1038/nbt1146. [DOI] [PubMed] [Google Scholar]
- 24.Xue L, Wang P, Wang L, Renzi E, Radivojac P, Tang H, et al. Quantitative measurement of phosphoproteome response to osmotic stress in arabidopsis based on Library-Assisted eXtracted Ion Chromatogram (LAXIC) Mol Cell Proteomics. 2013;12:2354–2369. doi: 10.1074/mcp.O113.027284. [DOI] [PMC free article] [PubMed] [Google Scholar]
- 25.Okuda S, Watanabe Y, Moriya Y, Kawano S, Yamamoto T, Matsumoto M, et al. jPOSTrepo: an international standard data repository for proteomes. Nucleic Acids Res. 2016 doi: 10.1093/nar/gkw1080. [DOI] [PMC free article] [PubMed] [Google Scholar]
- 26.Marx H, Minogue CE, Jayaraman D, Richards AL, Kwiecien NW, Siahpirani AF, et al. A proteomic atlas of the legume Medicago truncatula and its nitrogen-fixing endosymbiont Sinorhizobium meliloti. Nat Biotechnol. 2016;34:1198–1205. doi: 10.1038/nbt.3681. [DOI] [PMC free article] [PubMed] [Google Scholar]
- 27.Tsai CF, Wang YT, Yen HY, Tsou CC, Ku WC, Lin PY, et al. Large-scale determination of absolute phosphorylation stoichiometries in human cells by motif-targeting quantitative proteomics. Nat Commun. 2015;6 doi: 10.1038/ncomms7622. [DOI] [PMC free article] [PubMed] [Google Scholar]
- 28.Umezawa T, Sugiyama N, Takahashi F, Anderson JC, Ishihama Y, Peck SC, et al. Genetics and Phosphoproteomics Reveal a Protein Phosphorylation Network in the Abscisic Acid Signaling Pathway in Arabidopsis thaliana. Sci Signal. 2013:6. doi: 10.1126/scisignal.2003509. [DOI] [PubMed] [Google Scholar]
- 29.Wang PC, Xue L, Batelli G, Lee S, Hou YJ, Van Oosten MJ, et al. Quantitative phosphoproteomics identifies SnRK2 protein kinase substrates and reveals the effectors of abscisic acid action. P Natl Acad Sci USA. 2013;110:11205–11210. doi: 10.1073/pnas.1308974110. [DOI] [PMC free article] [PubMed] [Google Scholar]
- 30.Bleiholder C, Suhai S, Harrison AG, Paizs B. Towards understanding the tandem mass spectra of protonated oligopeptides. 2: The proline effect in collision-induced dissociation of protonated Ala-Ala-Xxx-Pro-Ala (Xxx = Ala, Ser, Leu, Val, Phe, and Trp) J Am Soc Mass Spectrom. 2011;22:1032–1039. doi: 10.1007/s13361-011-0092-1. [DOI] [PubMed] [Google Scholar]
- 31.Chick JM, Kolippakkam D, Nusinow DP, Zhai B, Rad R, Huttlin EL, et al. A mass-tolerant database search identifies a large proportion of unassigned spectra in shotgun proteomics as modified peptides. Nat Biotechnol. 2015;33:743–749. doi: 10.1038/nbt.3267. [DOI] [PMC free article] [PubMed] [Google Scholar]
Associated Data
This section collects any data citations, data availability statements, or supplementary materials included in this article.


