Abstract
Lipid A molecules consist of a diglucosamine sugar core with a number of appended acyl chains which vary in their length and connectivity. Because of the challenging nature of characterizing these molecules and differentiating between isomeric species, an energy-resolved MS/MS strategy was undertaken to track the fragmentation trends and map genealogies of product ions originating from consecutive cleavages of acyl chains. Generalizations were developed based on the number and locations of the primary and secondary acyl chains as well as variations in preferential cleavages arising from the location of the phosphate groups. Secondary acyl chain cleavage occurs most readily for lipid A species at the 3′ position, followed by primary acyl chain fragmentation at both the 3′ and 3 positions. In the instances of bisphosphorylated lipid A variants, phosphate loss occurs readily in conjunction with the most favorable primary and secondary acyl chain cleavages.
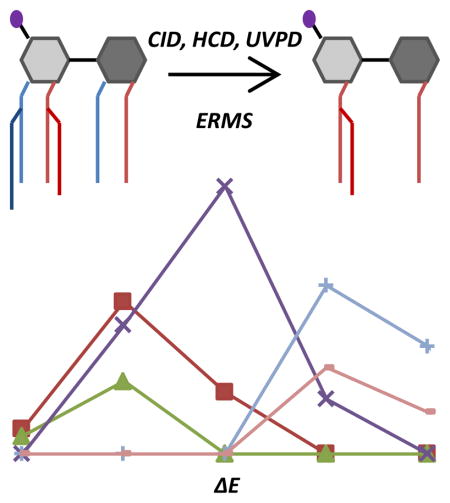
Graphical Abstract
Introduction
Gram-negative bacteria are responsible for a variety of food-borne illnesses, respiratory and urinary tract infections, sexually transmitted infections, and highly aggressive immune responses which can be fatal if proper treatment is unavailable [1–4]. The outer membrane of Gram-negative organisms contains a structurally complex lipopolysaccharide (LPS) responsible for many of their toxic properties [5, 6]. LPS is structurally organized into three unique, covalently linked regions which extend from the surface of the bacterial membrane [7]. At the exterior is a highly variable polyglycan O-antigen region, connected to a non-repeating saccharide core, followed by a hydrophobic domain known as lipid A, which is responsible for fastening LPS to the membrane surface [8, 9]. Structural changes in the lipid A domain impact both the ability of the mammalian innate immune system to recognize LPS and play an important role in resistance to key antibiotics (e.g. polymyxins).
The sugar backbone of lipid A is highly conserved in most bacteria, comprised of two pyranosidic hexosamine residues as β(1′,6)-linked glucosamine dimers. Branching from this central motif are a series of highly variable (R)-3-hydroxy acyl groups linked at the O-3′, N-2′, O-3 or N-2 positions by ester or amide bonds [10]. Owing to random mutations along with certain modulating environmental factors, the length and number of acyl chains extending from the sugar backbone of lipid A varies across bacterial species and in response to environmental stress [11]. One or two phosphates are usually found at the 1′ and 4′ carbon positions of the diglucosamine backbone, occasionally with variable substituents including sugars and phosphoethanolamine groups, the latter which reduces the anionic character of the lipid and impacts resistance to interaction with cationic antimicrobial peptides [12]. One example of this structural variability is found in the lipid A of P. aeruginosa isolated from the airways of cystic fibrosis patients [13,14]. The lipid A present in the clinical isolates incorporated both a palmitate moiety and an aminoarabinose sugar and retained a C10 fatty acid, modifications specific for P. aeruginosa cystic fibrosis isolates. This finding suggested unique adaptation of the bacterium in a way that may contribute to antimicrobial resistance [13,14]. Currently, our understanding of the structural changes of lipid A and the way in which they help impart antibiotic resistance and recognition failure by the immune system is limited. As a result, it is imperative that efficient and reliable methods be developed to improve analysis of the diverse structures of lipid A and LPS.
Currently, most mass spectrometry-based lipid analyses rely on MS/MS in order to generate fragmentation profiles for structural characterization. Collision induced dissociation (CID) and high-energy collisional dissociation (HCD) have been particularly useful in generating fragment libraries necessary for accurate profiling of different lipid A variants [13–23]. An alternative to collision-based methods for ion activation/fragmentation is ultraviolet photodissociation (UVPD) [24–26]. As shown previously, UVPD results in structure-specific glycosidic and cross-ring fragments of lipid A and affords richer fragmentation patterns when compared to conventional collisional activation methods [27–35]. Multi-stage MSn strategies have also been important for structural characterization of lipid A [36–38]. Recent work by the Goodlett group successfully determined the structures of various lipid A using an automated hierarchical tandem MS algorithm known as HitMS [37, 38]. This profiling method interrogated diagnostic fragment ions and neutral losses across MSn events by aligning each fragment (based on m/z value) with its most probable structure. In order to overcome some of the experimental and data processing obstacles encountered in current lipid A studies, our group recently demonstrated a hierarchical method, UVliPiD, for identification of acyl chain linkages in bisphosphoryl lipid A structures [39]. Following fragmentation of lipid A by an initial stage of UVPD, the resulting charge-reduced photodetachment products were subjected to secondary activation using CID without isolation of specific intermediates. The rather naïve guesswork of this decision-based approach spurred our interest in refining the method by incorporating specific predictive rules based on monitoring the fragmentation pathways as a function of energy deposition. We envisioned that a combination of MSn and energy-variable MS/MS strategies, ideally coupled with powerful algorithms like HitMS, could further facilitate characterization of lipid A and assignment of structures.
In recent years, energy-resolved mass spectrometry (ERMS) has proved to be a valuable technique for mapping complex oligosaccharides and other biopolymers based on trends in fragmentation relative to internal energy deposited during the activation event [36, 37]. Even for molecules that generate the identical sets of fragment ions upon MS/MS, ERMS may allow an opportunity to differentiate isomers based on variations in the fragmentation trends as a function of energy. Here we use energy-variable HCD, CID, and UVPD and selected MSn experiments to compare the preferred fragmentation pathways and map the genealogies of fragmentation of a series of lipid A molecules. This effort is aimed at developing rules for predicting lipid A fragmentation patterns and to facilitate development of fragment ion assignment algorithms. As shown in the study, HCD proved to be particularly useful for tracking secondary or consecutive fragmentation routes. Further, changes in phosphorylation appeared to cause predictable variations in specific dissociation events.
Experimental
Synthetic monophosphoryl lipid A (lAA), synthetic monophosphoryl 3-deacyl lipid A (lAC), and detoxified monophosphoryl lipid A from Salmonella minnesota R595 (lAB) were purchased from Avanti Polar Lipids (Alabaster, AL) and used without further purification. E. coli bisphosphorylated lipid A (lAG) was purchased from Sigma-Aldrich (St. Louis, MO) and also used without further purification. Additionally, lipid A variants were isolated and purified from E. coli expressing LpxJ from C. jejuni (lAJ and 1AI), from Acinetobacter baumannii (lAF), from W. succinogenes (lAH), and from E. coli strain BN2 (lAD and lAE), as described previously [32, 38, 39]. HPLC grade chloroform, methanol, and water used during sample preparation were purchased from EMD Millipore (Billerica, MA). Manual determination of fragment ions was accomplished using the ChemDraw software suite (Perkin Elmer, Waltham, MA).
All lipid A samples used in this study were dissolved in 74:23:3 chloroform:methanol:water with final concentrations of 10 μM followed by analysis using both a Thermo Scientific Velos Pro dual linear ion trap and a Thermo Scientific Orbitrap Fusion mass spectrometer (San Jose, CA). Both mass spectrometers were equipped with a 193 nm excimer laser (Coherent, Santa Clara, CA) to perform photodissociation, as previously described [27, 44]. Static emitters were used to transport lipid A molecules into the gas phase via a 1.5 mm o.d. glass capillary pulled to a tip of less than 1 μm by a Sutter Instrument P2000 laser puller (Novato, CA). Solutions of the lipid A molecules were loaded into the pulled glass capillary and a platinum wire was inserted, generating ions when a potential of 1000–1500 V was applied to the wire. All experiments were conducted in the negative ion mode, and CID, HCD, and UVPD were manually stepped to generate ERMS plots for the MS2 spectra. CID and HCD were stepped from NCE 0–50 in increments of 5 NCE, and UVPD was stepped in both energy (0–4 mJ, in 0.5 mJ increments) and pulses (1–9 pulses, in 2 pulse increments). For high resolution data collection on the Orbitrap Fusion mass spectrometer, a resolution of 120 K and a signal-to-noise threshold of 3 was used in analyzing the deconvoluted data in Xtract.
Results and Discussion
ESI of lipid A species resulted in production of singly or doubly deprotonated species depending on whether the lipid A possessed one or two phosphate groups. HCD and UVPD were used to characterize the deprotonated species in an energy variable manner to obtain information about the dominant fragmentation pathways and their genealogies. ERMS plots were generated via variation of the collision energy for HCD or the number of laser pulses for UVPD. The ERMS plots give insight into the variations in fragment ion distributions as a function of energy deposition, thus providing a convenient way to track the conversion of primary fragment ions into secondary fragment ions and reveal the relative labilities of the acyl chains and the sequential order in which they are lost. For the results shown, fragmentation nomenclature from Domon and Costello [45] and Morrison et al. [39] is adopted. All lipid A variants used in this study are shown in Figure S1 and listed with their monoisotopic masses and abbreviations used henceforth.
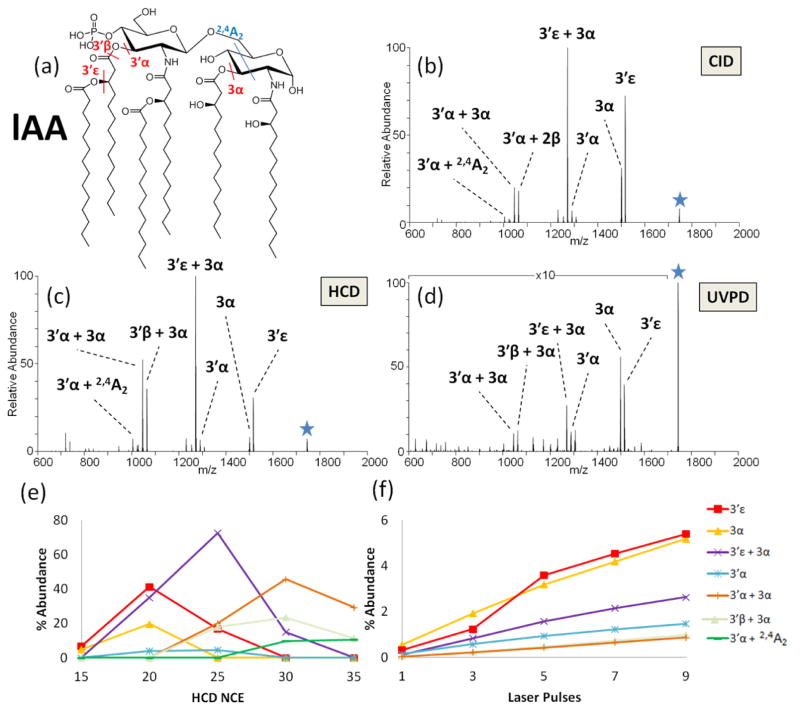
As a representative example, lAA was analyzed via CID, HCD, and UVPD in an energy-variable method. The phosphate moiety is located on the non-reducing glucosamine, and this lipid A contains four primary acyl chains (at the 3′, 2′, 3, and 2 positions) as well as two secondary acyl chains of equal length located at the 3′- and 2′-positions (Figure 1a). The corresponding CID, HCD, and UVPD spectra are shown in Figure 1b, 1c, and 1d, respectively, and the companion energy-variable curves are shown in Figure S2 (CID), 1e (HCD), and 1f (UVPD). The most dominant fragment ions resulted from losses of primary and secondary acyl chains at the 3′α, 3′ε, 3α, and 3′β positions (all of which are labelled on the structure in Figure 1a). There was also one cross-ring cleavage (2,4A2) that occurred on the reducing sugar. The MS/MS spectra revealed that the various acyl chains were cleaved individually (cleavage at 3′ε, 3α or 3′α) or as paired combinations (cleavage at 3′ε with 3α; or loss of 3α with 3′α or 3′β or 3′ε; or loss of 3′α with 3α or with cross-ring cleavage 2,4A2). For HCD, the 3′ε and 3α cleavages were observed at the lowest onset energies. As the HCD energy was increased, the primary fragments originating from these cleavages were depleted, and new secondary fragment ions appeared, including ones attributed to cleavages of 3′ε + 3α and 3′α + 3α. The cleavage of the 3′α chain appeared at 20 NCE, along with secondary products due to sequential cleavages: 3′α + 3α and 3′α + 2,4A2. Interestingly, the 2′ and 2 acyl chains were never cleaved individually nor in tandem with any other acyl chain, thus demonstrating the lower lability of these chains relative to those attached at the 3′ and 3 positions.
Figure 1.
(a) Structure of lAA and the corresponding MS/MS spectra of the deprotonated lipid by: (b) CID at NCE 35, (c) HCD at NCE 25, and (d) UVPD at 2.5 mJ for seven pulses. Only the most prominent fragment ions are labeled. ERMS plots are shown in (e) HCD and (f) UVPD. The HCD ERMS plot is shown with error bars in Figure S3 to illustrate the typical standard deviations of these measurements.
Details about the nature of the consecutive fragmentation pathways (i.e. genealogies) were confirmed by selected MSn experiments. For example, the ion labeled as 3′β + 3α in Figure 1 is isobaric with a product corresponding to cleavages of 3′α + 3β, and thus MS3 experiments were performed to confirm the identity as shown in Figure S4. MS3 HCD experiments on the 3α cleavage product ion (Figure S4b) reveal sequential cleavages at the 3′ε, 3′β, and 3′α positions. The series of consecutive fragmentation pathways is similarly reflected in the ERMS trends in Figure 1e, for which the abundance of the 3α cleavage product ion decreases at higher collision energies as the 3′α + 3α, 3′ε + 3α, and 3′β + 3α products emerge. MS3 HCD experiments on the 3′α cleavage product ion (Figure S4c) demonstrates consecutive cleavage at the 3α position or a cross-ring cleavage at the 0,4A2 position. This experiment confirms that the ion assignment of 3′β + 3α is correct, and there is no evidence for an isobaric 3′α + 3β product.
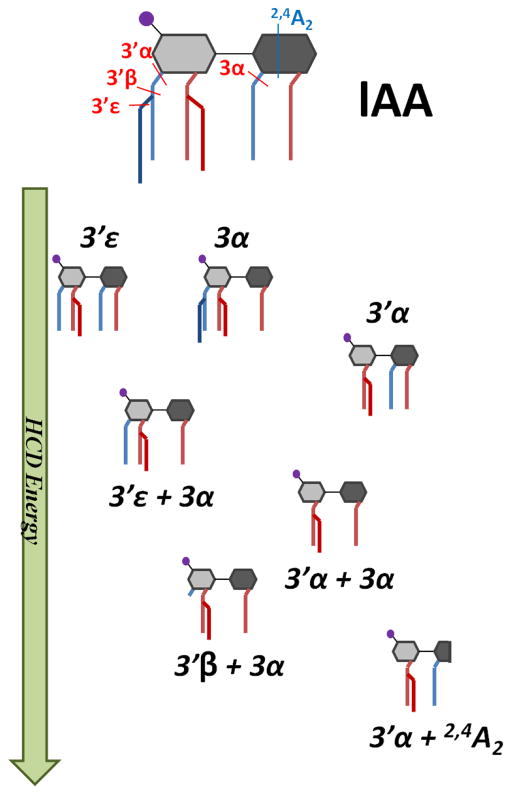
Closer inspection of the energy-variable HCD and UVPD curves in Figure 1e and 1f illustrates that the onsets for sequential fragmentation pathways were well-demarcated for HCD, whereas the onsets were identical for virtually all of the fragmentation pathways upon UVPD, including both cleavages of individual acyl chains and pairs of acyl chains. This behavior reflects the high internal energy deposition upon absorption of one or more UV photons and ultimately provides little genealogical information about fragmentation of lipid A, regardless of subtle structural differences. This type of energy-variable UVPD plot is consistent for other lipid A, and thus the remainder of the study will focus on the energy-variable HCD curves which better showcase the sequential fragmentation pathways of lipid A molecules. The pathways of lAA are summarized in Figure 2 and summarize the genealogy in a schematic format to illustrate the sequential loss of acyl chains. The behavior of lAB is analogous to that of lAA, an expected outcome owing to the fact that the only difference is the length of the secondary acyl chain at the N-2′ position. The corresponding energy variable HCD and UVPD plots for lAB are shown in Figure S5 and Figure S6, respectively.
Figure 2.
Summary of sequential fragmentation of lAA upon increasing HCD energy.
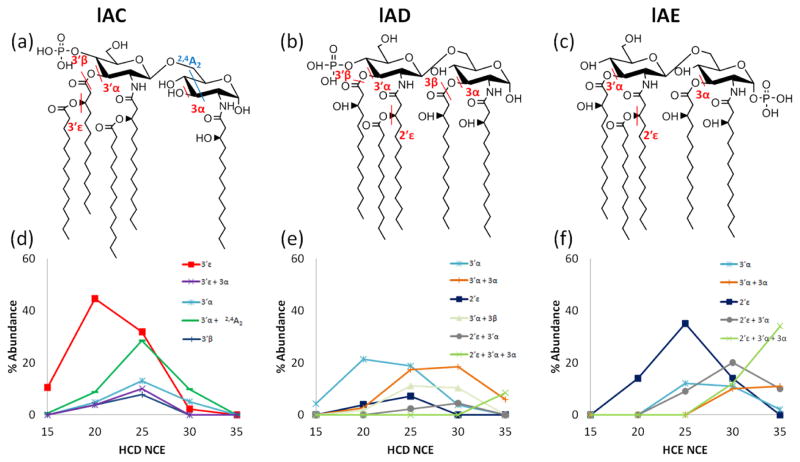
Energy variable HCD was used to examine the impact of the acyl chains on the preferential cleavages at different positions. The resulting plots are shown for three monophosphoryl lipid A variants in Figure 3 (in addition to lAA in Figure 1 and lAB in Figure S5), with the identified acyl chain and cross-ring cleavages indicated on each structure. Examples of HCD spectra for lAC, lAD, and lAE (NCE=20) are shown in Figures S7 and S8. Lipids lAA, lAB, lAC, lAD, and lAE all have five acyl chains; two are isomers (lAD and lAE). All five mono-phosphorylated lipid A have a secondary acyl chain at the N-2′ position; both lAA and lAB have an additional secondary acyl chain at the O-3′ position. Upon comparison of the ERMS curves, it is clear that the presence of secondary acyl chains and position of the phosphoryl groups significantly modulates the fragmentation patterns owing to their lability upon activation of lipid A. Cleavage of the secondary acyl chain, if present, at the O-3′ position (3′ε cleavage site) is particularly favored, thus representing a dominant fragmentation pathway observed at the lowest HCD energies. Loss of the O-3′ secondary chain may occur in conjunction with cleavages of other acyl chains at higher collision energies, as evidenced by the trends for cleavages of 3′ε + 3α for lAC, lAA, and lAB. For lAD and lAE which lack the 3′ secondary chain, cleavages of the secondary acyl chain at the 2′ position (2′ε cleavage) and of the primary acyl chain at the 3′ position (3′α cleavage) are preferred.
Figure 3.
lAC, lAD, and lAE structures with key cleavage sites indicated (a, b, c) and respective HCD ERMS plots (d, e, f) for the deprotonated lipids.
For each of the monophosphoryl lipid A, cleavages of the 3′ and 3 acyl chains are prominent, either alone at the lower collision energies or in conjunction with additional acyl chain cleavages at higher collision energies. The higher energy onset of the combined loss of the acyl chains at the 3′ and 3 positions suggests that loss of the 3′ chain occurs first, followed by the acyl chain at the 3 position. In contrast to the trends observed for lAA for which there was an abundant ion attributed to combined 3′ε and 3α cleavages (Figure 1e), this pathway is not highly favored for lAC and instead cleavage of the 3′ chain (3′ε) in conjunction with cross-ring cleavage of the reducing end sugar (2,4A2) is favored (Figure 3d). This observation is particularly useful for structural elucidation of the acyl chain positions of lipid A. While the secondary 3′ chain was not present for the other two monophosphoryl lipid A structures, lAD and lAE, they still exhibited combinatorial losses of acyl chains as a function of increasing collisional energy. lAD favored initial cleavage at the 3′α position, whereas lAE favored cleavage at the 2′ε position. Both of these monophosphoryl lipid A isomers exhibited similar 2′ε and 3′α cleavages in conjunction with the acyl chain at the 3-position (Figure 3e, f).
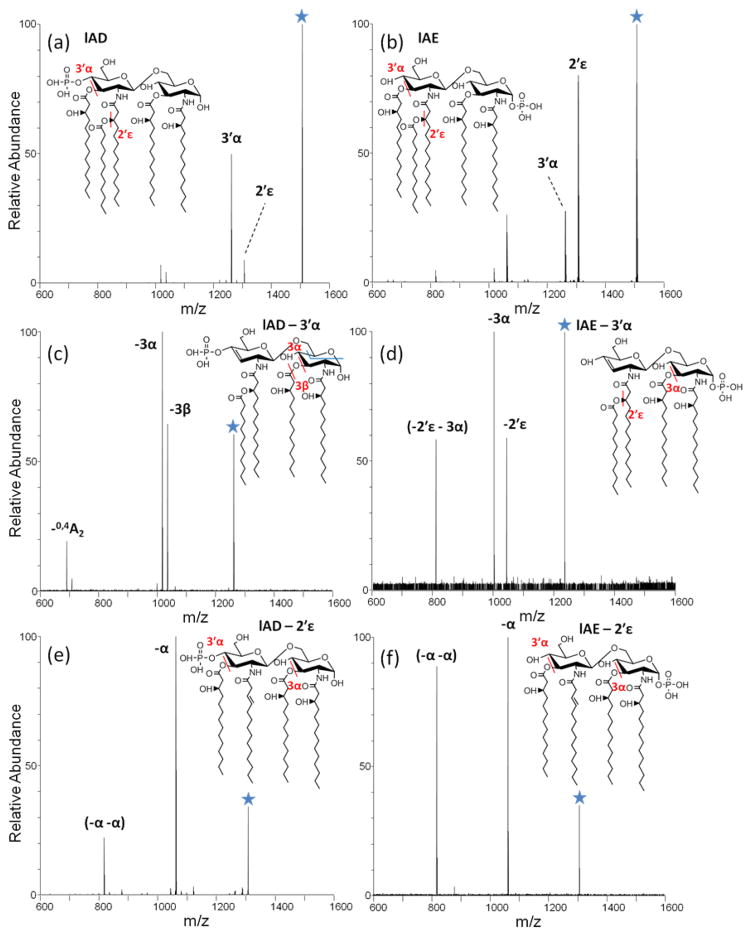
The fragmentation behavior of two isomeric lipid A, lAD and lAE, were analyzed in greater detail to evaluate the impact of the position of the phosphate group. For lAD, the phosphate moiety is located on the non-reducing sugar, whereas for lAE the phosphate moiety is located on the reducing sugar. Phosphorylation configurations have been deciphered previously for lipid A molecules from Yersinia pestis using MSn methods [21]. HCD MS2 and MS3 spectra for deprotonated lAD and lAE are shown in Figure 4. The first stage of HCD results in similar products for the two lipids (dominant cleavage at the 3′α and 2′ε positions), with lAD favoring the 3′α cleavage and lAE favoring the 2′ε cleavage (Figure 4a,b). Each of these primary products was isolated and subjected to a second stage of HCD, resulting in the MS3 spectra shown in Figures 4c–f. Isolation and activation of the dominant 3′α cleavage product for lAD resulted in subsequent cleavage of the O-3 acyl chain (3α or 3β cleavage) or cross ring cleavage of the reducing sugar (0,4A2) (Figure 4c). In contrast, isolation and activation of the 3′α cleavage product for lAE results in cleavage of the O-3 acyl chain (3α cleavage, similar to lAD) or elimination of the secondary 2′ acyl chain (2′ε cleavage), the latter not observed for the lAD isomer (Figure 4d). The striking differences in the MS3 spectra in Figure 4c, d highlight the impact of the location of the phosphate group on the consecutive cleavages of acyl chains. Isolation and activation of the 2′ε cleavage products for both lAD and lAE leads to generation of two prominent secondary fragment ions via sequential losses of both the 3 and 3′ acyl chains (3α and 3′α cleavages in Figure 4e, f). The order in which these two acyl chains are lost cannot be determined because they have identical masses. For differentiation of these two lipid A isomers, tracking the secondary fragment ions evolving from the 3′α cleavage product proves key.
Figure 4.
HCD spectra of deprotonated (a) lAD and (b) lAE. MS3 spectra in (c) to (f) reveal the sequential order of 3′α and 2′ε chain cleavage.
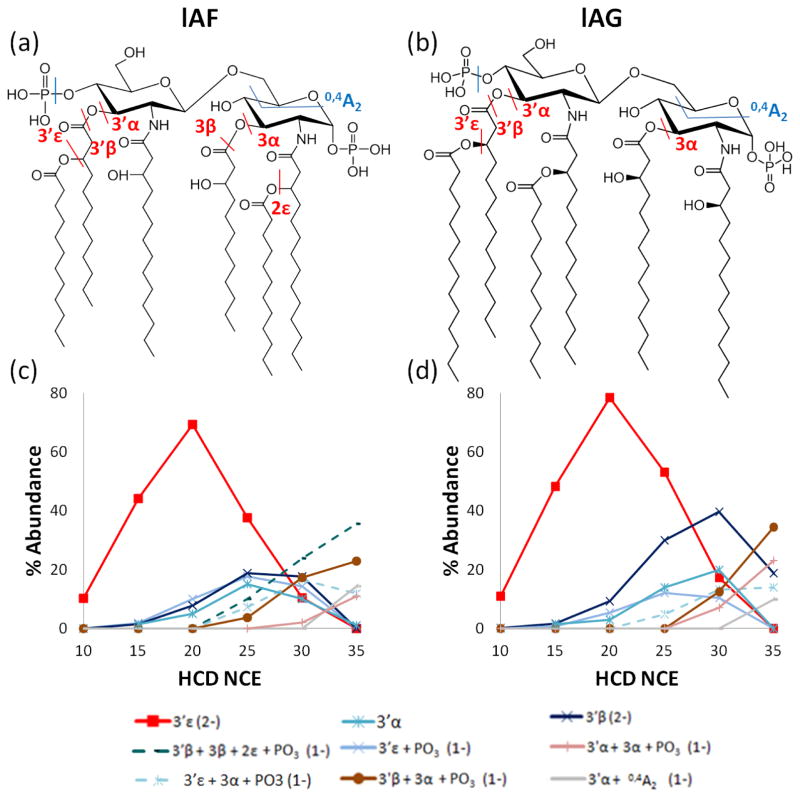
Five additional lipid A molecules were analyzed via energy-variable HCD to probe the impact of the number and positions of acyl chains for bisphosphorylated lipids. Both lAF and lAG have six acyl chains (Figure 5), the only difference being the location of the secondary acyl chains. lAF has secondary acyl chains located at the 3′- and 2-positions (Figure 5a), whereas lAG has secondary acyl chains located at the 3′- and 2′-positions (Figure 5b). The dominant lowest energy fragmentation pathway for both lipids entails cleavage of the secondary acyl chain at the 3′ position (3′ε cleavage). Sequential fragmentation results in cleavage of two or even three acyl chains at the 3′- and 3-positions. In fact, for these two lipids, eight of the dominant fragmentation pathways are identical. Interestingly, lAF demonstrates a loss of two secondary acyl chains (Figure 5c, 3′β + 3β + 2ε + PO3 product), whereas lAG never exhibits the loss of two secondary acyl chains (Figure 5d), leading to the conclusion that a secondary acyl chain at the 2-position (2ε cleavage) is more labile than one at the 2′-position (2′ε cleavage). The HCD spectra for lAF and lAG with the identified fragments labeled are shown in Figure S9.
Figure 5.
Structures of (a) lAF and (b) lAG. The HCD ERMS plots are shown for each doubly deprotonated lipid in (c) and (d), respectively.
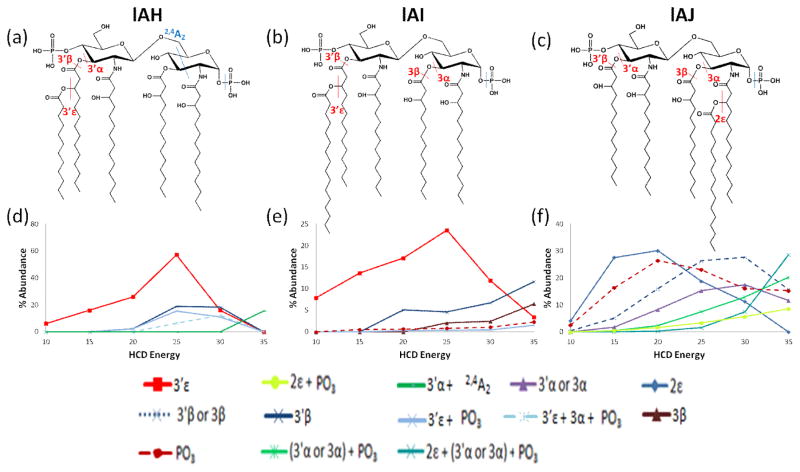
Three other bisphosphorylated lipid A species were subjected to energy-resolved MS/MS experiments. Of the three species examined, lAH (Figure 6a) and lAI (Figure 6b) have a secondary acyl chain at the 3′-position, whereas lAJ (Figure 6c) has a secondary acyl chain at the 2-position. Example of HCD spectra (NCE = 25) for lAH, lAI, and lAJ are shown in Figures S10–S12, respectively, and UVPD spectra and ERMS curves are provided in Figures S13–14 for lAI and lAJ. All three lipids displayed a loss of the secondary acyl chain, whether at the 3′- or 2-position, as the most dominant fragmentation pathway (Figure 6d–f, 3′ε or 2ε cleavage). The HCD spectra and energy-resolved trends for lAH and lAI are nearly identical, an expected outcome for these two analogs that differ only in the length of the secondary acyl chain at the 3′ position. Interestingly, simple loss of the phosphate moiety seems to be a more favored process when the secondary acyl chain is located at the 2-position (in the case of lAJ, Figure 6f) than when the secondary acyl chain is located at the 3′-position (Figure 6d,e). Moreover, the loss of phosphate alone is only prominent for lAJ, the only lipid A with a secondary acyl chain at the 2-position and no other secondary chains.
Figure 6.
lAH, lAI, and lAJ structures with key cleavage sites indicated (a, b, c) and respective HCD ERMS plots (d, e, f) for the deprotonated lipids.
Other correlations and contrasts can be drawn by comparison of the ERMS trends for lipid A species that have identical acyl chain patterns but different number of phosphate groups or ones with the same phosphorylation patterns but different arrangement of acyl chains. For example, lAB and lAG have identical acyl chain patterns, but lAB has a single phosphate group whereas lAG possesses two phosphate groups. In the case of mono-phosphate lAA, the dominant primary and secondary fragment ions observed originated from cleavage of an acyl chain or a cross-ring cleavage occurring (Figure 1). Bisphosphate lAG shows many of these same characteristics, but several of the corresponding pathways are only observed in conjunction with phosphate loss (Figure 5d). For example, the dual cleavage 3′ε + 3α, 3′α + 3α, and 3′β + 3α pathways for lAA occur only with phosphate loss for lAG. Phosphate loss directly from lAA renders the resulting ions non-detectable in the negative mode.
Comparison of lAF and lAH shows the influence of the number of secondary chains on the fragmentation patterns. lAF has two secondary acyl chains present, at the 3′- and 2-positions, whereas lAH has only has a single secondary acyl chain located at the 3′-position. Both molecules favor the 3′ε cleavage (Figures 5c and 6d), and the loss of the additional secondary chain at the 2-position (2ε cleavage) for lAF (Figure 5c) is only observed for one pathway involving multiple acyl chain losses at higher collision energies. In fact, loss of the secondary acyl chain at the 2-position is never a dominant process for lAF (or lAJ).
Conclusions
Energy resolved mass spectrometry of lipid A molecules enables detailed structural characterization via the genealogical patterns that emerge as specific chains are sequentially cleaved. HCD undertaken in an energy-resolved mode yields the most comprehensive information about the combinatorial cleavage of acyl chains and the preferential cleavage of the chains. Cleavage of a 3′ secondary chain is most favorable for lipid A, followed by cleavages of primary acyl chains at the 3 and 3′ position. A similar pattern, identifying the C3 primary acyl chain and the C3′ secondary acyl chain as the most labile upon collisional activation, has been reported by Sándor et al. for non-phosphorylated lipid A species [23]. For bisphosphorylated lipid A species, loss of a phosphate moiety occurs in conjunction with dominant secondary and primary acyl chain fragmentation. In some instances, cross ring cleavages of the reducing sugar are observed, but the structural features that modulate this pathway have not yet been deciphered. Recent work presented by Sándor et al. suggests that for non-phosphorylated lipid A species, cross ring cleavages at the 0,4A2-position generally occur in conjunction with secondary acyl chain fragmentation at the ε-positions [23]. While cross-ring cleavage of the mono- and bis-phosphorylated lipid A species analyzed in the present study did not occur for every lipid, it did occur in conjunction with primary and secondary acyl chain fragmentation at the C3′ positions. Implementation of the full ERMS strategy has limited feasibility on a chromatographic timescale owing to the brief elution profile of each lipid A compared to the number of scan averages to achieve confident characterization. However, a targeted LC experiment during which two or three collisional energies are utilized for each lipid A molecule could allow an efficient means to identify the most labile acyl chains at lower energies and provide total acyl chain content at higher energies.
Supplementary Material
Supplementary Figure S1: All 10 lipid A variants evaluated. (a) monophosphoryl lipid A (1745.28 Da, lAA); (b) detoxified lipid A (1717.25 Da, lAB); (c) monophosphoryl 3-deacyl lipid A (1519.09 Da, lAC); (d) E. coli strain BN2E (1507.05 Da, lAD); (e) E. coli strain BN2F (1507.05 Da, lAE); (f) Acinetobacter baumannii expressing lpxL (1713.13 Da, lAF); (g) bisphosphorylated lipid A (1797.22 Da; lAG); (h) W. succinogenes lpxJ (1587.02 Da, lAH); (i) C. jejuni 240 0482 (1643.08 Da, lAI); (j) C. jejuni lpxJ (1643.08 Da, lAJ)
Supplementary Figure S2: (a) CID ERMS of lAA and (b) the structure. CID ERMS does not afford the same genealogical information that HCD and UVPD do.
Supplementary Figure S3: HCD ERMS plot of lAA with error bars illustrating the standard deviations of the measurements performed in triplicate.
Supplementary Figure S4: (a) MS2 (HCD) on the 1- charge state of lAA. (b) MS3 (HCD) on the 3αpeak reveals the procedural loss of the 3′ε, 3′β, and 3′α, respectively. (c) MS3 (HCD) on the 3′αpeak reveals loss of 3αand cross-ring cleavage at 0,4A2.
Supplementary Figure S5: lAB MS2 spectra using HCD at NCE=25 (a) and the corresponding HCD ERMS plot (b). The structure of lAB is shown in (c).
Supplementary Figure S6: lAB MS2 spectra using UVPD at 3mJ, 5 pulses (a) and the corresponding UVPD ERMS plot (b). The structure for lAB is shown in (c).
Supplementary Figure S7: MS2 HCD spectra of lAC at NCE=20. The structure of lAC is shown in (b).
Supplementary Figure S8: MS2 HCD spectra of (a) lAD and (b) lAE at NCE=25 and their structures (c) and (d), respectively.
Supplementary Figure S9: MS2 HCD spectra of (a) lAF and (b) lAG at NCE=30 and their structures (c) and (d), respectively.
Supplementary Figure S10: lAH MS2 spectra using HCD at NCE=25 (a). The structure of lAH is shown in (b).
Supplementary Figure S11: lAI MS2 spectra using HCD at NCE=25 (a). The structure of lAI is shown in (b).
Supplementary Figure S12: lAJ MS2 spectra using HCD at NCE=25 (a). The structure of lAJ is shown in (b).
Supplementary Figure 13: MS2 UVPD spectra of (a) lAI and (b) lAJ at 3mJ and 7 pulses and their structures (c) and (d), respectively.
Supplementary Figure 14: Structures of lipid A isomers (a) lAI and (b) lAJ. The UVPD ERMS plots are shown for each doubly deprotonated lipid in (c) and (d), respectively, showing the preference for loss of α-chains over ε-chains.
Acknowledgments
Funding from the NIH (R01 GM103655 to J.S.B. and RO1s AI064184 and AI076322 to M.S.T) and the Welch Foundation (F-1155) is gratefully acknowledged.
References
- 1.Kaye KS, Pogue JM. Infections Caused by Resistant Gram-Negative Bacteria: Epidemiology and Management. Pharmacother J Hum Pharmacol Drug Ther. 2015;35:949–962. doi: 10.1002/phar.1636. [DOI] [PubMed] [Google Scholar]
- 2.Bouchillon SK, Badal RE, Hoban DJ, Hawser SP. Antimicrobial Susceptibility of Inpatient Urinary Tract Isolates of Gram-Negative Bacilli in the United States: Results from the Study for Monitoring Antimicrobial Resistance Trends (SMART) Program: 2009–2011. Clin Ther. 2013;35:872–877. doi: 10.1016/j.clinthera.2013.03.022. [DOI] [PubMed] [Google Scholar]
- 3.Bush K. Investigational Agents for the Treatment of Gram-Negative Bacterial Infections: A Reality Check. ACS Infect Dis. 2015;1:509–511. doi: 10.1021/acsinfecdis.5b00100. [DOI] [PubMed] [Google Scholar]
- 4.Kollef MH, Golan Y, Micek ST, Shorr AF, Restrepo MI. Appraising Contemporary Strategies to Combat Multidrug Resistant Gram-Negative Bacterial Infections–Proceedings and Data From the Gram-Negative Resistance Summit. Clin Infect Dis. 2011;53:S33–S55. doi: 10.1093/cid/cir475. [DOI] [PMC free article] [PubMed] [Google Scholar]
- 5.Whitfield C, Trent MS. Biosynthesis and export of bacterial lipopolysaccharides. Annu Rev Biochem. 2014;83:99–128. doi: 10.1146/annurev-biochem-060713-035600. [DOI] [PubMed] [Google Scholar]
- 6.Needham BD, Trent MS. Fortifying the barrier: the impact of lipid A remodelling on bacterial pathogenesis. Nat Rev Microbiol. 2013;11:467–481. doi: 10.1038/nrmicro3047. [DOI] [PMC free article] [PubMed] [Google Scholar]
- 7.Alexander C, Rietschel ET. Bacterial lipopolysaccharides and innate immunity. J Endotoxin Res. 2001;7:167–202. [PubMed] [Google Scholar]
- 8.Caroff M, Karibian D. Structure of bacterial lipopolysaccharides. Carbohydr Res. 2003;338:2431–2447. doi: 10.1016/j.carres.2003.07.010. [DOI] [PubMed] [Google Scholar]
- 9.Takayama K, Qureshi N, Ribi E, Cantrell JL. Separation and characterization of toxic and nontoxic forms of lipid A. Rev Infect Dis. 1984;6:439–443. doi: 10.1093/clinids/6.4.439. [DOI] [PubMed] [Google Scholar]
- 10.Kabanov DS, Prokhorenko IR. Structural analysis of lipopolysaccharides from Gram-negative bacteria. Biochem Mosc. 2010;75:383–404. doi: 10.1134/s0006297910040012. [DOI] [PubMed] [Google Scholar]
- 11.Raetz CRH, Reynolds CM, Trent MS, Bishop RE. Lipid A modification systems in gram-negative bacteria. Annu Rev Biochem. 2007;76:295–329. doi: 10.1146/annurev.biochem.76.010307.145803. [DOI] [PMC free article] [PubMed] [Google Scholar]
- 12.Rietschel ET, Wollenweber HW, Zähringer U, Lüderitz O. Lipid A, the lipid component of bacterial lipopolysaccharides: relation of chemical structure to biological activity. Klin Wochenschr. 1982;60:705–709. doi: 10.1007/BF01716559. [DOI] [PubMed] [Google Scholar]
- 13.Corsaro MM, Piaz FD, Lanzetta R, Parrilli M. Lipid A structure of Pseudoalteromonas haloplanktis TAC 125: use of electrospray ionization tandem mass spectrometry for the determination of fatty acid distribution. J Mass Spectrom JMS. 2002;37:481–488. doi: 10.1002/jms.304. [DOI] [PubMed] [Google Scholar]
- 14.Bedoux G, Vallée-Réhel K, Kooistra O, Zähringer U, Haras D. Lipid A components from Pseudomonas aeruginosa PAO1 (serotype O5) and mutant strains investigated by electrospray ionization ion-trap mass spectrometry. J Mass Spectrom JMS. 2004;39:505–513. doi: 10.1002/jms.611. [DOI] [PubMed] [Google Scholar]
- 15.Lee CS, Kim YG, Joo HS, Kim BG. Structural analysis of lipid A from Escherichia coli O157:H7:K- using thin-layer chromatography and ion-trap mass spectrometry. J Mass Spectrom JMS. 2004;39:514–525. doi: 10.1002/jms.614. [DOI] [PubMed] [Google Scholar]
- 16.Sforza S, Silipo A, Molinaro A, Marchelli R, Parrilli M, Lanzetta R. Determination of fatty acid positions in native lipid A by positive and negative electrospray ionization mass spectrometry. J Mass Spectrom JMS. 2004;39:378–383. doi: 10.1002/jms.598. [DOI] [PubMed] [Google Scholar]
- 17.El-Aneed A, Banoub J. Elucidation of the molecular structure of lipid A isolated from both a rough mutant and a wild strain of Aeromonas salmonicida lipopolysaccharides using electrospray ionization quadrupole time-of-flight tandem mass spectrometry. Rapid Commun Mass Spectrom RCM. 2005;19:1683–1695. doi: 10.1002/rcm.1971. [DOI] [PubMed] [Google Scholar]
- 18.Shaffer SA, Harvey MD, Goodlett DR, Ernst RK. Structural heterogeneity and environmentally regulated remodeling of Francisella tularensis subspecies novicida lipid a characterized by tandem mass spectrometry. J Am Soc Mass Spectrom. 2007;18:1080–1092. doi: 10.1016/j.jasms.2007.03.008. [DOI] [PMC free article] [PubMed] [Google Scholar]
- 19.Schilling B, McLendon MK, Phillips NJ, Apicella MA, Gibson BW. Characterization of lipid A acylation patterns in Francisella tularensis, Francisella novicida, and Francisella philomiragia using multiple-stage mass spectrometry and matrix-assisted laser desorption/ionization on an intermediate vacuum source linear ion trap. Anal Chem. 2007;79:1034–1042. doi: 10.1021/ac061654e. [DOI] [PMC free article] [PubMed] [Google Scholar]
- 20.Silipo A, De Castro C, Lanzetta R, Molinaro A, Parrilli M, Vago G, Sturiale L, Messina A, Garozzo D. Structural characterizations of lipids A by MS/MS of doubly charged ions on a hybrid linear ion trap/orbitrap mass spectrometer. J Mass Spectrom JMS. 2008;43:478–484. doi: 10.1002/jms.1333. [DOI] [PubMed] [Google Scholar]
- 21.Jones JW, Cohen IE, Tureĉek F, Goodlett DR, Ernst RK. Comprehensive structure characterization of lipid a extracted from Yersinia pestis for determination of its phosphorylation configuration. J Am Soc Mass Spectrom. 2010;21:785–799. doi: 10.1016/j.jasms.2010.01.008. [DOI] [PubMed] [Google Scholar]
- 22.Sándor V, Dörnyei Á, Makszin L, Kilár F, Péterfi Z, Kocsis B, Kilár A. Characterization of complex, heterogeneous lipid A samples using HPLC–MS/MS technique I. Overall analysis with respect to acylation, phosphorylation and isobaric distribution. J Mass Spectrom. 2016;51:1043–1063. doi: 10.1002/jms.3839. [DOI] [PubMed] [Google Scholar]
- 23.Sándor V, Kilár A, Kilár F, Kocsis B, Dörnyei Á. Characterization of complex, heterogeneous lipid A samples using HPLC–MS/MS technique II. Structural elucidation of non-phosphorylated lipid A by negative-ion mode tandem mass spectrometry. J Mass Spectrom. 2016;51:615–628. doi: 10.1002/jms.3786. [DOI] [PubMed] [Google Scholar]
- 24.Brodbelt JS. Photodissociation mass spectrometry: new tools for characterization of biological molecules. Chem Soc Rev. 2014;43:2757–2783. doi: 10.1039/c3cs60444f. [DOI] [PMC free article] [PubMed] [Google Scholar]
- 25.Reilly JP. Ultraviolet photofragmentation of biomolecular ions. Mass Spectrom Rev. 2009;28:425–447. doi: 10.1002/mas.20214. [DOI] [PMC free article] [PubMed] [Google Scholar]
- 26.Ly T, Julian RR. Ultraviolet Photodissociation: Developments towards Applications for Mass-Spectrometry-Based Proteomics. Angew Chem Int Ed. 2009;48:7130–7137. doi: 10.1002/anie.200900613. [DOI] [PubMed] [Google Scholar]
- 27.Madsen JA, Boutz DR, Brodbelt JS. Ultrafast Ultraviolet Photodissociation at 193 nm and its Applicability to Proteomic Workflows. J Proteome Res. 2010;9:4205–4214. doi: 10.1021/pr100515x. [DOI] [PMC free article] [PubMed] [Google Scholar]
- 28.Madsen JA, Cullen TW, Trent MS, Brodbelt JS. IR and UV Photodissociation as Analytical Tools for Characterizing Lipid A Structures. Anal Chem. 2011;83:5107–5113. doi: 10.1021/ac103271w. [DOI] [PMC free article] [PubMed] [Google Scholar]
- 29.O’Brien JP, Needham BD, Henderson JC, Nowicki EM, Trent MS, Brodbelt JS. 193 nm Ultraviolet Photodissociation Mass Spectrometry for the Structural Elucidation of Lipid A Compounds in Complex Mixtures. Anal Chem. 2014;86:2138–2145. doi: 10.1021/ac403796n. [DOI] [PMC free article] [PubMed] [Google Scholar]
- 30.Hankins JV, Madsen JA, Giles DK, Childers BM, Klose KE, Brodbelt JS, Trent MS. Elucidation of a novel Vibrio cholerae lipid A secondary hydroxy-acyltransferase and its role in innate immune recognition. Mol Microbiol. 2011;81:1313–1329. doi: 10.1111/j.1365-2958.2011.07765.x. [DOI] [PMC free article] [PubMed] [Google Scholar]
- 31.Hankins JV, Madsen JA, Giles DK, Brodbelt JS, Trent MS. Amino acid addition to Vibrio cholerae LPS establishes a link between surface remodeling in gram-positive and gram-negative bacteria. Proc Natl Acad Sci U S A. 2012;109:8722–8727. doi: 10.1073/pnas.1201313109. [DOI] [PMC free article] [PubMed] [Google Scholar]
- 32.Hankins JV, Madsen JA, Needham BD, Brodbelt JS, Trent MS. The outer membrane of Gram-negative bacteria: lipid A isolation and characterization. Methods Mol Biol Clifton NJ. 2013;966:239–258. doi: 10.1007/978-1-62703-245-2_15. [DOI] [PMC free article] [PubMed] [Google Scholar]
- 33.Cullen TW, O’Brien JP, Hendrixson DR, Giles DK, Hobb RI, Thompson SA, Brodbelt JS, Trent MS. EptC of Campylobacter jejuni Mediates Phenotypes Involved in Host Interactions and Virulence. Infect Immun. 2013;81:430–440. doi: 10.1128/IAI.01046-12. [DOI] [PMC free article] [PubMed] [Google Scholar]
- 34.Rubin EJ, O’Brien JP, Ivanov PL, Brodbelt JS, Trent MS. Identification of a broad family of lipid A late acyltransferases with non-canonical substrate specificity. Mol Microbiol. 2014;91:887–899. doi: 10.1111/mmi.12501. [DOI] [PMC free article] [PubMed] [Google Scholar]
- 35.O’Brien JP, Needham BD, Brown DB, Trent MS, Brodbelt JS. Top-Down Strategies for the Structural Elucidation of Intact Gram-negative Bacterial Endotoxins. Chem Sci R Soc Chem 2010. 2014;5:4291–4301. doi: 10.1039/C4SC01034E. [DOI] [PMC free article] [PubMed] [Google Scholar]
- 36.Madalinski G, Fournier F, Wind F-L, Afonso C, Tabet J-C. Gram-negative bacterial lipid A analysis by negative electrospray ion trap mass spectrometry: Stepwise dissociations of deprotonated species under low energy CID conditions. Int J Mass Spectrom. 2006;249–250:77–92. [Google Scholar]
- 37.Ting YS, Shaffer SA, Jones JW, Ng WV, Ernst RK, Goodlett DR. Automated Lipid A Structure Assignment from Hierarchical Tandem Mass Spectrometry Data. J Am Soc Mass Spectrom. 2011;22:856–866. doi: 10.1007/s13361-010-0055-y. [DOI] [PubMed] [Google Scholar]
- 38.Yoon SH, Liang T, Schneider T, Oyler BL, Chandler CE, Ernst RK, Yen GS, Huang Y, Nilsson E, Goodlett DR. Rapid Lipid A Structure Determination via Surface Acoustic Wave Nebulization and Hierarchical Tandem Mass Spectrometry Algorithm. Rapid Commun Mass Spectrom. 2016 doi: 10.1002/rcm.7728. n/a-n/a. [DOI] [PubMed] [Google Scholar]
- 39.Morrison LJ, Parker WR, Holden DD, Henderson JC, Boll JM, Trent MS, Brodbelt JS. UVliPiD: A UVPD-Based Hierarchical Approach for De Novo Characterization of Lipid A Structures. Anal Chem. 2016;88:1812–1820. doi: 10.1021/acs.analchem.5b04098. [DOI] [PMC free article] [PubMed] [Google Scholar]
- 40.Kolli V, Dodds ED. Energy-resolved collision-induced dissociation pathways of model N-linked glycopeptides: implications for capturing glycan connectivity and peptide sequence in a single experiment. Analyst. 2014;139:2144–2153. doi: 10.1039/c3an02342g. [DOI] [PubMed] [Google Scholar]
- 41.Kurimoto A, Daikoku S, Mutsuga S, Kanie O. Analysis of Energy-Resolved Mass Spectra at MSn in a Pursuit To Characterize Structural Isomers of Oligosaccharides. Anal Chem. 2006;78:3461–3466. doi: 10.1021/ac0601361. [DOI] [PubMed] [Google Scholar]
- 42.Nowicki EM, O’Brien JP, Brodbelt JS, Trent MS. Extracellular zinc induces phosphoethanolamine addition to Pseudomonas aeruginosa lipid A via the ColRS two-component system. Mol Microbiol. 2015;97:166–178. doi: 10.1111/mmi.13018. [DOI] [PMC free article] [PubMed] [Google Scholar]
- 43.Needham BD, Carroll SM, Giles DK, Georgiou G, Whiteley M, Trent MS. Modulating the innate immune response by combinatorial engineering of endotoxin. Proc Natl Acad Sci. 2013;110:1464–1469. doi: 10.1073/pnas.1218080110. [DOI] [PMC free article] [PubMed] [Google Scholar]
- 44.Klein DR, Holden DD, Brodbelt JS. Shotgun Analysis of Rough-Type Lipopolysaccharides Using Ultraviolet Photodissociation Mass Spectrometry. Anal Chem. 2016;88:1044–1051. doi: 10.1021/acs.analchem.5b04218. [DOI] [PMC free article] [PubMed] [Google Scholar]
- 45.Domon B, Costello CE. A systematic nomenclature for carbohydrate fragmentations in FAB-MS/MS spectra of glycoconjugates. Glycoconj J. 1988;5:397–409. [Google Scholar]
Associated Data
This section collects any data citations, data availability statements, or supplementary materials included in this article.
Supplementary Materials
Supplementary Figure S1: All 10 lipid A variants evaluated. (a) monophosphoryl lipid A (1745.28 Da, lAA); (b) detoxified lipid A (1717.25 Da, lAB); (c) monophosphoryl 3-deacyl lipid A (1519.09 Da, lAC); (d) E. coli strain BN2E (1507.05 Da, lAD); (e) E. coli strain BN2F (1507.05 Da, lAE); (f) Acinetobacter baumannii expressing lpxL (1713.13 Da, lAF); (g) bisphosphorylated lipid A (1797.22 Da; lAG); (h) W. succinogenes lpxJ (1587.02 Da, lAH); (i) C. jejuni 240 0482 (1643.08 Da, lAI); (j) C. jejuni lpxJ (1643.08 Da, lAJ)
Supplementary Figure S2: (a) CID ERMS of lAA and (b) the structure. CID ERMS does not afford the same genealogical information that HCD and UVPD do.
Supplementary Figure S3: HCD ERMS plot of lAA with error bars illustrating the standard deviations of the measurements performed in triplicate.
Supplementary Figure S4: (a) MS2 (HCD) on the 1- charge state of lAA. (b) MS3 (HCD) on the 3αpeak reveals the procedural loss of the 3′ε, 3′β, and 3′α, respectively. (c) MS3 (HCD) on the 3′αpeak reveals loss of 3αand cross-ring cleavage at 0,4A2.
Supplementary Figure S5: lAB MS2 spectra using HCD at NCE=25 (a) and the corresponding HCD ERMS plot (b). The structure of lAB is shown in (c).
Supplementary Figure S6: lAB MS2 spectra using UVPD at 3mJ, 5 pulses (a) and the corresponding UVPD ERMS plot (b). The structure for lAB is shown in (c).
Supplementary Figure S7: MS2 HCD spectra of lAC at NCE=20. The structure of lAC is shown in (b).
Supplementary Figure S8: MS2 HCD spectra of (a) lAD and (b) lAE at NCE=25 and their structures (c) and (d), respectively.
Supplementary Figure S9: MS2 HCD spectra of (a) lAF and (b) lAG at NCE=30 and their structures (c) and (d), respectively.
Supplementary Figure S10: lAH MS2 spectra using HCD at NCE=25 (a). The structure of lAH is shown in (b).
Supplementary Figure S11: lAI MS2 spectra using HCD at NCE=25 (a). The structure of lAI is shown in (b).
Supplementary Figure S12: lAJ MS2 spectra using HCD at NCE=25 (a). The structure of lAJ is shown in (b).
Supplementary Figure 13: MS2 UVPD spectra of (a) lAI and (b) lAJ at 3mJ and 7 pulses and their structures (c) and (d), respectively.
Supplementary Figure 14: Structures of lipid A isomers (a) lAI and (b) lAJ. The UVPD ERMS plots are shown for each doubly deprotonated lipid in (c) and (d), respectively, showing the preference for loss of α-chains over ε-chains.


