Abstract
Red blood cells are known to change shape in response to local flow conditions. Deformability affects red blood cell physiological function and the hydrodynamic properties of blood. The immersed boundary method is used to simulate three-dimensional membrane–fluid flow interactions for cells with the same internal and external fluid viscosities. The method has been validated for small deformations of an initially spherical capsule in simple shear flow for both neo-Hookean and the Evans-Skalak membrane models. Initially oblate spheroidal capsules are simulated and it is shown that the red blood cell membrane exhibits asymptotic behavior as the ratio of the dilation modulus to the extensional modulus is increased and a good approximation of local area conservation is obtained. Tank treading behavior is observed and its period calculated.
I. INTRODUCTION
The membrane of the red blood cell (RBC) is easily deformed by shearing forces while maintaining its local area nearly unchanged. This type of response is due to the structure of the membrane which is composed of a lipid bilayer supported by a scaffolding of cytoskeletal proteins. Normal human RBCs in quiescent plasma assume a biconcave discoid shape with an average diameter of 8 μm, thickness of 2 μm, surface area of 140 μm2, and volume of 90 μm3.1 Equilibrium of forces determines the quiescent shape and it has been shown that changing the properties of the membrane leads to different quiescent shapes.2 The surface area to volume ratio of the normal cell is 40% greater than that of a sphere with the same volume. Excess surface area not only improves the RBCs efficiency in loading and unloading solutes, but also allows the cell to deform easily as it passes through the circulatory system where it may encounter capillaries with diameters as small as 2.5 μm. The deformability of the RBC membrane affects its physiological function of oxygen transport3 and determines the hydrodynamic properties of whole blood,4,5 which has a normal hematocrit (volume fraction of RBCs) of approximately 45%.
The behavior of red blood cells in shear flow has been observed. At low shear rates the cells can tumble but as the shear rate increases the red blood cell can reach and equilibrium shape and orientation which remain constant as the membrane rotates in the plane of shear. Early observations of this behavior, called tank treading, were reported by Schmid-Schönbein and co-workers.6,7 Since the tank treading velocity of the membrane is not uniform, this behavior is more like that of a drop than a solid particle. However, the tensions in an elastic membrane depend on the local strain, not local curvature. Keller and Skalak have modeled the behavior of nondeforming ellipsoidal particles in shear flow and predicted the shear rate at which the transition to tank treading occurs.8 The average deformation of a suspension of red blood cells was most recently measured by Mazeron et al.9 Chang and Olbrecht have measured the deformation of a single synthetic cell whose membrane is viscoelastic in extensional and Couette flows.10,11
The flow of deformable RBCs through capillaries can be considered axisymmetric under appropriate conditions and has been studied theoretically. Zarda et al.12 used a membrane model with a finite dilation modulus and resistance to bending stresses, and simulated axisymmetric flow through capillaries using the finite element method. A membrane model that treats the membrane as locally area conserving but neglects bending resistance was used by Secomb et al.13 Simulations with this model can result in shapes with cusps at the trailing edge of the RBC due to the lack of bending resistance. Nonaxisymmetric geometry of nondeformable RBCs in capillaries has also been considered.14 In vessels with diameters larger than the dimensions of the RBC the geometry is generally three dimensional. We begin the development of a general three-dimensional model of the RBC by studying ghost cells whose internal fluid is the same as the suspending fluid (plasma). These cells do not occur naturally but can be prepared in vitro15 and have been used extensively in experimental studies. A ghost cell is created by increasing the permeability of the membrane to hemoglobin by osmotic swelling to allow its diffusion into the surrounding fluid. RBCs fall into the category of suspended particles known as capsules; capsules are particles with elastic membranes that enclose a fluid, as opposed to droplets and bubbles whose interfacial forces arise from surface tension. Perturbation methods were used in the first models of fluid–capsule interactions. Assuming an initially unstressed spherical capsule with a quadratic strain energy function, linearized equations were solved to obtain the steady-state shape16 and time evolution17,18 of capsules in simple flows. Barthes-Biesel and Sgaier19 used linear theory to study the effect of membrane viscosity and found that purely viscous membranes tumble while particles with viscoelastic membranes orient themselves to the streamlines when the shear rate and relaxation time are of the same order. Large deformations of two-dimensional cylindrical capsules were studied by Rao et al.20 by extending the perturbation equations to include terms of up to sixth order of the perturbation parameter that is proportional to the shear rate. More general models of capsule deformation have been based on the boundary element method. One advantage of using the boundary element method is that the geometric dimension of the problem is reduced by one. Governing equations are solved only on the bounding surface, and the solutions can be used to calculate variables in the external and internal flow field. Capsules with Mooney-Rivlin membranes suspended in elongational flow21 and passing through a hyperbolic constriction22 were modeled by Barthes-Biesel and co-workers. In both cases the geometry was axisymmetric. Pozrikidis23 has recently used the boundary element method to simulate the deformation of a capsule suspended in a simple shear flow with a quadratic approximation of a neo-Hookean membrane strain energy function. Rupture of the membrane depends on the maximum strain, which varies with shear rate. A comparison is made with the observations made in Ref. 11 showing good agreement. Both initially spherical and elliptical capsules were considered. Zhou and Pozrikidis24 have used the boundary element method with interfacial tension based on surface tension with an incompressibility constraint as a model of the RBC membrane. Local area conservation is enforced through a kinematic condition which does not account for the extensional properties of the membrane.
In the present work, we use the immersed boundary method25,26 to simulate capsule deformation in which internal and external fluid properties are equal, thus representing the flow of red blood cell ghosts. Unlike the BEM, fluid velocities are calculated in the interior and exterior fluids at every time step. The immersed boundary method does not preclude the simulation of a cell with a fluid of differing internal viscosity. The methodology has been developed by Unverdi and Tryggvason27 for tracking the interface and accounting for the changes in fluid properties. Front tracking requires the solution of Poisson’s equation on the entire fluid grid at every time step, and is thus more costly to implement. Recently, Haj-Hariri et al.28 have developed an adaptive grid refinement scheme in combination with a front tracking method to study thermocapillary motion of drops where the ratio of internal to external fluid viscosity varied from 10−3 to 101. The immersed boundary method has also been used to simulate the flow of suspensions of solid particles,29 and the deposition of nondeforming particles on solid substrates in the simulation of biofilm processes.30
A finite element model of the capsule membrane is used to approximate the forces due to general forms of the strain-energy function in conjunction with the immersed boundary method. The method is validated with the predictions of linear theory for both a neo-Hookean membrane and a model of the RBC membrane. The material properties of the neo-Hookean membrane are characterized solely by the elastic Young’s) modulus. The Evans and Skalak membrane model31 that has been commonly used as the model for the RBC membrane is characterized by a dilation modulus that determines the resistance to local changes in area and an extension modulus that determines the resistance to shearing stresses. Viscoelastic properties of the RBC membrane are not included in the model. Using the reported properties for the RBC membrane which has a very high dilation modulus we found the calculations to be unstable. In this work we show that very good approximations of RBC membrane behavior can be obtained at much lower dilation moduli at which the numerical method is more stable and total computation times are practical. Simulations of the deformation of initially spheroidal cells for different dilation moduli and shear rates are reported.
II. THE IMMERSED BOUNDARY METHOD
The immersed boundary method was introduced by Peskin25 to simulate blood flow in the heart. In the present work, we consider deformation of an elastic capsule filled with a Newtonian fluid. No modifications are made to the immersed boundary method, and the discretization of the membrane is done using a standard finite element method. The two methods have previously not been combined to study fluid–membrane interactions. In response to the external velocity field, the capsule will deform and exhibit tank treading. The immersed boundary method is used to follow the motion of the membrane. Boundaries are allowed to translate and deform by splitting the numerical solution onto two grids: a stationary fluid grid which does not change after each time step and a moving boundary grid whose nodes move with the local velocity field. In this section we describe the immersed boundary method and save the discussion of the membrane model for a following section.
The following scalings are used to nondimensionalize time, length, velocity, pressure, and force:
| (1) |
where Lr and tr are the chosen reference length and time, respectively, and η is the fluid viscosity.
The nondimensional equations governing incompressible Navier–Stokes flow inside and outside a capsule are given by
| (2) |
| (3) |
| (4) |
| (5) |
where Eqs. (2) and (3) govern the flow of the internal fluid enclosed by the capsule membrane and Eqs. (4) and (5) the flow of the external fluid and λ = ηi/ηe is the ratio of the internal to external viscosities. No-slip conditions at the membrane surface S require that velocities be continuous across the surface such that
| (6) |
In the immersed boundary method, the elastic forces that the membrane exerts on the fluid are approximated through the addition of weighted forces to the momentum equation in the vicinity of boundary. Membrane forces in R3 located at X are distributed to a fluid grid node at x using a discrete delta function which is chosen to approximate the properties of the Dirac delta function.25 Here we use the following three-dimensional function26
| (7) |
where
| (8) |
The domain of influence of each membrane node has a radius of two uniform fluid grid spacings h. A fraction of the elastic force at X is added to the momentum equation at the fluid grid x giving a modified momentum equation. Solving the coupled continuity equation and modified momentum equations gives the velocities on the fluid grid. No slip conditions at the membrane surface are satisfied by assigning a weighted local fluid velocity to the membrane nodes. The velocity (uN) of an immersed boundary node (N) is the sum of the velocities at the fluid grid nodes (x) weighted by the discrete delta function giving
| (9) |
The summation can be taken over all fluid grid nodes, but only those in the sphere of influence of the immersed boundary node N will make a contribution to its velocity. The immersed boundary node moves at this velocity for one time step to a new position given by
| (10) |
The forces exerted by the moving boundary have changed from the previous time step due to its new configuration. The new forces are calculated and the procedure is repeated to advance the flow one time step. The immersed boundary method does not rely on a specific discretizing method. Here we use the finite Fourier transform method described in detail in Ref. 26.
III. DISCRETE MODEL OF THE CAPSULE MEMBRANE
Our finite element model of the membrane is based on the model developed by Charrier et al.32 and Shrivastava and Tang.33 The model is used to obtain the forces acting at the discrete nodes of the membrane which are then distributed onto the fluid grid as described above. Here we summarize the characteristics of the model and refer the reader to Refs. 32 and 33 for specific details. The capsule membrane is discretized into flat triangular elements which remain flat after deformation. The approximation is valid assuming that during deformation the local radius of curvature is much larger than the membrane thickness and bending stresses are negligible. The expressions developed for the force exerted at the nodes of an element of the deformed membrane are given in the plane of the element. In a general three-dimensional deformation, the elements do not remain in the same plane after being displaced. The deformed element is transformed to the plane of the undeformed element to determine the relative displacement of the nodes and the corresponding forces. Stresses and strains exist only in the plane of the membrane and the strain energy is given by W(λ1, λ2), where λ1 and λ2 are the principal strains. Quantities are approximated by linear functions in the plane of the element with coordinates (x′, y′) such that they are described by
| (11) |
The three unknown coefficients a, b, and c are determined using known values of the function Fi at the three nodes located at of the element.
Given the displacement of the three nodes of an element, its state of strain (λ1, λ2) can be obtained. The material properties of the element determine the forces that are required to maintain the element in a given state of strain/stress. The principle of virtual work is used to calculate the forces at the three nodes of an element. Each node of the discrete membrane belongs to more than one element. The resultant force F on the ith node is simply the sum of the forces exerted by the m elements attached to the node. The forces calculated are those that act on the node to deform the membrane. An equal and opposite force acts on the fluid in the manner prescribed by the immersed boundary method.
IV. SPHERICAL CAPSULES
Figure 1 shows the geometry and parameters that are important for the problem of a capsule deforming in shear flow. Here η is the fluid viscosity, is the shear rate, a is the initial radius of the capsule, and μ denotes the extension modulus of the membrane. Barthes-Biesel and Rallison (BBR)22 studied the linearized problem of the evolution of an initially spherical capsule in a shear flow using perturbation methods and obtained expressions that are valid for . The deformation of the membrane is described by the Taylor shape parameter
| (12) |
where L is the length of cross section of the cell and B is the breadth. Cross sections are taken in the plane of shear in the discussions that follow. We will show that the time evolution of the Taylor shape parameter Dxy is in agreement with the previously obtained linear solutions for small values of G and the numerical nonlinear solutions at higher values of G for a neo-Hookean membrane.
FIG. 1.
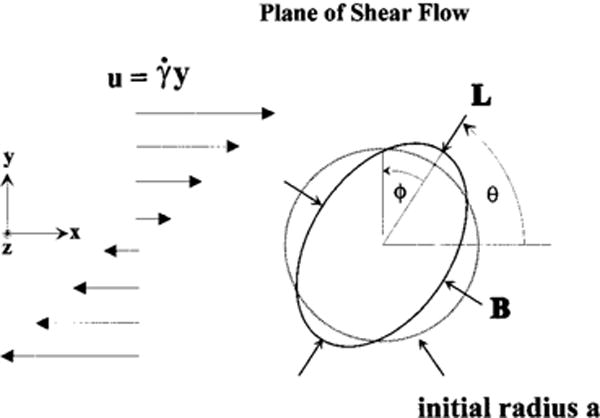
Flow schematic for a capsule deforming in shear flow.
A. Theory for small deformations
The development of the equations that predict the deformation of initially spherical capsules in response to fluid forces is described in detail by BBR. Here we summarize and use their solution to validate calculations using the immersed boundary method.
Classic membrane theory expresses the principal strains λ1 and λ2 using local in-plane curvilinear coordinates. BBR have developed new strain invariants a and b that are more easily manipulated in Cartesian coordinates
| (13) |
| (14) |
The strain energy function W(λ1, λ2) for a given membrane material is then expressed in terms of these invariants to give W(a, b). Assuming small deformations, the strain energy function is expanded as a Taylor series and terms quadratic in a are kept so that the approximate strain energy function w is given by
| (15) |
This form of the strain energy function is used in obtaining the equations governing the deformation of the membrane in the plane of shear
| (16) |
where xs is the displaced position of a point on the sphere and Xs is the initial position of the same point. The functions J and K depend on time only and for an initially unstressed membrane their evolution is governed by
| (17) |
where
| (18) |
| (19) |
| (20) |
| (21) |
The values of αi depend on the properties of the membrane and are given below. It is straightforward to solve these coupled ODEs with constant coefficients. Given the time evolution of K and (J−K), Eq. (16) is used to obtain the shape of the deformed membrane.
B. Neo-Hookean membrane
The strain energy function for a neo-Hookean membrane is given by
| (22) |
where E is the Young’s modulus and h is the membrane thickness. The material is incompressible (volume preserving). The corresponding coefficients for the quadratic strain energy function Eq. (15) are
| (23) |
The solution of the linearized equations for the neo-Hookean membrane was found by BBR. In the present work we use the immersed boundary method to simulate the deformation of a spherical neo-Hookean membrane and we will compare the results with linear theory. A spherical membrane of radius a is discretized into 15 552 flat triangular elements connecting 7778 nodes distributed over the membrane. The spherical shape is taken to be a strain free state and the shape factors for each element are obtained from this undeformed configuration. The center of the membrane is placed at the center of a cube whose side is 4a and the cube is discretized into a uniformly spaced grid of discretization 2N×2N×2N. Periodic boundary conditions are imposed at the sides of the cube and shear flow is created by placing equal and opposite shearing forces on two planes near the edge of the cube. The forces (−bf,0,0) and (bf,0,0) are applied on the planes of the discretized cube, (i,2,k) and (i,3,k), respectively. An undisturbed shear flow in the form (u(j),0,0) with shear rate is created, where
| (24) |
The membrane is held stationary until the shear flow is fully developed and is then released at t = 0.
The time evolution of the Taylor shape parameter is followed for several values of the dimensionless parameter on a course grid 32×32×32 as shown in Fig. 2. Deformations are small for G<0.05 and there is excellent agreement with linear theory. The difference in the shape parameters when the calculations are stopped are 3.0%, 0.21% for G = 0.0125, 0.025, respectively. As the value of G increases the deformations increase and linear theory does not apply. For larger values of G, we compare the evolution of the capsule shape using the immersed boundary method coupled with the quadratic form of the strain energy function, Eq. (15), with that found by Pozrikidis23 using the boundary element method (BEM) at G=0.1 and G=0.2 in Fig. 2. In both cases the two solutions coincide. The method of generating the shear flow creates a discontinuity in velocity that may affect the deformation of the capsule. To test whether this is the case, a simulation is done on a cube whose side was 8a, instead of 4a, discretized into a grid that was 64×64×64. The uniform spacing is equal to that of the case above; however, the initial distance from the cell membrane to the edge of the cube has increased from a to 3a. Thus the discontinuity in velocity is farther from the cell. Calculations are repeated on this new grid for G=0.2, and the difference (where the superscript indicates the length of the cube) between the two simulations at nondimensional time is given in Table I. The differences are about 1% and the comparison suggests that boundary effects are negligible in this case.
FIG. 2.
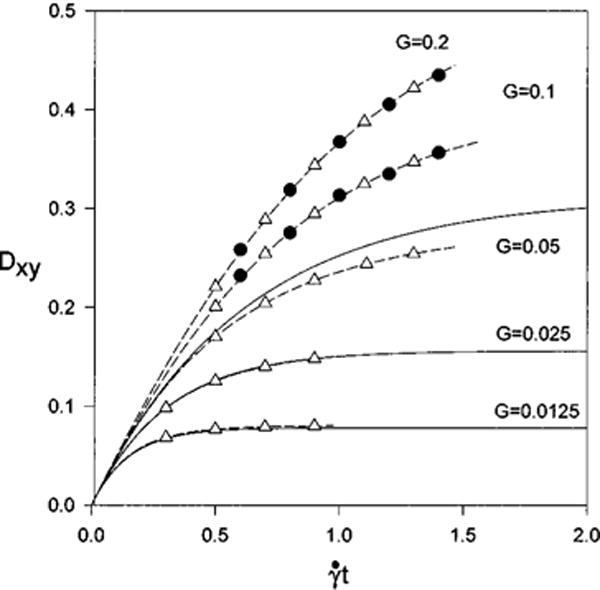
Validation for the neo-Hookean membrane model. The solid lines are linear theory (valid only for Gβ ≤1), Δ, immersed boundary method, ● are found using the boundary element method (Ref. 23).
TABLE I.
Effect of computational domain size on the deformation. The difference .
|
|
ε (%) | |
|---|---|---|
| 0.25 | 0.92 | |
| 0.50 | 1.05 | |
| 0.75 | 1.04 | |
| 1.00 | 0.99 | |
| 1.25 | 0.79 |
C. Spherical ghost cells
Spherical ghost cells are studied in order to further validate the numerical method and investigate characteristics of the RBC membrane that can be compared to linear theory. Evans and Skalak31 have developed a strain energy function for the RBC membrane which is fit to deformation measurements for human RBCs34
| (25) |
| (26) |
The strain energy function for the RBC membrane is expanded as a Taylor series, in the same manner as was done for the neo-Hookean material, to obtain the following coefficients of the quadratic function, Eq. (15),
| (27) |
These values used in Eq. (17) lead to the following equation for the shape evolution of spherical ghost cells (λ = 1)
| (28) |
The solution to Eq. (28) is
| (29) |
where
| (30) |
| (31) |
| (32) |
| (33) |
| (34) |
C1 and C2 are constants of integration in Eq. (29) that are chosen so that the initial values of K and J−K are zero. The properties that determine the characteristic parameter are viscosity of plasma η = 1.2 cP, radius of ghost cell a = 3.338×10⁻⁴ cm, and extension modulus, μRBC = 6×10⁻³ dyn/cm.
A grid refinement study is done for β = 10 and G = 0.01. The value of G was chosen so that the deformations are small but measurable and linear theory is valid. Calculations are done at a nondimensional time step on 32×32×32 (coarse grid) and 64×64×64 (fine grid) fluid grids, and at on the fine grid. The calculations are compared with the results of linear theory in Fig. 3. At the membrane shape begins to asymptotically approach a steady-state value and the calculations are terminated. The difference between the linear-theory value of Dxy at and that calculated on the coarse grid is 6.1%, while on the finer grid the difference is 0.20%. Time accuracy of the calculations is tested by halfing the time step on the fine grid. The results are nearly identical, with the difference in the final value of Dxy being 0.56%. The error is slightly larger for smaller time step because the time evolution of the shape parameter is not monotonic. A maximum is reached, and the steady-state value is approached from above. This characteristic is found for both the linear and nonlinear calculations and is attributed to the fact that the evolution depends on two time constants.
FIG. 3.
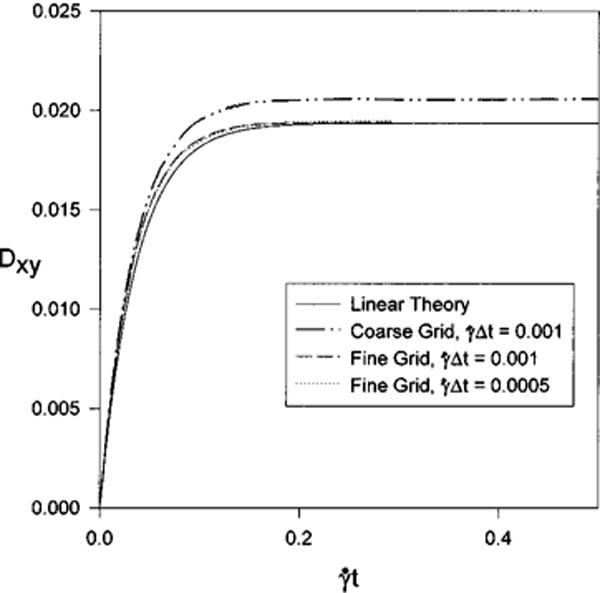
Validation for Evans-Skalak membrane model for G = 0.01 and β = 10. The difference between linear theory and the numerical simulations at are 6.1%, 0.20%, and 0.56% for (coarse and fine grids) and (fine grid).
In the calculations that follow, simulations are done with 7778 membrane nodes and a 64×64×64 fluid grid. At this level of discretization, approximately 10% of the CPU time is spent solving for the membrane forces, and about 90% is spent finding the fluid velocities. Thus we did not attempt to minimize the number of membrane nodes employed. The ratio of the extension to dilation moduli is fixed at β = 10 and the effect of increasing the characteristic parameter G is studied in this section. Five values of G = 0.01, 0.05, 0.1, 0.2, 0.5 are considered corresponding to shear rates of approximately 15, 75, 150, 300, 750 s−1 for the red blood cell ghost. These rates are in the range found under physiological conditions. The evolution of the shape parameter is shown in Fig. 4 and compared with linear theory, which is valid for β G ≪ 1, at low shear rates. The evolution of the orientation angle of the ghost cell u with respect to the streamlines is given in Fig. 4(b). At the lowest shear rate, G = 0.01, it appears that wobbling of the capsule occurs, along with tank treading, as the capsule approaches its equilibrium orientation. The orientation angle decreases as the shear rate and deformation of the ghost cell increase. Note that the time to reach a steady-state shape increases with G. The ratio of the deformed surface area to initial surface area, A/A0, maximum and minimum deformed element area to initial element area, E/E0, and final volume to initial volume, Vf/V0, are summarized in Table II. As the shear rate increases the local area changes increase indicating that a larger value of β is required to approach area conserving behavior. Also, the membrane tensions change from being partly compressive and partly tensile for G ≤ 0.1 to fully tensile for G > 0.1. A sphere is the shape of minimum surface area for a fixed volume. Enforcing local area conservation results in a cell that cannot deform.
FIG. 4.
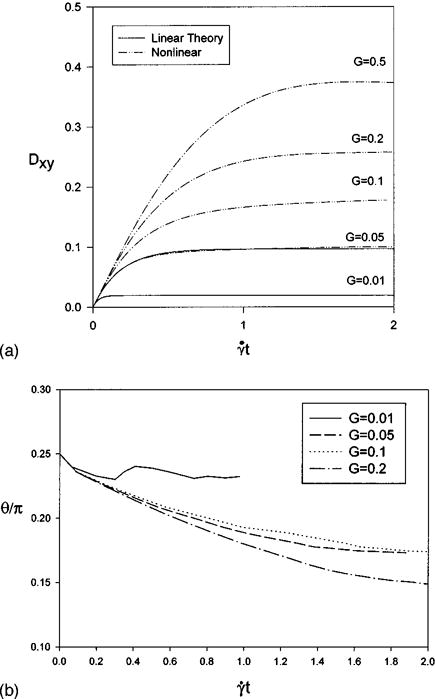
Evolution for β = 10 of (a) the deformation parameter (linear theory is valid only for Gβ ≤ 1) and (b) the orientation angle θ.
TABLE II.
Area and volume changes for increasing G for a sphere at β =10. The ratio of the deformed surface area to initial surface area, A/A0, maximum and minimum deformed element area to initial element area, E/E0, and final volume to initial volume, Vf/V0, are shown.
| G | AT | Emax | Emin | Vf |
|---|---|---|---|---|
| 0.01 | 1.0002 | 1.007 | 0.9917 | 1.000 |
| 0.05 | 1.006 | 1.033 | 0.9764 | 0.9994 |
| 0.1 | 1.019 | 1.048 | 0.9907 | 0.9987 |
| 0.2 | 1.042 | 1.078 | 1.006 | 0.9984 |
| 0.5 | 1.087 | 1.158 | 1.024 | 0.9986 |
V. OBLATE SPHEROIDAL CAPSULES
Initially spherical capsules have been simulated because their simple geometry allows analytical methods to yield deformations histories. Here we simulate a capsule whose initial shape is an oblate spheroid with a semimajor to semiminor axes ratio of 2:1. This shape is taken to be the strain free state. First we simulate the deformation of a neo-Hookean membrane and perform grid refinement studies to determine the numerical accuracy of the solutions. The Evans-Skalak model of the RBC membrane is then used to simulate ghost cells. Using the reported value of the dilational modulus results in an unstable system. The effect of increasing the dilational modulus at smaller values is studied and it is shown that local deformations are small and a good approximation of RBC membrane behavior can be obtained.
A. Neo-Hookean membrane
An oblate spheroidal membrane with a semimajor to semiminor axes ratio of 2:1 is discretized into the planar triangular elements described above. The dimensionless shear rate is define by Eq. (30) using as the reference length the radius of the sphere with the same volume. The quadratic form of the strain energy function with neo-Hookean coefficients, and initial inclination angle, θ = π/4 are employed. These parameters were chosen to compare the deformation histories with those calculated using the BEM under the same conditions. A fluid grid that is 64×64×64 and membrane discretization of 7778 nodes and 15 552 elements was employed.
Deformation histories are calculated for three shear rates and are shown in Fig. 5 as solid lines. The calculations were done for . Results taken from the calculations using the boundary element method with 128 nodes on the spheroid surface (Fig. 13a, p. 146 of Ref. 23) are shown as solid circles. In every case the immersed boundary method predicts smaller equilibrium deformations than the BEM. The relative difference increases with shear rate G, and for G = 0.1 at , Dxy is 0.50 and 0.45 for the BEM and immersed boundary methods, respectively.
FIG. 5.
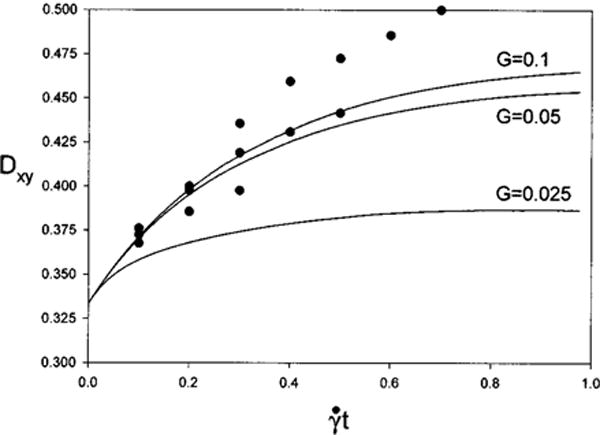
Deformation histories for a 2:1 oblate spheroid for G = 0.025, 0.05, 0.1. Solid lines are immersed boundary method. ●, BEM (Ref. 23).
A grid refinement study was conducted at the smallest strain rate, G = 0.025, to determine if numerical errors lead to the difference between the two methods. The results are shown in Fig. 6. The steady-state deformation from the simulation above is taken as the reference case and differences are calculated as . First a coarser fluid grid, 32×32×32 with the original membrane discretization was used and resulted in a smaller steady-state deformation that differed by −3.1%. Then, on the 64×64×64 fluid grid, a finer membrane discretization (60 002 nodes, 120 000 elements) was employed. The steady-state deformation differs only by 0.15% but requires 33% more CPU time. Finally, the simulation is performed on a 128×128×128 fluid grid with the original membrane grid. In this case the steady-state deformation differs by 20.15% but required approximately 350% more CPU time to reach a nondimensional time of . The results show that the numerical error using the immersed boundary calculations at G = 0.025 is small. Numerical accuracy studies were not reported for initially spheriodal cells using the BEM in Ref. 23.
FIG. 6.
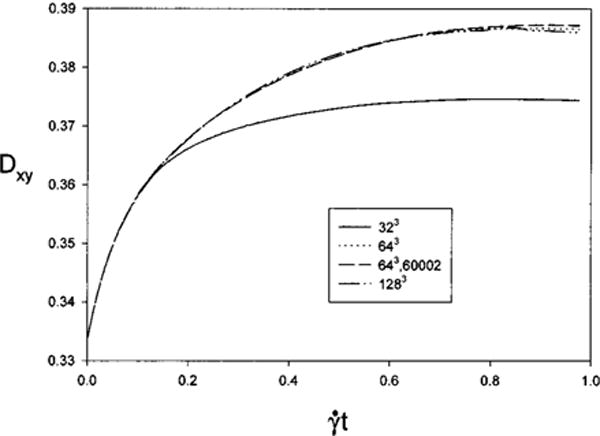
Grid refinement study for 2:1 oblate spheroid with neo-Hookean membrane at G = 0.025.
B. Oblate spheroidal ghost cell
Instabilities are encountered when simulating capsule deformation using the Evans-Skalak strain energy function with the reported values of the elastic parameters. Deformation histories are calculated using the reported value of the extensional modulus, μRBC, and values of the dilational modulus, KRBC, at which the time step required for numerical stability is reasonable.
The same discretizations (fluid grid: 64×64×64; membrane: 7778 nodes, 15 552 elements) of the fluid domain and oblate 2:1 spheroid are used here. Using as the reference length the radius of the sphere of equal surface area, the nondimensional shear rate is given by Eq. (30). The fluid strain-rate simulated, G = 0.03, corresponds to 50 s−1 for the RBC. The effect of increasing the dilational modulus using the full strain energy function is studied by calculating the deformation history for β = 10,20,40,60,80,100. Refinement of the fluid grid is carried out for β of 60 and 100. It is shown in Fig. 7(a) that as β increases the equilibrium deformation decreases monotonically. A simulation is performed using the full Hookean strain energy function setting Eh/3 = μRBC so that the membranes have effectively the same extensional modulus for small deformations. The Hookean membrane is more compliant than the Evans-Skalak model of the RBC. Evolution of the orientation angle for the Hookean membrane and the Evans-Skalak membrane with β = 100 are shown in Fig. 7(d). The similarity of the curves indicates that the orientation angle is weakly dependent on the dilational modulus.
FIG. 7.
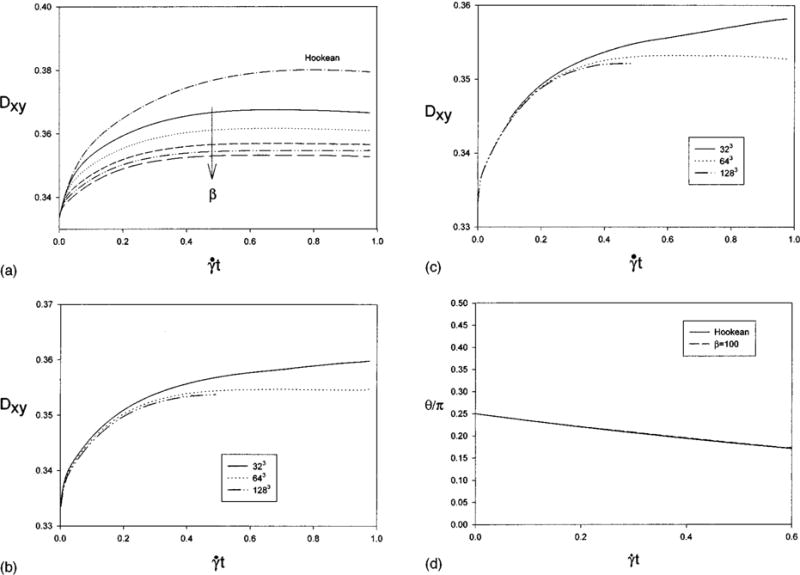
Effect of increasing dilational modulus. Deformation histories for a 2:1 oblate spheroid with neo-Hookean membrane and Evans-Skalak membrane with increasing dilational modulus, (β = 10,20,40,60.80,100), at . (a) 64×64×64 fluid grid, (b) grid refinement for β = 60, (c) grid refinement for β = 100, (d) the orientation angle θ.
The grid refinement studies shown in Figs. 7(b) and 7(c) show that error in the change in Dxy from the quiescent state, , given by is large on the coarse grid (20%, 28%) but the difference at equilibrium between the calculations on standard grid and the fine grid is (4.7%, 3.2%) for β = 60,100, respectively. The ratio of the deformed surface area to initial surface area, A/A0, maximum and minimum deformed element area to initial element area, E/E0, and final volume to initial volume, Vf/V0, are summarized in Table III. Note that although deformation and change in surface area decrease monotonically with increasing β (dimensionless dilational modulus) the changes in individual elements show no pattern and are in fact largest for β = 100 on the standard grid.
TABLE III.
Area and volume changes for increasing β for an initially oblate spheroid 2:1 at GRBC=0.03, . The ratio of the deformed surface area to initial surface area, A/A0, maximum and minimum deformed element area to initial element area, E/E0, and final volume to initial volume, Vf/V0, are shown.
| β,(grid) | AT | (E/E0)max | (E/E0)min | Vf |
|---|---|---|---|---|
| 10 | 1.0046 | 1.0317 | 0.9761 | 0.998 |
| 20 | 1.0029 | 1.0372 | 0.9730 | 0.998 |
| 40 | 1.0018 | 1.0330 | 0.9698 | 0.998 |
| 60,323 | 1.0012 | 1.0339 | 0.9738 | 0.998 |
| 60,643 | 1.0013 | 1.0290 | 0.9754 | 0.998 |
| 60,1283 | 1.0016 | 1.0133 | 0.9880 | 0.999 |
| 80 | 1.0010 | 1.0240 | 0.9783 | 0.998 |
| 100,323 | 1.0008 | 1.0300 | 0.9731 | 0.998 |
| 100,643 | 1.0007 | 1.0425 | 0.9554 | 0.998 |
| 100,1283 | 1.0010 | 1.0243 | 0.9762 | 0.998 |
A better picture of local area conservation is given when the deformation in the equilibrium configuration of all elements (15 552) is examined. A strain histogram is created in the following manner. The percent change in area of each element Eh = (E/E0−1)*100% is calculated. The range of elemental area changes is divided into sectors, centered at zero. If Eh of an element falls in a sector, then its initial area normalized by the initial total surface area, E0/A0, is added to the running total for that sector. Once all elements have been grouped in this fashion, the sum of the weighted elemental area for all sectors is unity. The sum of the weighted elemental area for a single sector gives the proportion of the undeformed surface area that falls within that deformation range. Thus a perfectly locally area conserving membrane would have a value of 1 for −ε≤Eh≤ε and zero elsewhere. The strain histograms are found for the membrane deformation study above and selected cases are shown as curves to facilitate their comparison in Fig. 8(a) and all cases are summarized in Table IV. The histograms are not symmetrical and skewed towards tensile strain. For large β the maximum of the histogram is located at zero. As β increases the membrane becomes stiffer and for the same deformation exerts more stress on the fluid. This causes a larger jump in the fluid shear across the membrane and requires a finer fluid grid to capture the gradients in the fluid velocities. Increased area conservation is shown for β = 60 and 100 in Figs. 8(b) and 8(c), respectively, with grid refinement. Note that with grid refinement the maximum and minimum area changes (extension and compression) of a single element decrease in magnitude. Local area conservation is best on the finest grid with β = 60, with 98.9% of the original area having local deformations of less than ±0.75% and all local deformations being less than 1.4%. For β = 100, 95.8% of the original area has local deformations of less than ±0.75%, as seen in Table IV. The area histograms calculated on the standard and fine grid are still somewhat different, indicating that better results could be obtained on a still finer grid. We did not do this due to the larger amount of computing time and memory required.
FIG. 8.
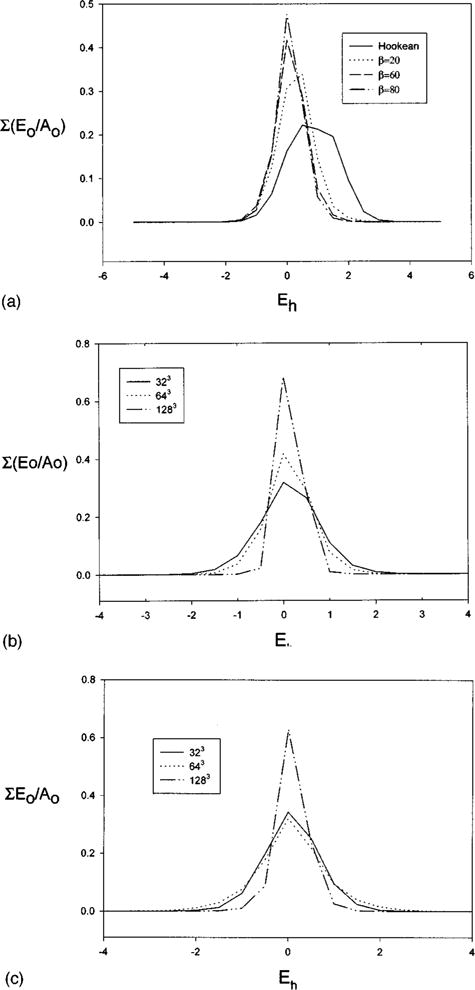
Strain histograms for equilibrium shape at G = 0.03 for the Hookean membrane and Evans-Skalak membrane with increasing dilational modulus, (β = 20,60,80). The abscissa is the percentage change in an elements area. Eh = (E/E0−1) and is centered at zero. Each bin has a width of 0.5%. The normalized unstrained area of an element, E0/A0, are added for each range of equilibrium strains. The sum of all bins is 1 for each case. Note that for a locally area conserving membrane all elements would have zero deformation and the coordinate value would be 1. (a) 64×64×64 fluid grid, (b) grid refinement for β = 60, (c) grid refinement for β = 100.
TABLE IV.
Summary of strain histogram for increasing β where Eh=(E/E0−1)*100% is the percent change in the area of a single element. Entries are the proportion of the undeformed cell membrane area whose equilibrium deformation falls in the given range.
| β, grid | 0<|Eh|≤0.75 | 0.75<|Eh|≤1.75 | 1.75<|Eh|≤2.75 | 2.75<|Eh|≤3.75 | 3.75<|Eh|≤4.75 |
|---|---|---|---|---|---|
| 10 | 0.6725 | 0.3064 | 2.076×10⁻² | 4.246×10⁻⁴ | 0 |
| 20 | 0.7731 | 0.2144 | 1.226×10⁻² | 1.963×10⁻⁴ | 0 |
| 40 | 0.8263 | 0.1671 | 6.343×10⁻³ | 2.713×10⁻⁴ | 0 |
| 60,323 | 0.7627 | 0.2229 | 1.352×10⁻² | 8.881×10⁻⁴ | 0 |
| 60,643 | 0.8629 | 0.1337 | 3.396×10⁻³ | 0 | 0 |
| 60,1283 | 0.9897 | 1.026×10⁻² | 0 | 0 | 0 |
| 80 | 0.9023 | 9.625×10⁻² | 1.456×10⁻³ | 0 | 0 |
| 100,323 | 0.7953 | 0.1957 | 8.865×10⁻³ | 1.592×10⁻⁴ | 0 |
| 10,643 | 0.7204 | 0.2404 | 3.600×10⁻² | 2.822×10⁻³ | 3.604×10⁻⁴ |
| 100,1283 | 0.9577 | 4.125×10⁻² | 1.046×10⁻³ | 3.517×10⁻⁵ | 0 |
C. Tank treading behavior
No-slip conditions at the membrane cause it to move with the local velocity field. Since the membrane is flexible and encloses a fluid, the capsule/cell does not necessarily tumble as a rigid body. The membrane which is a closed streamline at steady state rotates continuously without changing shape. This behavior is called tank treading and has been observed for red blood cells.6,7 We calculate the period it takes for the membrane to complete one rotation about its equilibrium shape in the following manner. The cross section of the cell in the plane of shear is found at two different time steps that differ by Δt. Elements that cross the plane of shear in both configurations are identified and their radial position (n denotes time step, i denotes element) is calculated. The radial velocity as a function of radial position (ϕ)ave is interpolated with the following:
| (35) |
| (36) |
About 280–300 elements were found to cross the plane of shear. We find the period of rotation τ by integrating these curves using periodic boundary conditions
| (37) |
Here we are assuming that the node moves at the average velocity while moving from (ϕi)ave to (ϕi+1)ave. The results are shown in Table V for the oblate spheroid ghost cell at the values of β simulated. Note that the period decreases with increasing dilational modulus, and on the finest grid the periods are 16.5 and 16.1 nondimensional time units for β = 60,100, respectively. This indicates that the tangential velocities along the membrane and the strength of the circulation are increasing.
TABLE V.
Tank treading period for increasing β.
VI. BICONCAVE DISCOID
Spheroidal cells can be created through osmotic swelling, but the quiescent shape of a normal RBC is a biconcave discoid. Evans and Fung35 developed the following equation to describe the cross section of this shape:
| (38) |
where
The x and y coordinates of cross section are given by
| (39) |
The discoid is scaled so that its area is 140 μm2 and is discretized into 7842 nodes and 15 680 elements. Several simulations were performed for various shear rates with neo-Hookean and Evans-Skalak (β=10) membranes. We were not able to obtain steady-state solutions but were able to follow the deformation histories for up to . The profiles in the plane of shear for a discoid with initial inclination angle θ=0 at (GRBC=0.583, ) are shown in Fig. 9 for . Before the simulations become unstable the total area has increased by 5.25%, (E/E0)max=1.31 and (E/E0)min=0.676. The simulations become unstable when local radii of curvature become small and the membrane appears to begin to buckle or fold. Secomb et al.13 have obtained steady-state axisymmetric shapes with cusps having neglected the bending stiffness of the RBC membrane. Although the bending stiffness of the RBC is small, kc=10−12 erg,34 it is necessary to smooth out the deformations and prevent buckling.
FIG. 9.
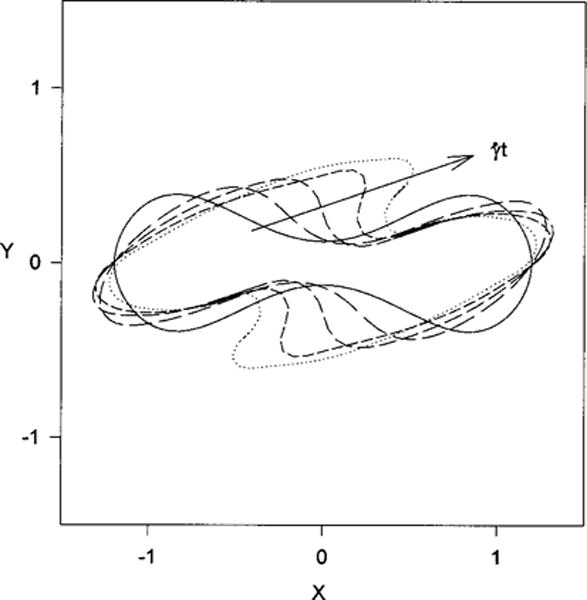
Membrane profiles in the plane of shear for an initially biconcave discoid at an orientation angle θ=0. Profiles are shown at , for G=0.583, .
VII. DISCUSSION
These are the first three-dimensional simulations of finite membrane deformation using the strain energy function for the red blood cell. In our attempt to numerically solve the coupled fluid–membrane deformation using the measured value of the dilational modulus for the RBC we found a system that is numerically unstable at reasonable time steps. We have shown that when smaller values of the dilational modulus are used, local area changes are small and RBC membrane behavior should be well approximated. However, this study raises the following questions. First, for the case of the oblate spheroid as KRBC→∞, is the asymptotic deformation zero or finite? Second, what is the appropriate value of the dilational modulus for dynamic deformations of the RBC membrane?
The first question can be taken as purely mathematical in nature: whether under the constraints of fixed volume and local area conservation (therefore total surface area conservation) the surface area enclosing the given volume can deform. Not only must the initial and final shapes meet these constraints, but so must all the intermediate deformations during the evolution of the shape.
This leads us to ask if it is appropriate to model the red blood cell as absolutely locally area conserving under dynamic deformations. In reality deformations of the RBC membrane are not as severely constrained. The dilational modulus is measured by deforming an osmotically swollen sphere, which is not possible under volume and local area constraints. Under micropipette aspiration, the RBC membrane area increases by about 4% before hemolysis (membrane rupture). The area change is global, not local in nature. Physically a finite number of lipid molecules must cover a larger area. The average area per molecule must increase. It has also been shown that under static deformations there is up to a 10% variation in lipid density, as well as cytoskeletal rearrangement.36 These observations imply that KRBC and μRBC are not spatially uniform. It may then be possible that these parameters may vary under dynamic deformations. Also, even larger (>4%) local deformations can be sustained. Here under dynamic deformations local area changes were less than 1% in magnitude. Local and total area changes under dynamic deformations have not been measured. It is assumed that since the measured value of KRBC is very large that smaller local area changes are better approximations of RBC membrane behavior. Also, the RBC membrane is permeable so the constraint of constant volume may be too stringent. It is possible that deformations are accompanied by a flux of water through the membrane that may be passive or assisted by active pumping mechanisms within the membrane.
The importance of these questions depends on the motivation for studying red blood cell deformation. Two reasons for studying fluid–membrane interactions are to further our understanding of mass transport and to predict hemolysis. If one is interested in purely diffusive mass transport, then it is only necessary to have a good approximation of the cell shape. In order to understand the role of convective mass transport it is important to correctly predict the velocity field which is coupled to the membrane tensions. Predicting membrane tension evolution is necessary for analysis of hemolysis.
VIII. CONCLUSIONS
The immersed boundary method has been successfully applied to the simulation of deforming capsules. The method is validated through comparison with linear theory for the deformation of initially spherical capsules with both neo-Hookean and Evans-Skalak membrane models. Initially oblate spheroidal capsule deformations have been calculated for varying dilational modulus. When the red blood cell membrane is approximated using the Evans-Skalak model with a ratio of dilation modulus to extensional modulus KRBC/μRBC significantly smaller than the measured value, local area changes are less than 1%. It is interesting to note that for the chosen values of the parameter β(β=60–100), the predicted total area changes are very small, less than 0.17%, and are probably beyond experimental resolution. As the shear rate increases, the dilation modulus required to keep local area changes small increases as well. Capsules in shear flow have been shown to tank tread. Bending stiffness must be included in order to simulate more complex shapes.
Acknowledgments
Support for this work was provided by NIH Grants No. HL18292 and No. HL52864. The authors are very grateful to Professor C. S. Peskin for providing us with his source code and for constructive advice in implementing the immersed boundary method for the study of membrane–fluid flow interaction.
References
- 1.Chien S, Usami S, Skalak R. Handbook of Physiology. IV. American Physiological Society; Bethesda, MD: 1980. Sec. 2, Chap. 6. [Google Scholar]
- 2.Artmann GM, Li A, Ziemer J, Schneider G, Sahm U. A photometric method to analyze induced erythrocyte shape changes. Biorheology. 1996;33:251. doi: 10.1016/0006-355X(96)00020-0. [DOI] [PubMed] [Google Scholar]
- 3.Wang CH, Popel AS. Effect of red blood cell shape on oxygen transport in capillaries. Math Biosci. 1993;116:89. doi: 10.1016/0025-5564(93)90062-f. [DOI] [PMC free article] [PubMed] [Google Scholar]
- 4.Chien S, Usami S, Dellenback RJ, Gregersen MI. Shear-dependent deformation of erythrocytes in rheology of human blood. Am J Physiol. 1970;219:136. doi: 10.1152/ajplegacy.1970.219.1.136. [DOI] [PubMed] [Google Scholar]
- 5.Carr R, Cokelet GR. Rheology of suspensions of normal and hardened erythrocytes and their mixtures. J Rheol. 1981;25:67. [Google Scholar]
- 6.Schmid-Schönbein H, Wells R. Fluid drop-like transition of erythrocytes under shear. Science. 1969;165:288. doi: 10.1126/science.165.3890.288. [DOI] [PubMed] [Google Scholar]
- 7.Fischer TM, Stöhr-Liesen M, Schmid-Schönbein H. The red cell as a fluid droplet: tank tread-like motion of the human erythrocyte membrane in shear flow. Science. 1978;202:894. doi: 10.1126/science.715448. [DOI] [PubMed] [Google Scholar]
- 8.Keller SR, Skalak R. Motion of a tank-treading ellipsoidal particle in shear flow. J Fluid Mech. 1982;120:27. [Google Scholar]
- 9.Mazeron P, Muller S, El Azouzi H. Deformation of erythrocytes under shear: a small-angle light scattering study. Biorheology. 1997;34:99. doi: 10.1016/S0006-355X(97)00007-3. [DOI] [PubMed] [Google Scholar]
- 10.Chang KS, Olbrecht WL. Experimental studies of the deformation of a synthetic capsule in extensional flow. J Fluid Mech. 1993;250:587. [Google Scholar]
- 11.Chang KS, Olbrecht WL. Experimental studies of the deformation and breakup of a synthetic capsule in steady and unsteady simple shear flow. J Fluid Mech. 1993;250:609. [Google Scholar]
- 12.Zarda P, Chien S, Skalak R. Computational Methods for Fluid-Structure Interaction Problems. ASME; New York: 1977. Interaction of viscous incompressible fluid with an elastic body; p. 65. [Google Scholar]
- 13.Secomb TW, Skalak R, Özkaya N, Gross JF. Flow of axisymmetric red blood cells in narrow capillaries. J Fluid Mech. 1986;163:405. [Google Scholar]
- 14.Hsu R, Secomb TW. Motion of nonaxisymmetric red blood cells in cylindrical capillaries. J Biomech Eng. 1989;111:147. doi: 10.1115/1.3168356. [DOI] [PubMed] [Google Scholar]
- 15.Usami S, Chien S. Shear deformation of red cell ghosts. Biorheology. 1973;10:425. doi: 10.3233/bir-1973-10316. [DOI] [PubMed] [Google Scholar]
- 16.Barthes-Biesel D. Motion of a spherical microcapsule freely suspended in a linear shear flow. J Fluid Mech. 1980;100:831. [Google Scholar]
- 17.Barthes-Biesel D, Rallison JM. The time-dependent deformation of a capsule freely suspended in a linear shear flow. J Fluid Mech. 1981;113:251. [Google Scholar]
- 18.Brunn PO. The deformation of a viscous particle surrounded by an elastic shell in a general time dependent linear flow field. J Fluid Mech. 1983;126:533. [Google Scholar]
- 19.Barthes-Biesel D, Sgaier H. Role of membrane viscosity in the orientation and deformation of a spherical capsule suspended in shear flow. J Fluid Mech. 1985;160:119. [Google Scholar]
- 20.Rao PR, Zahalak GI, Sutera SP. Large deformations of elastic cylindrical capsules in shear flows. J Fluid Mech. 1994;270:73. [Google Scholar]
- 21.Li XZ, Barthes-Biesel D, Hemly A. Large deformations and burst of a capsule freely suspended in an elongational flow. J Fluid Mech. 1988;187:179. [Google Scholar]
- 22.Leyrat-Maurin A, Drochon A, Barthes-Biesel D. Flow of a capsule through a constriction: application to cell filtration. J Phys III. 1993;3:1051. [Google Scholar]
- 23.Pozrikidis C. Finite deformation of liquid capsules enclosed by elastic membranes in simple shear flow. J Fluid Mech. 1995;297:123. [Google Scholar]
- 24.Zhou H, Pozrikidis C. Deformation of liquid capsules with incompressible interfaces in simple shear flow. J Fluid Mech. 1995;283:175. [Google Scholar]
- 25.Peskin CS. Numerical analysis of blood flow in the heart. J Comput Phys. 1977;25:220. [Google Scholar]
- 26.Peskin CS, McQueen DM. A three dimensional computational method for blood flow in the heart. I. Immersed elastic fibers in a viscous incompressible fluid. J Comput Phys. 1989;81:372. [Google Scholar]
- 27.Unverdi SO, Tryggvason G. Computations of multi-fluid flows. Physica D. 1992;60:70. [Google Scholar]
- 28.Haj-Hariri H, Shi Q, Borhan A. Thermocapillary motion of deformable drops at finite Reynolds and Marangoni numbers. Phys Fluids. 1997;9:845. [Google Scholar]
- 29.Sulsky D, Brackbill JU. A numerical method for suspension flow. J Comput Phys. 1991;96:339. [Google Scholar]
- 30.Dillon R, Fauci L, Fogelson A, Gaver D. Modeling biofilm processes using the immersed boundary method. J Comput Phys. 1996;129:57. [Google Scholar]
- 31.Evans EA, Skalak R. Mechanics and Thermodynamics of Biomembranes (CRC, Boca Raton, FL. 1980 [Google Scholar]
- 32.Charrier JM, Shrivastava S, Wu R. Free and constrained inflation of elastic membranes in relation to thermoforming non-axisymmetric problems. J Strain Anal. 1989;24:55. [Google Scholar]
- 33.Shrivastava S, Tang J. Large deformation finite element analysis of non-linear viscoelastic membranes with reference to thermoforming. J Strain Anal. 1993;28:31. [Google Scholar]
- 34.Mohandas N, Evans EA. Mechanical properties of the red cell membrane in relation to molecular and structure genetic defects. Annu Rev Biophys Biomol Struct. 1994;23:787. doi: 10.1146/annurev.bb.23.060194.004035. [DOI] [PubMed] [Google Scholar]
- 35.Evans EA, Fung YC. Improved measurements of the erythrocyte geometry. Microvasc Res. 1972;4:335. doi: 10.1016/0026-2862(72)90069-6. [DOI] [PubMed] [Google Scholar]
- 36.Discher D, Mohandas N, Evans EA. Molecular maps of red cell deformation: hidden elasticity and in situ connectivity. Science. 1994;266:1032. doi: 10.1126/science.7973655. [DOI] [PubMed] [Google Scholar]


