Abstract
Discrepancies exist between the preferred temperature range for mice (26 to 32 °C) and current recommendations (20 to 26 °C), which may alter metabolism and negatively affect studies using mice. Previous research indicates that nesting material can alleviate cold stress in mice; therefore, we sought to determine the effects of the amount of nesting material provided (0, 6, or 12 g) on heat energy loss and energy balance in 3 mouse strains housed at currently recommended temperatures during the daytime, a period of presumed inactivity. Groups of BALB/cAnNCrl, C57BL/6NCrl, and Crl:CD1(ICR) mice, balanced by strain and sex, were group-housed and provided 0, 6, or 12 g of nesting material. After a 3-d acclimation period, body weight was determined daily at 0800, food intake was determined at 0800 and 2000, and total heat production was evaluated from 0800 to 2000 on 4 consecutive days and used to calculate energy balance and the respiratory quotient. Although the amount of nesting material had no overall effect on food intake or heat production, mice provided 12 g of nesting material had greater weight gain than those given 0 or 6 g. This increase in body weight might have been due to improved energy balance, which was corroborated by an increased respiratory quotient in mice provided 12 g of nesting material. In summary, although heat production did not differ, providing 12 g of nesting material improved energy balance, likely leading to an increase in body weight during the 0800–2000 testing period.
Abbreviations: BW, body weight; HP, heat production; RQ, respiratory quotient
Although animal housing and temperature requirements have been well-established by the Guide for the Care and Use of Laboratory Animals,16 numerous studies2-5,7,8,10 indicate that the currently recommended ambient temperature for mice (20 to 26 °C) may be below their lower critical temperature. When given a choice, mice spend more time overall at 30 °C, overwhelmingly so when inactive.2 As a result of the discrepancy between standard laboratory housing practices and the preferred thermoneutral zone of mice6 (26 to 34 °C), cold stress can occur, which may threaten overall animal wellbeing and alter metabolism. Because mild cold stress in mice can alter their physiologic state,5,8,25 housing mice in an environment below thermoneutrality could lead to errors in extrapolating physiologic, pharmacologic, and toxicologic findings from experimental rodent models to humans10,15 and negatively affect research integrity.3 Reevaluating and refining laboratory animal management practices and housing protocols is a crucial step in improving animal wellbeing, stabilizing metabolic rate, and increasing the repeatability and validity of scientific data generated using mouse models.
When ambient temperature falls below a mammal's lower critical temperature, metabolic rate is increased so that heat production by the body matches heat loss to the environment,6 leading to an increase in energy expenditure. Due to a high surface area to mass ratio, mice are particularly susceptible to cold stress, and their thermoregulatory system is easily affected by drugs, chemicals, and a variety of pathologic conditions that can be exacerbated by changes in ambient temperature.9 Although mice primarily rely on changing their metabolic heat production to regulate core body temperature,24 they can also respond behaviorally by huddling and nest building,6,20 which allows them to insulate themselves when performing behaviors that generate less metabolic heat (such as sleeping) compared with active behaviors.2 Consequently, multiple studies3-5,26 suggest that providing mice with suitable amounts of nesting material can improve thermal comfort and may normalize metabolic rate by reducing reliance on increasing metabolic heat production to maintain euthermia, especially during periods of inactivity. Therefore, the study objective was to determine the effect of the amount of nesting material (0, 6, or 12 g) on heat energy loss and energy balance in 3 common strains of mice, housed at currently recommended temperatures, during the daytime when mice are presumed to be in an inactive phase. We hypothesized that increasing the amount of available nesting material would decrease energy loss as heat and result in a more positive energy balance in laboratory mice during the daytime, regardless of strain.
Materials and Methods
Animals and pretreatment procedures.
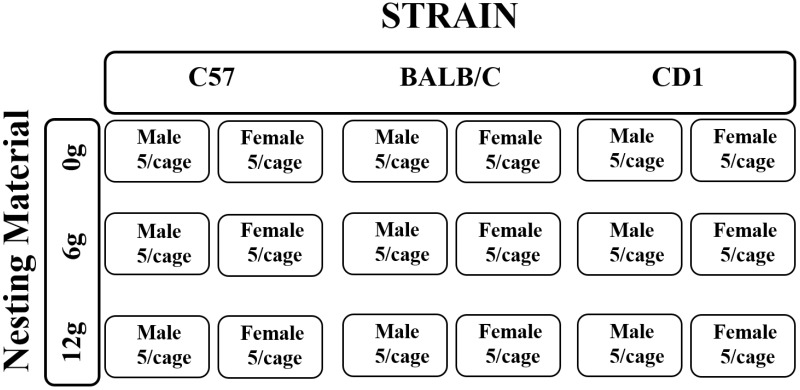
All procedures involving animal use were approved by the Purdue University's IACUC (protocol no. 4108001122). In 2 replicates, 36 groups (18 groups per replicate) of male and female BALB/cAnNCrl (6 groups of 5 mice [30 mice per replicate]; body weight [BW], 21.0 ± 0.1 g), C57BL/6NCrl (6 groups of 5 mice [30 mice per replicate]; BW, 21.9 ± 0.1 g), and Crl:CD1(ICR) (6 groups of 5 mice [30 mice per replicate]; BW, 30.9 ± 0.1 g) mice were shipped from Charles River Laboratories (Kingston, NY) at 7 wk of age. Mouse strains were selected to represent the inbred (C57 and BALB/C) and outbred (CD1) mice most commonly used in research.5 On arrival, mice were housed in groups of 5 according to sex and strain with no preplanned randomization scheme in standard laboratory polycarbonate shoebox-style cages (29.2 × 19.0 × 12.7 cm; Ancare, Bellmore, NY) where they remained until testing. During the pretesting period, each cage contained aspen shavings (Harlan TekLad, Madison, WI) and 2 cotton squares (Cotton squares; Ancare; Bellmore, NY). After a 1-wk acclimation period, 9 groups of 5 mice (3 cages per line or stock; age, 8 wk) were selected and housed in 9 calorimeters (37.3 × 23.4 × 14.0 cm; retrofit from disposable ventilated caging; Inovive, San Diego, CA), and this procedure was repeated for the remaining 9 groups of 5 mice (age, 9 wk) the following week. The calorimeter was considered the experimental unit, each replicate lasted 2 wk, and 18 total groups were tested in each replicate (Figure 1). Within each calorimeter, aspen shavings were provided as bedding and either 0, 6, or 12 g of nesting material (Enviro-Dri, FiberCore, Cleveland, OH) was added for each sex and strain combination (Figure 1). Previous studies by our lab determined that providing 8 to 10 g of nesting material reduced thermal stress, but female behavior indicated that more material might be required for thermal comfort.4,5 We chose this particular commercially available nesting substrate because of our previous experiences regarding the ability of mice to ubiquitously build with it13 and its utility in the reduction of thermal stress.4,5 Mice were allowed to acclimate to their respective calorimeter environments and build nests for 3 d prior to the start of the experiment. Unpublished data from our lab indicates that nest building peaks for all of these types of mice between the 3rd and 4th day and that nest quality is maintained for as long as 7 d. We observed that all mice provided nesting material built nests within the 3-d acclimation period. Within each calorimeter, mice received a standard commercial diet (no. 2018, Harlan, Woodland, CA; 18% crude protein, 3.1 kcal metabolizable energy per gram), and water was provided without restriction. All mice were maintained on a 12:12-h light:dark cycle (lights on, 0800 to 2000). Ambient temperature was maintained at 20.2 ± 0.8 °C, and relative humidity was 50.5% ± 8.2% throughout the study.
Figure 1.
Provision of nesting material in each replicate for each sex and strain combination. The same number of cages depicted here was used for both replicates. A total of 36 cages were tested.
Experimental procedures.
After the 3-d acclimation period, measurements began at 0800 on day 1 and continued for 4 d. Mice were weighed once daily at 0800, and food intake was determined twice daily (0800 and 2000). Total metabolic heat production per mouse (HP) was determined by using indirect calorimetry (Figure 2) as previously described.22 Briefly, prior to metabolic testing, system accuracies for O2 and CO2 measurements were evaluated by ethanol combustion.22 On the first day of testing after mice had acclimated to the calorimeters, Tedlar gasbags (Restek, Bellefonte, PA) were connected to the exhaust air of the calorimeters and continuously collected air samples over a 12-h period. In addition, exhaust air was collected from a separate, empty calorimeter for determination of O2 and CO2 concentrations in fresh air. Four samples were collected from each cage, one on each of 4 consecutive days during the daytime from 0800 to 2000 (one 12-h period per day) when mice were inactive. Total HP was calculated for each sample and then divided by the number of mice in the calorimeter to estimate HP per mouse over the 12-h testing period. Furthermore, HP per mouse was divided by the average BW of mice to determine HP per g of BW.
Figure 2.
Negative-pressure indirect calorimetry system.
Gas analysis and calculations.
O2 levels in calorimeter exhaust air samples were measured by using a calibrated paramagnetic O2 analyzer (model 600P, California Analytical Instruments, Orange, CA), and CO2 levels were evaluated by using a calibrated infrared CO2 sensor (model GMT221, Vaisala Oyj, Helsinki, Finland). Total metabolic HP per mouse was calculated by using the following formula:22
The respiratory quotient (RQ) per mouse was calculated as:
and energy balance per mouse was calculated as:
Statistics.
Analyses of BW, FI, HP, RQ, and energy balance were performed as split-plot ANOVA using generalized linear modeling, in JMP 10 statistical software for Windows (SAS Institute, Cary, NC). The assumptions of generalized linear modeling (normality of error, homogeneity of variance, and linearity) were confirmed posthoc.11 Significant effects were then analyzed by using posthoc Tukey tests; the α level was 0.05. To avoid pseudoreplication and accommodate repeated measures, analyses were blocked by cage of mice and nested within strain, sex, and nesting treatment. Mean BW was calculated from the cage total body weight / the number of mice in the cage. Due to data entry errors, some data points were omitted and data were not treated as orthogonal. A full-factorial model was tested first; when higher order interactions were not significant, they were removed from the model. Food intake (total cage consumption / number of mice in the cage) and RQ were log-transformed to meet assumptions of normality; those data are presented as raw means. All other data are presented as least-squares mean ± SE, and statistical significance was defined as a P value of 0.05 or less.
Results
BW and food intake.
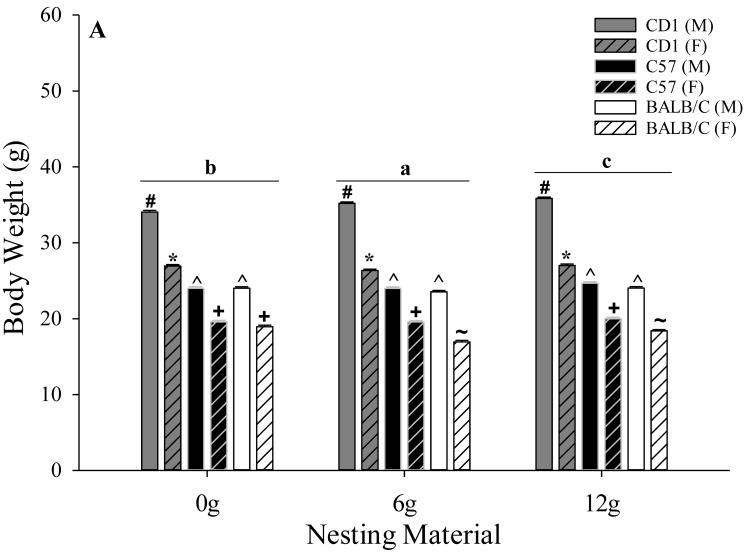
Mice provided with 12 g of nesting material maintained a greater (P < 0.01) overall BW (25.0 ± 0.1 g) compared with those given 0 g (24.6 ± 0.1 g) or 6 g (24.2 ± 0.1 g) of nesting material (Figure 3). A strain-associated effect was observed for BW, where CD1 mice weighed more (P < 0.01; 30.9 ± 0.1 g) than C57 (21.9 ± 0.1 g) and BALB/C (20.9 ± 0.1 g) mice, and C57 mice had a greater BW than BALB/C mice (Figure 3). Overall, BW was greater in male mice (P < 0.01; 27.7 ± 0.1 g) than female mice (21.5 ± 0.1 g; Figure 3). A nesting material×sex effect was observed (P = 0.01), where male mice provided 12 g of nesting material weighed more (28.2 ± 0.1 g) compared with those provided 6 g (27.6 ± 0.1 g) or 0 g (27.4 ± 0.1 g), and female mice provided 12 or 0 g of nesting material weighed more (21.8 ± 0.1 g and 21.8 ± 0.1 g, respectively) compared with those given 6 g (21.0 ± 0.1 g; Figure 3). No other BW differences were observed with any comparison.
Figure 3.
Effects of nesting material (0, 6, or 12 g), strain (CD1, C57, BALB/C), and sex (male and female) on body weight (g) in mice during a phase of presumed inactivity (0800 to 2000). Data are given as mean ± 1 SE. Different letters (a, b) indicate overall differences (P < 0.05) associated with nesting material treatment, and symbols (*, ^, #, +, ~) indicate strain- and sex-associated differences (P ≤ 0.05) within nesting-material treatments.
No difference in food intake was detected from 0800 to 2000 or from 2000 to 0800 (P = 0.42) when comparing between nesting-material treatments (0.76 ± 0.06 g and 2.17 ± 0.06 g, respectively; data not shown). Overall, mice consumed more food (P < 0.01) from 2000 to 0800 compared with 0800 to 2000 (data not shown). Strain×time differences were detected for food intake, where C57 mice consumed less food (0.43 ± 0.03 g daily; P < 0.01) than did CD1 (0.78 ± 0.05 g daily) and BALB/C (0.99 ± 0.08 g daily) mice from 0800 to 2000, and BALB/C mice consumed less food (1.76 ± 0.08 g) than C57 (2.34 ± 0.11 g) and CD1 (2.51 ± 0.12 g) mice from 2000 to 0800 (data not shown). Male mice consumed more food (2.43 ± 0.08 g) than did female mice (1.91 ± 0.08 g; P = 0.01) from 2000 to 0800 (data not shown). No other differences in food intake emerged with any comparison.
Metabolic heat production.
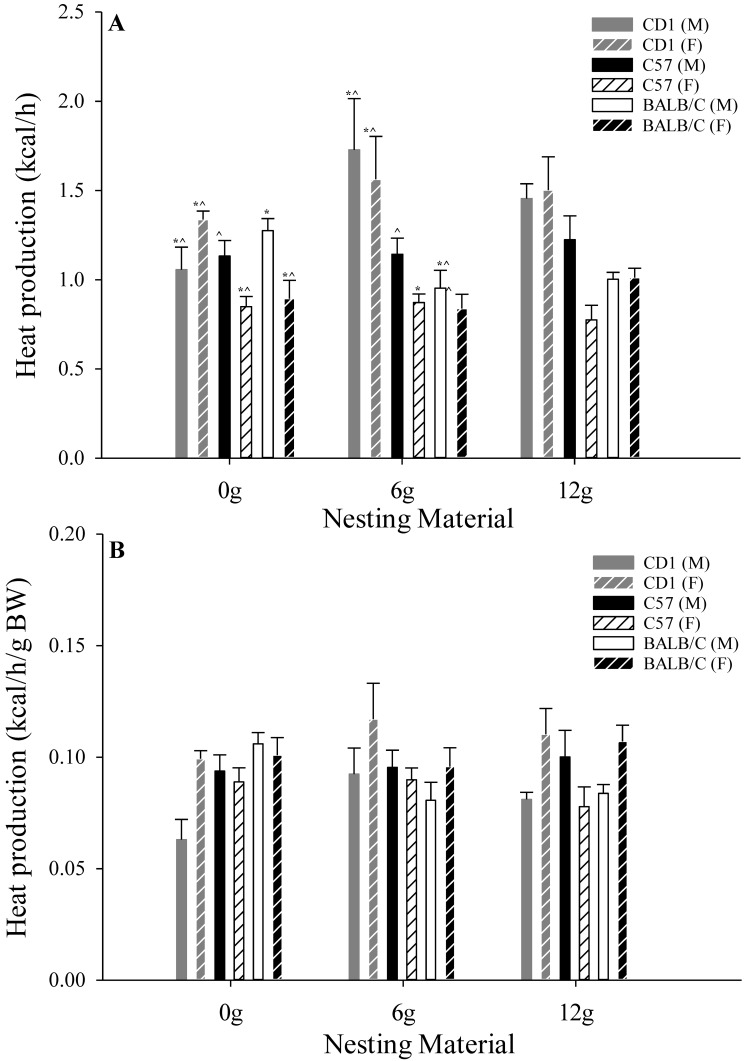
Nesting material treatment was not associated with any overall differences (P > 0.20) in total HP (2.30 ± 0.07 kcal/h) or HP per g of BW (0.09 ± 0.01 kcal/h/g BW; Figure 4). Although male mice had greater total HP (P = 0.01; 2.46 ± 0.07 kcal/h) than female mice (2.15 ± 0.07 kcal/h), HP per g of BW was reduced (P = 0.01) in male (0.09 ± 0.01 kcal/h/g BW) compared with female (0.10 ± 0.01 kcal/h/g BW) mice (Figure 4). A strain-associated effect was detected, where CD1 mice had greater total HP (P = 0.01; 2.92 ± 0.08 kcal/h) compared with C57 (2.00 ± 0.08 kcal/h) and BALB/C (1.99 ± 0.08 kcal/h) mice; however HP per g BW did not differ between strains (Figure 4). Nesting material treatment×strain differences were detected, where total HP was greater (P = 0.01) in CD1 mice provided 12 g and 6 g of nesting material compared with all other combinations (Figure 4). Furthermore, CD1 mice provided 6 g of nesting material had greater (P = 0.01) HP per g BW compared with CD1 mice provided 0 g (Figure 4). No other differences regarding total HP or HP per g BW were detected.
Figure 4.
Effects of nesting material (0, 6, or 12 g), strain (CD1, C57, BALB/C), and sex (male and female) on (A) total metabolic heat production (kcal/h) and (B) metabolic heat production per g of body weight in mice during a phase of presumed inactivity (0800 to 2000). Data are given as mean ± 1 SE. Symbols (*, ^, #) indicate strain- and sex-associated differences (P ≤ 0.05) within nesting-material treatments.
Energy balance and RQ.
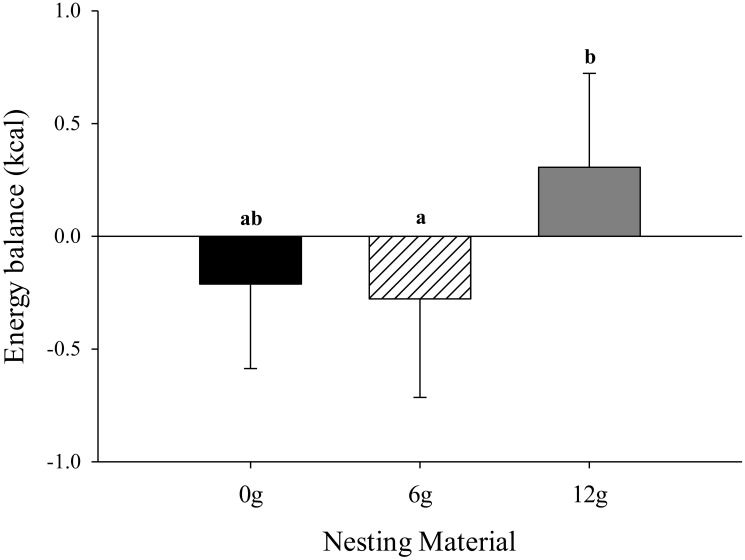
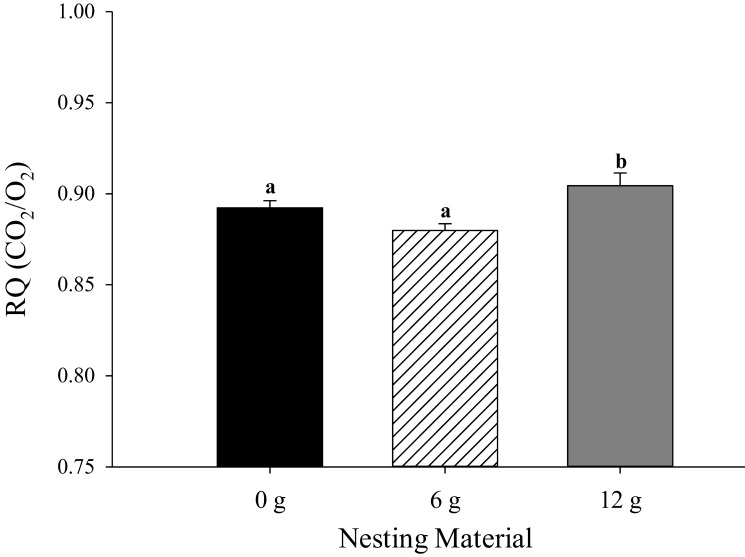
Mice provided 12 g of nesting material maintained a more positive energy balance (P = 0.03; 0.30 ± 0.17 kcal) compared with those given 0 g (–0.16 ± 0.17 kcal) or 6 g (–0.30 ± 0.17 kcal), regardless of sex or strain (Figure 5). A strain-associated effect was detected for energy balance, where BALB/C mice had a more positive energy balance (P = 0.01; 1.10 ± 0.17 kcal) compared with CD1 (–0.56 ± 0.17 kcal) and C57 (–0.71 ± 0.17 kcal) mice (data not shown). RQ was lower in mice that were provided 0 or 6 g of nesting material (P = 0.01; 0.86 ± 0.01 and 0.86 ± 0.01, respectively) compared with mice that were provided 12 g (0.91 ± 0.02; Figure 6). Male mice had a lower RQ (P = 0.01; 0.84 ± 0.01) compared with female mice (0.91 ± 0.01; data not shown). No other differences regarding energy balance or RQ were detected.
Figure 5.
Effects of nesting material (0, 6, or 12 g) on energy balance of mice during a phase of presumed inactivity (0800 to 2000). Data are given as mean ± 1 SE. Different letters (a, b) indicate overall differences (P < 0.05) associated with nesting material treatment, which encompass all strains and sexes tested in the experiment.
Figure 6.
Effects of nesting material (0, 6, or 12 g) on the respiratory quotient (RQ) in mice during a phase of presumed inactivity (0800 to 2000). Data are given as mean ± 1 SE. Different letters (a, b) indicate overall differences (P < 0.05) associated with nesting material treatment, which encompass all strains and sexes tested in the experiment.
Discussion
A hallmark of providing nesting material for laboratory mice is a reduction in food intake and an increase in BW, and this effect is often attributed to a decrease in energy utilization for thermogenesis.1,18 In accordance with the aforementioned studies, mice provided with 12 g of nesting material in the present study maintained a greater overall BW throughout the trial compared with those given 0 or 6 g, regardless of sex or strain. In addition to the nesting-material–associated effects, CD1 mice weighed more than C57 and BALB/C mice, and C57 mice had a greater BW than BALB/C mice, which confirms previous reports by our lab5 and is likely due to strain-to-strain variation in growth rate. In contrast to some reports1,5,18 and in accordance with others,4 no difference in food intake was detected between nesting-material treatments. Therefore, given that BW was increased in mice provided 12 g of nesting material compared with 0 and 6 g despite similarities in total energy consumption, this could provide evidence that the observed increase in BW gain may be attributed to a reduction in the energy requirement for thermogenesis. Although not measured in the present study, an alternative explanation may be that energy output from activity was reduced in mice given 12 g of nesting material. Nevertheless, because BW changes in the absence of dietary modifications are often considered as an indicator of distress in laboratory animals,21 the reduction in BW for mice provided 0 g and 6 g of nesting material may be an indicator of low wellbeing.
Environmental differences in mouse housing systems such as bedding material, air flow, and stocking density, can affect total heat loss, which can negatively affect the health and wellbeing of mice when they are housed below their lower critical temperature.2 Because mice are ‘metabolic specialists’ that rely on changing metabolic heat production to regulate body temperature,26 maintaining their environment at an ambient temperature below their lower critical temperature can cause mice to increase thermogenesis in an attempt to maintain euthermia.17 However, despite these previous reports, no overall nesting-material–associated differences in total HP or HP per g of BW were detected for mice in the present study. This result was unexpected, considering the previously documented effect of reduced nesting material on thermoregulation, behavior, and physiology in mice4,5 and the fact that mice were maintained at an ambient temperature approximately 6.0 to 10.0 °C below the experimentally recommended thermoneutral range of 26 to 34 °C.6 Although the specific reasons for this discrepancy are currently unclear, a possible explanation is that group housing may have reduced brown adipose tissue activation14 due to the effects of huddling on thermal energy exchange between mice (although huddling was not quantified in the present study). Furthermore, another potential cause for the lack of HP differences is that more frequent exhaust air collection (that is, every 6 h) may be necessary to detect subtle differences in metabolic rate since temporal changes in activity level, FI, and circadian rhythm can affect HP.12,23
Despite the fact that no significant nesting material-related differences in HP were detected, mice provided with 12 g maintained a more positive energy balance during the presumed inactive period (0800 to 2000 h) compared with those given 0 g or 6 g. This was somewhat surprising considering no HP differences were observed as maintaining a positive energy balance has implications toward energy consumption (that is, FI) and expenditure (that is, HP, activity, etc.) and is directly related to metabolic rate. However, energy balance may provide a better perspective of metabolic stability compared with HP alone since it quantifies energy homeostasis by taking into account both energy input and output throughout the entire day. Therefore, because mice that were provided 12 g of nesting material were in a more positive energy balance compared with those provided 0 or 6 g despite similarities in energy consumption, the insulating effects of the nesting material might have allowed them to form a thermal microenvironment,2 thereby decreasing energy expenditure and increasing energy for growth when mice were in a presumed period of inactivity. The calculated improvement in energy balance is supported by the fact that mice provided 12 g of nesting material weighed more than those provided 0 or 6 g despite similar food intakes. Although reasons for the discrepancy between HP measures and energy balance are currently unclear, one explanation is that mice provided 12 g of nesting material may have been less active or had a reduction in energy output when HP testing did not occur. This effect could in turn reduce the total amount of energy expenditure in the entire 24-h period and may help to explain the discrepancy between HP measurements and overall energy balance in the mice in the present study.
When energy consumption is greater than energy utilization and animals are in a positive energy balance, they preferentially use dietary carbohydrates (that is, glucose) directly as an energy substrate. However, when energy expenditure is greater than energy consumption and negative energy balance occurs, the body must rely on energy stores to meet its metabolic demands.19 One potential method to evaluate a marker of the energy substrates metabolized is the RQ (CO2 produced/O2 consumed), wherein a value of 1.0 indicates an increase in carbohydrate (glucose) utilization, 0.8 indicates an increase in protein utilization, and 0.7 indicates an increase in fat utilization.22 In the present study, RQ was lower overall in mice that were provided 0 or 6 g of nesting material as compared with mice that were provided 12 g, regardless of sex or strain. These data indicate that during the testing period from 0800 to 2000, mice provided with 0 or 6 g of nesting substrate may have relied more on body energy stores (possibly protein derived from lean muscle mass as indicated by RQ) as an energy substrate than did mice given 12 g of substrate (Figure 6). In addition, these data could indicate that mice provided 6 or 0 g of nesting substrate were in a more negative energy balance. However, because this difference in RQ occurred in the absence of HP differences, it is uncertain whether the higher RQ and improved energy balance are due to reduced thermogenesis or to other factors such as activity level. Regardless, these data appear to indicate that providing 12 g of nesting material may improve energy balance, resulting in greater BW gain for laboratory mice. Future work will focus on measures of body temperature and include more frequent measures of HP.
In conclusion, despite numerous reports indicating that the thermoneutral zone of mice is 26 to 34 °C, the currently recommended temperature range for mice in laboratory environments is 20 to 26 °C. Due to this discrepancy, cold stress may occur in mice, resulting in reduced wellbeing, altered homeostasis, and potential effects on the interpretation and repeatability of research in mouse models. In light of previous observations that providing nesting material can improve thermal comfort and decrease heat loss in mice, we hypothesized that increasing the amount of available nesting material would reduce HP, thereby improving energy balance and stabilizing metabolism. In the current study, varying the amount of nesting material provided did not alter HP when measured from 0800 to 2000, when mice are generally inactive inside the nest. Despite this outcome, mice provided 12 g of nesting material had an overall improvement in energy balance as indicated by an increase in BW gain and a reduction in reliance on stored energy substrates (that is, greater RQ) compared with those in mice given either 0 or 6 g. These results were surprising given the fact that no differences in HP were detected; however more frequent HP measures (that is, during the nighttime) might reveal differences. Nevertheless, these data expand our knowledge of the effect of nesting material on the bioenergetics and wellbeing of laboratory mice.
Acknowledgments
We acknowledge the assistance of the Purdue University laboratory animal care staff for assisting with animal husbandry during this trial. In addition, we thank Charles River Laboratories for donating the mice used in this experiment.
References
- 1.Dahlborn K, van Gils BAA, van de Weerd HA, van Dijk JE, Baumans V. 1996. Evaluation of long-term environmental enrichment in the mouse. Scand J Lab Anim Sci 23:97–106. [Google Scholar]
- 2.Gaskill BN, Rohr SA, Pajor EA, Lucas JR, Garner JR. 2009. Some like it hot: mouse temperature preferences in laboratory housing. Appl Anim Behav Sci 116:279–285. [Google Scholar]
- 3.Gaskill BN, Rohr SA, Pajor EA, Lucas JR, Garner JP. 2011. Working with what you've got: changes in thermal preference and behavior in mice with or without nesting material. J Therm Biol 36:193–199. [Google Scholar]
- 4.Gaskill BN, Gordon CJ, Pajor EA, Lucas JR, Davis JK, Garner JP. 2012. Heat or insulation: behavioral titration of mouse preference for warmth or access to a nest. PLoS One 7:1–11. [DOI] [PMC free article] [PubMed] [Google Scholar]
- 5.Gaskill BN, Gordon CJ, Pajor EA, Lucas JR, Davis JK, Garner JP. 2013. Impact of nesting material on mouse body temperature and physiology. Physiol Behav 110-111:87–95. [DOI] [PubMed] [Google Scholar]
- 6.Gordon CJ. 1993. Temperature regulation in laboratory rodents. New York (NY): Cambridge University Press. [Google Scholar]
- 7.Gordon CJ. 2004. Effect of cage bedding on temperature regulation and metabolism of group-housed female mice. Comp Med 54:63–68 [PubMed] [Google Scholar]
- 8.Gordon CJ. 2009. Quantifying the instability of core temperature in rodents. J Therm Biol 34:213–219. [Google Scholar]
- 9.Gordon CJ. 2012. Thermal physiology of laboratory mice: defining thermoneutrality. J Therm Biol 37:654–685. [Google Scholar]
- 10.Gordon CJ, Becker P, Ali JS. 1998. Behavioral thermoregulatory responses of single- and group-housed mice. Physiol Behav 65:255–262. [DOI] [PubMed] [Google Scholar]
- 11.Grafen A, Hails R. 2002. Modern statistics for the life sciences. New York (NY): Oxford University Press. [Google Scholar]
- 12.Haim A, Zisapel N. 1995. Oxygen consumption and body temperature rhythms in the golden spiny mouse: responses to changes in day length. Physiol Behav 58:775–778. [DOI] [PubMed] [Google Scholar]
- 13.Hess SE, Rohr S, Dufour BD, Gaskill BN, Pajor EA, Garner JP. 2008. Home improvement: C57BL/6J mice given more naturalistic nesting materials make better nests. J Am Assoc Lab Anim Sci 47:25–31. [PMC free article] [PubMed] [Google Scholar]
- 14.Himms-Hagen J, Villemure C. 1992. Number of mice per cage influences uncoupling protein content of brown adipose tissue. Proc Soc Exp Biol Med 200:502–506. [DOI] [PubMed] [Google Scholar]
- 15.Hylander BL, Repasky EA. 2016. Thermoneutrality, mice, and cancer: a heated opinion. Trends Cancer 2:166–175. [DOI] [PubMed] [Google Scholar]
- 16.Institute for Laboratory Animal Research. 2011. Guide for the care and use of laboratory animals, 8th ed Washington (DC): National Academies Press. [Google Scholar]
- 17.Karp CL. 2012. Unstressing intemperate models: how cold stress undermines mouse modeling. J Exp Med 209:1069–1074. [DOI] [PMC free article] [PubMed] [Google Scholar]
- 18.Kauffman AS, Paul MJ, Butler MP, Zucker I. 2003. Huddling, locomotor, and nest building behaviors of furred and furless Siberian hamsters. Physiol Behav 79:247–256. [DOI] [PubMed] [Google Scholar]
- 19.Kennedy EP. 1953. Energetics and metabolic function, p 197–229. In: Bourne GH, Kidder GW. Biochemistry and physiology of nutrition, vol 2. New York (NY): Academic Press. [Google Scholar]
- 20.Latham N, Mason G. 2004. From house mouse to mouse house: the behavioural biology of free-living Mus musculus and its implications in the laboratory. Appl Anim Behav Sci 86:261–289. [Google Scholar]
- 21.National Research Council 2008. Recognition and alleviation of distress in laboratory animals. Washington (DC): The National Academies Press. [PubMed] [Google Scholar]
- 22.Nienaber JA, DeShazer JS, Xin H, Hillman PE, Yen JT. 2009. Measuring energetics of biologic processes, p 73–112. In: DeShazer JS. Livestock energetics and thermal environmental management, St Joseph (MI): ASABE. [Google Scholar]
- 23.Nienaber JA, Hahn L, Yen JT. 1987. Thermal environment effects on growing finishing swine. Part I. Growth, feed intake, and heat production. Trans ASAE 30:1772–1775. [Google Scholar]
- 24.Phillips PK, Heath JE. 1995. Dependency of surface temperature regulation on body size in terrestrial mammals. J Therm Biol 20:281–289. [Google Scholar]
- 25.Yamauchi C, Fujita S, Obara T, Ueda T. 1983. Effects of room temperature on reproduction, body and organ weights, food and water intakes, and hematology in mice. Jikken Dobutsu 32:1–11. [DOI] [PubMed] [Google Scholar]
- 26.Yang Y, Gordon CJ. 1996. Ambient temperature limits and stability of temperature regulation in telemetered male and female rats. J Therm Biol 21:353–363. [Google Scholar]


