Abstract
Objective
Hemispheric stroke survivors often show impairments in voluntary muscle activation. One potential source of these impairments could come from altered control of muscle, via disrupted motor unit (MU) firing patterns. In this study, we sought to determine whether MU firing patterns are modified on the affected side of stroke survivors, as compared with the analogous contralateral muscle.
Approach
Using a novel surface electromyogram (EMG) sensor array, coupled with advanced template recognition software (dEMG) we recorded surface EMG signals over the first dorsal interosseous (FDI) muscle on both paretic and contralateral sides. Recordings were made as stroke survivors produced isometric index finger abductions over a large force range (20%–60% of maximum). Utilizing the dEMG algorithm, MU firing rates, recruitment thresholds, and action potential amplitudes were estimated for concurrently active MUs in each trial.
Main results
Our results reveal significant changes in the firing rate patterns in paretic FDI muscle, in that the discharge rates, characterized in relation to recruitment force threshold and to MU size, were less clearly correlated with recruitment force than in contralateral FDI muscles. Firing rates in the affected muscle also did not modulate systematically with the level of voluntary muscle contraction, as would be expected in intact muscles. These disturbances in firing properties also correlated closely with the impairment of muscle force generation.
Significance
Our results provide strong evidence of disruptions in MU firing behavior in paretic muscles after a hemispheric stroke, suggesting that modified control of the spinal motoneuron pool could be a contributing factor to muscular weakness in stroke survivors.
Keywords: muscle weakness, chronic stroke, motor unit, firing rate, surface electromyogram
Introduction
After a hemispheric stroke, many stroke survivors exhibit impairments in their ability to voluntarily activate their muscles, manifesting either as weakness for voluntary force generation, or as reductions in movement speed or endurance [1, 2]. Most often, a reduction in descending neural drive and/or muscle atrophy are cited as likely contributing factors. However, there is also evidence of a reduction in motor unit (MU) firing rates, as well as an increase in recorded electromyogram (EMG) for a given level of force in paretic muscles. Disorganization of normal MU firing patterns can compromise MU force generation. However, it is unclear whether these changes in firing patterns are uniformly distributed across the MU pool, and if they reflect a generalized impairment of MU control. Accordingly, our objective was to assess the magnitude of alteration in MU firing rate patterns and in MU control in paretic muscles of stroke survivors at varying isometric force levels.
In neurologically intact individuals, the firing rates of concurrently active MUs usually follow specific patterns that appear linked to key MU properties, such as the recruitment force threshold, and the size of the MUs. These firing patterns appear to be essential for effective muscle force generation [3, 4]. Specifically, earlier recruited MUs tend to discharge at higher rates than do later recruited MUs, forming a layered concentric pattern often termed the ‘onion-skin’ firing pattern. In this case, the relation between firing rate and the recruitment threshold of the MUs forms a linear negative correlation, a feature that is manifested across many muscle groups and across a large range of muscle contraction levels.
Because of technical limitations, few studies have investigated disturbances of MU firing patterns spanning a large force range in paretic muscles post-stroke. Previous studies based on sparse MU data have shown that MU firing rates are often reduced in paretic muscles of stroke survivors [5–7], but these data were comprised of single unit recordings, as opposed to simultaneous recordings of multiple units. Furthermore, in these single unit studies, invasive intramuscular recording techniques were used, and these are only effective at low-level muscle contractions. As a consequence, the number of reported MUs in each recording was typically small, and many studies relied on pooling of units from multiple contractions, and even from different subjects. Therefore, a systematic investigation of the overall MU pool behavior was not possible with older recording techniques.
To overcome these limitations, we used a recently developed non-invasive EMG recording technique to perform a comprehensive examination of MU pool rate coding in stroke survivors. This allowed us to identify disturbances in the firing rates of concurrently active MUs in paretic muscles. Specifically, we examined whether there were disturbances in the firing rates in relation to both the recruitment threshold and MU size in paretic muscles of stroke survivors, and we sought to establish whether such disturbances could contribute significantly to the clinically determined motor impairment.
In our current study, MU firing patterns were recorded over the first dorsal interosseous (FDI) muscle, as stroke survivors produced isometric abduction forces (20%–60% maximum force) using their index fingers. Both paretic and contralateral FDI muscles were tested. Single MU firing patterns were obtained using the aforementioned surface electromyogram (sEMG) decomposition method [8, 9]. The accuracy of the decomposition algorithms has been systematically verified using both simulation approaches and cross-validation with two-source intramuscular decomposition methods [10, 11].
Comparisons of paretic with contralateral FDI muscles show that there is a generalized disorganization of MU firing patterns in paretic muscles, and that altered control of MUs may well be a contributing factor to impaired muscle force generation after a hemispheric stroke.
Materials and methods
Participants
Fourteen chronic hemiparetic stroke survivors were recruited from stroke registries of the Rehabilitation Institute of Chicago. All participants gave informed consent via protocols approved by the Institutional Review Board from Northwestern University. The demographic information and the inclusion/exclusion criteria of stroke subjects, the experimental setup, and testing procedures can be found in an earlier report that quantified changes in MU recruitment properties [20].
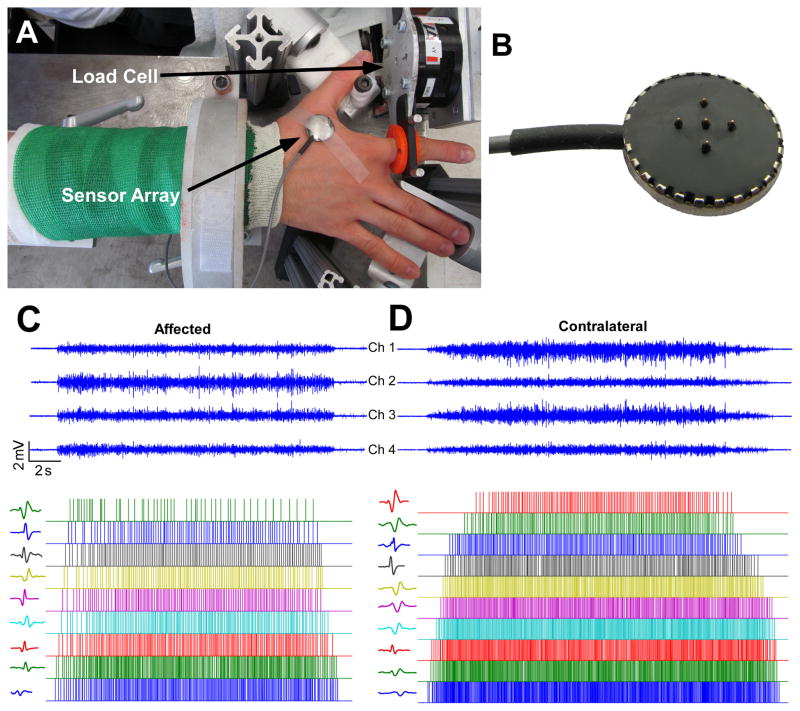
Briefly, a total of 14 chronic stroke survivors were recruited. Surface EMG signals were recorded from the FDI muscles of the affected and contralateral muscles, while the subjects produced isometric abduction forces at different force levels, ranging from 20% to 60% of the maximum voluntary contraction (MVC) with a 10% increment. To achieve fair comparisons, the MVC of the affected hand was used for both hands, i.e., the absolute force was matched for both sides. An illustration of the experimental setup and an example of the recorded EMG signals are shown in figure 1.
Figure 1.
Experimental setup, EMG signals and motor unit decomposition. (A) Experimental setup with surface EMG and force signal recordings. (B) The 5-pin surface EMG sensor array. (C) Four channels of surface EMG signals from the affected muscle, and decomposition results (motor unit discharge timings of motor unit 2, 4, …, 18, and corresponding action potential templates from the EMG channel with the largest root-mean-squared value). (D) Surface EMG signals from the contralateral muscle, and motor unit discharge timings of motor unit 2, 4, …, 20, and action potential templates.
Data analysis
The recorded EMG signals were decomposed using published dEMG decomposition algorithms [8, 12]. The decomposed MUs consist of the individual firing spike timing and four records of action potential templates, one from each channel. The validity of the decomposition results has been evaluated rigorously using a surrogate analyses through simulation [10]. Additionally, a two-source validation method was used to assess the accuracy of decomposed firing spikes. Specifically, surface EMG and intramuscular EMG signals were recorded concurrently, and were then decomposed separately using two different decomposition algorithms. The degree of consistency was assessed in the common units decomposed from the EMG signals on the two recording sites [11]. On average, the decomposed spike timings retained an accuracy of 95%.
MU firing rate estimation
The mean firing rate of each MU was calculated from a 4 s averaging window in which the firing rate was stable and the muscle force was relatively constant during steady state voluntary muscle contraction.
MU recruitment threshold was calculated as the muscle force at the time the MU started to discharge (with an inter-spike interval <200 ms). The size of the MUs was estimated based on the action potential peak-to-peak amplitude using a spike-triggered averaging method [13, 14]. The detailed calculation procedures can also be found in our earlier report [20].
Firing rate organization
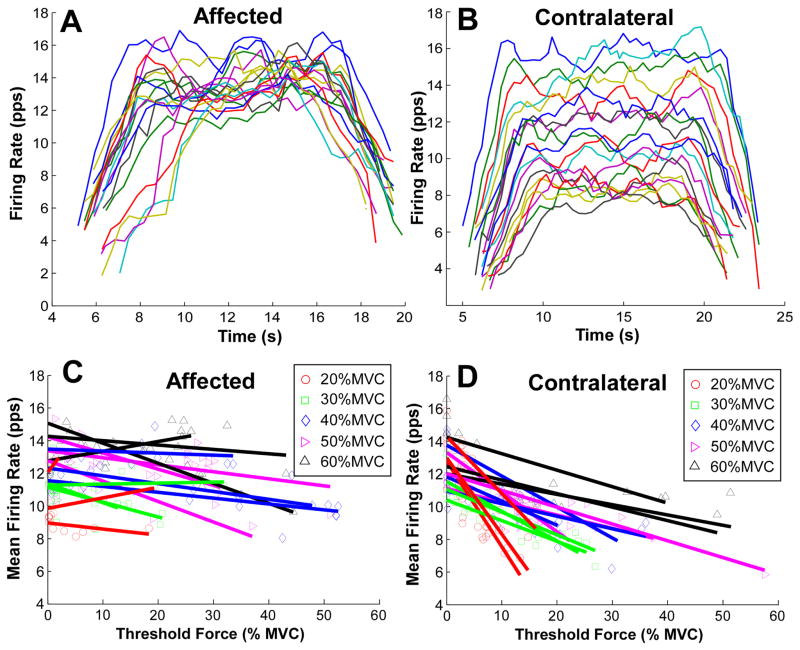
To quantify the firing rate patterns, we examined the mean firing rate of concurrently active MUs in relation to their recruitment threshold and their MU size, estimated from the spike triggered average of the surface EMG signal. A linear function was fit to the mean firing rate versus recruitment threshold for individual muscle contractions.
Studies involving neurologically intact subjects have reported that later recruited MUs tended to show a lower firing rate, forming a layering effect of the firing rate plot over time (figure 2(B)), termed the ‘onion-skin’ property [3]. Thus, a negative regression slope was expected in the contralateral muscle, and such a regression might well be modified in the affected muscle. In addition, based on our earlier study [13], an inverse power function was fit to the mean firing rate as a function of the MU size:
| (1) |
where b is the scale factor and a is the power or decay exponent.
Figure 2.
Firing rate patterns of an exemplar contraction and of an exemplar stroke survivor. (A) Firing rate over time of concurrently active units from the affected muscle producing a 40% MVC contraction. (B) Firing rate over time of concurrently active units from the contralateral muscle. (C) Firing rate and recruitment threshold in the affected muscle. Individual linear regressions were performed on concurrently active units. Different symbols and colors represent different muscle contraction levels. (D) Firing rate and recruitment threshold in the contralateral muscle.
We also expected that the decay exponent will be modified in the affected muscle compared with the contralateral muscle.
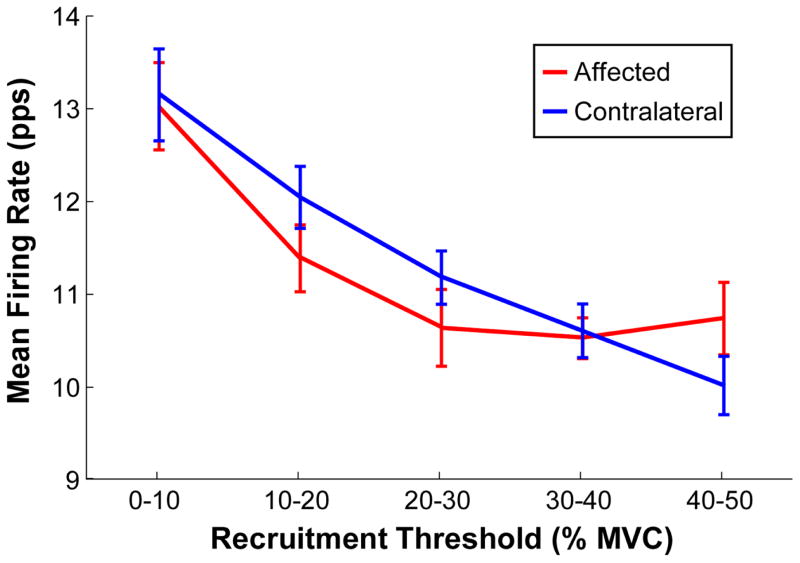
In order to quantify the detailed changes of firing rate at different stages of recruitment, the mean firing rates within each recruitment threshold bin (0%–10% MVC, 10%–20% MVC, 20%–30% MVC, 30%–40% MVC, and 40%–50% MVC) were also compared between the affected and contralateral muscles across different contraction levels. The mean firing rate in the 50%–60% MVC bin was not calculated, because limited numbers of units were observed at this force level.
Statistical analysis
The onion-skin regression slopes (firing rate versus recruitment threshold) were compared between the paretic and the contralateral muscles at different force levels. A two-way (side and force level) repeated measures analysis of variance (ANOVA) was performed on the slopes and the goodness-of-fit. When necessary, post hoc pairwise multiple comparisons with Tukey’s correction method were used. The decay exponents of the firing rate as a function of MU size were also compared between the two sides at individual force levels. A two-way (side and force level) repeated measures ANOVA was performed on the decay exponent. P < 0.05 was considered statistically significant.
Results
Firing rate versus recruitment threshold
The firing rates of concurrently active MUs from one exemplar 40% MVC contraction of a stroke survivor are illustrated in figures 2(A) and (B). A layered, or onion-skin pattern is clearly visible in the contralateral FDI muscle, whereas this layer effect is not evident in the impaired FDI muscle. Figures 2(C) and (D) show the mean firing rate at steady state contractions as a function of the recruitment threshold for a representative stroke survivor. Individual regressions were performed on single contractions (three repetitions per force level), each depicted with a different color. The different symbols represent the individual MU firing rates and recruitment thresholds. The regression slopes (firing rate versus recruitment threshold) on the affected side (figure 2(C)) tended to be quite shallow, indicating that the units recruited at different force levels discharged at relatively similar rates, as shown in figure 2(A). In contrast, the slopes on the contralateral side (figure 2(D)) tended to be strongly negative (i.e., underlying the striking onionskin pattern shown in figure 2(B)).
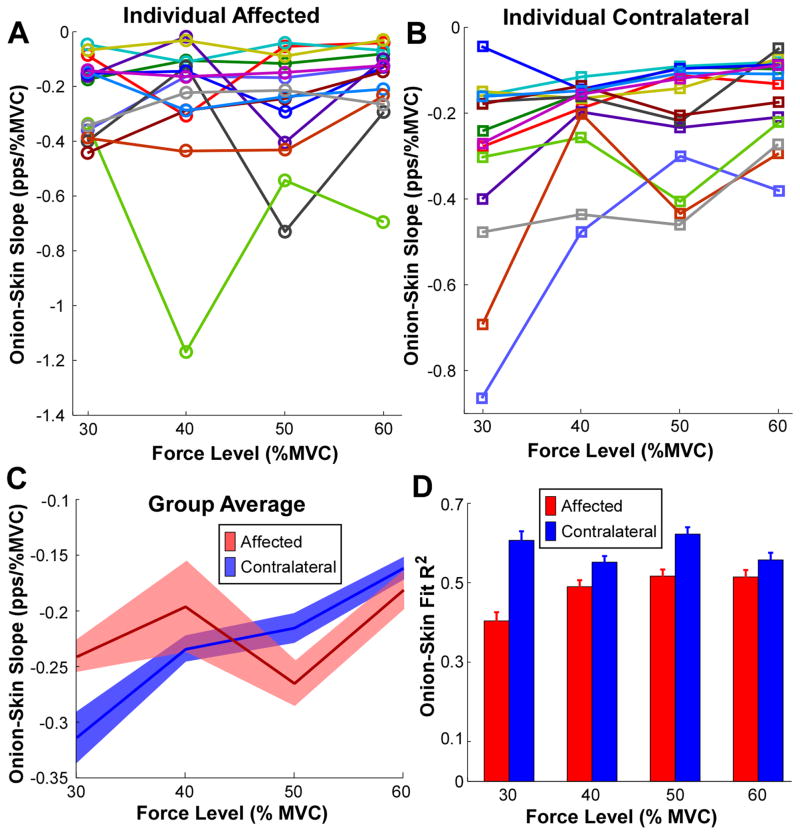
The onion-skin slopes from all 14 stroke survivors are assembled in figure 3. The regression slopes (averaged from three repetitions at each force level) during individual force levels are shown in figures 3(A) and (B). The MU firing properties at 20% MVC were not analyzed here, due to a small number (<5) of extracted MUs at this low level of voluntary muscle contraction. As force level increases, the regression slopes did not show a systematic change on the affected side (figure 3(A)), and the slopes of the slope dependencies on force clustered around zero. In contrast, the regression slopes became less negative systematically with increasing force level in the contralateral muscle, in 10 out of 14 subjects (figure 3(B)).
Figure 3.
Onion-skin (firing rate versus recruitment threshold force) regression slope as a function of muscle contraction levels. (A) Onionskin regression slope on the affected side at different muscle contraction levels of individual subjects. One color represents an individual subject. (B) Onion-skin regression slope on the contralateral side at different muscle contraction levels of individual subjects. (C) Onion-skin slope comparisons between the affected and the contralateral muscles. The solid lines represent the average slopes across all subjects and the shaded region represents the standard error. (D) Regression R2 comparisons between the affected and the contralateral muscles. Error bars represent standard errors.
The onion-skin slopes were further compared between the two sides of each subject (figure 3(C)). The solid lines represent the average slopes and the shaded region represents the standard error across subjects. The two-way ANOVA revealed a significant interaction between force level and the two sides [F (3, 39) = 5.28, p = 0.004]. The pairwise comparisons showed that the slopes on the affected side were not significantly different across different force levels (p > 0.05). In contrast, the slopes in the contralateral side became progressively shallower (i.e., less negative) with increasing force level (p < 0.05), except between 40% and 50% MVC contraction levels (p = 0.437).
The goodness-of-fit of the onion-skin regression between the two sides was also examined (figure 3(D)). The ANOVA revealed that the R2 was significantly higher on the contralateral muscle than on the affected muscle [F (1, 13) = 7.49, p = 0.017]. No significant interactions were observed between force level and the two sides [F (3, 39) = 1.48, p = 0.234].
To quantify the changes of firing rates at different recruitment threshold, the mean firing rate, binned at different stages of recruitment in the affected and contralateral muscles across different muscle contraction levels is shown in figure 4. A significant interaction between the threshold bin and the two sides was evident [F (4, 32) = 22.25, p = 0.002]. The pairwise comparisons showed that the mean firing rates were not significantly different between the two sides in the 0%–10% and 30%–40% MVC bins (p > 0.05). In contrast, the mean firing rate was lower on the affected side in the 10%–20% and 20%–30% MVC bins (p < 0.05), but was higher in the affected side in the 40%–50% MVC bins (p < 0.05), in comparison with the contralateral sides.
Figure 4.
Mean firing rate within each recruitment threshold bin in the affected and the contralateral muscles. Error bars represent standard errors.
Firing rate versus MU size
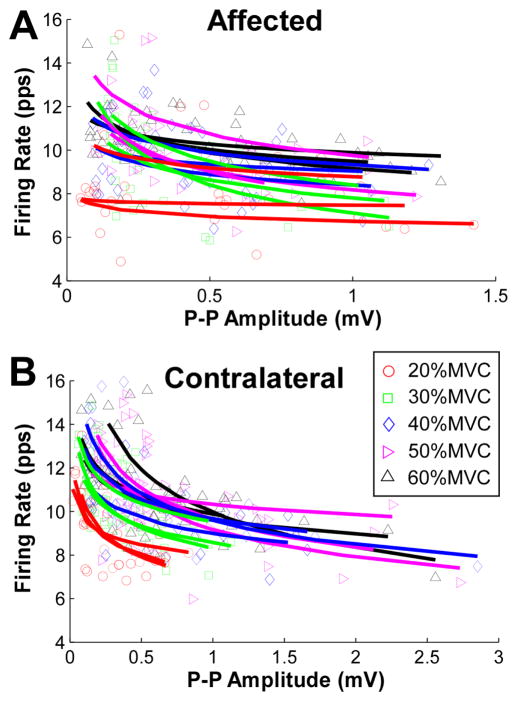
The firing rate organization as a function of MU size was examined, and the pattern from an exemplar subject is shown in figure 5. Using an inverse power function regression, the decay exponent of the firing rate associated with the MU size tended to be weak across different force levels in the affected muscle (figure 5(A)). In contrast, the decay exponent of all the tested force levels was strikingly evident in the contralateral muscle (figure 5(B)).
Figure 5.
Mean firing rate as a function of MU size (estimated based on spike triggered averaging) of an exemplar stroke survivor. (A) Firing rate and MU size in the affected muscle. Individual regressions of an inverse power function were performed on concurrently active units. Different symbols and colors represent different muscle contraction levels. (B) Firing rate and MU size in the contralateral muscle.
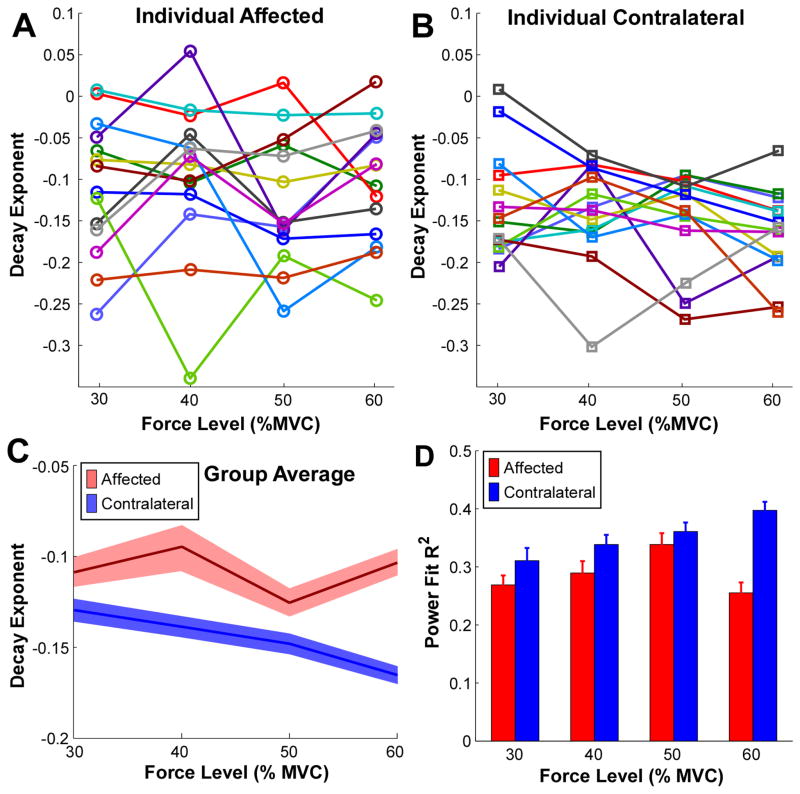
The decay exponents for all the subjects are summarized in figure 6. (The MU firing properties at 20% MVC were not analyzed here, again due to a small number of extracted MUs at the low force level.) The decay exponents from the three repetitions at each force level were averaged, and different colors represent different subjects. These exponents were consistently smaller in magnitude (i.e., less negative) on the affected side and did not change systematically with increasing force levels (figure 6(A)). In contrast, the decay exponents tended to be larger (i.e., more negative) on the contralateral side than the affected side. These decay exponents also tended to become larger in the contralateral muscle with increasing force levels (figure 6(B)).
Figure 6.
Decay exponent of the inverse power function at different muscle contraction levels. (A) Decay exponent on the affected side at different muscle contraction levels of all the subjects. One color represents an individual subject. (B) Decay exponent on the contralateral side at different muscle contraction levels. (C) Group averaged decay exponents in the affected and the contralateral muscles. The solid lines represent the average values and the shaded region represents the standard error across 14 subjects. (D) Regression R2 comparisons between the affected and the contralateral muscles. Error bars represent standard errors.
These changes in the decay exponents on the affected side were further quantified at individual force levels (figure 6(C)). The ANOVA showed a significant interaction between force level and the two sides [F (3, 39) = 2.83, p = 0.043], and a significantly smaller decay exponent on the affected side compared with the contralateral side [F (1, 13) = 14.88, p = 0.002]. The pairwise comparisons revealed that the exponent was not significantly different across force levels on the affected side (p > 0.05). Whereas the exponent in the contralateral muscle was larger at 60% MVC than at 30% and 40% MVC force levels (p < 0.05).
The goodness-of-fit of the inverse power function regression was also compared between the two sides (figure 6(D)). The R2 was significantly higher on the contralateral side compared with the affected side [F (1, 13) = 9.21, p = 0.010]. No significant interactions were observed between force level and the two sides [F (3, 39) = 0.50, p = 0.683].
Clinical correlations
To identify potential associations between changes in MU firing rate patterns and motor impairments, the MU firing rate reorganization patterns were examined in relation to the clinical motor impairment scales (muscle strength impairment, Chedoke scale and Fugl-Meyer scale). Specifically, we found that the MVC reduction in the affected muscle showed a significant correlation with the goodness-of-fit of the onionskin regression (r = 0.340). Significant correlations of the goodness-of-fit of the inverse power function with the Chedoke scale (r = 0.423) and the Fugl-Meyer scale (r = 0.382) were also found in the paretic muscle.
Discussion
This study examined the MU firing patterns in paretic and contralateral FDI muscles of stroke survivors, to assess whether significant differences exist between these muscles. Using innovative sEMG recording and decomposition techniques, we evaluated changes of firing rate organization in concurrently active MUs over a large force range. Our results show that the normal associations between firing rate patterns, recruitment threshold and MU size were disrupted in the affected muscle. In addition, these firing rate patterns did not scale with increasing levels of force in the affected muscle, when compared with the contralateral muscle. The degree of disruption in MU firing patterns also correlated with the severity of strength impairment and with the clinical assessment scores. The overall findings revealed a systematic reorganization of MU pool control in the affected muscles of stroke survivors.
Disorganized firing rate patterns
In intact individuals, the MU firing rates recorded during steady muscle contractions tend to be high for low-threshold units, and low for high-threshold units, creating an inverse relation between firing rate and threshold force. This pattern is termed onion-skin [15], although an opposite relation (i.e., later recruited MUs discharge at faster rates) has been reported when MU data are pooled from multiple recordings [16, 17]. Earlier studies have further shown that the mean firing rate is sometimes reduced and the modulation of firing rate is impaired in stroke survivors [5, 18, 19]. To this date, the firing rate organization of multiple concurrently active MUs, depicted in relation to recruitment threshold and MU size in stroke survivors has not been investigated, primarily because of technical limitations in MU recording and extraction procedures. Using advanced recording and discrimination techniques, our current study has confirmed the presence of alterations in the MU firing rate patterns in relation to the recruitment threshold and to MU size in the affected muscle, and our results indicate that such alterations can contribute to muscle weakness.
More precisely, in our stroke cohort, we found that the correlation of MU firing rate with recruitment threshold was considerably weaker in the affected muscle, as compared with the contralateral muscle. This lack of correlation could have come from a change of the firing rate at different recruitment thresholds, i.e., an earlier plateau of firing rates of low threshold MUs and/or from a compensatory increase of firing rate of the high threshold MUs (figure 4). An impairment in rate modulation of low threshold MUs has indeed been reported in the affected muscles of stroke survivors [18]. Such a lack of rate modulation can limit the plateau or peak firing rate of low threshold units, despite a concurrent increase of the muscle force. The lower firing rate of the low threshold MUs can also reduce the association of the firing rate with recruitment threshold. Given that the earlier recruited MUs discharge at abnormally low rates, generating minimal force output, the later recruited MUs may discharge at rates faster than normal as compensation, leading to a non-uniform change of firing rate across different recruitment thresholds, thereby disturbing the firing rate patterns.
In addition, the modified onion-skin firing pattern can also come from an altered recruitment pattern in the affected muscles [5]. Specifically, a reduction of the recruitment range, primarily due to a reduced recruitment threshold of the high threshold units has been observed in the paretic muscle of stroke survivors [5], and the associated clustered recruitment patterns can potentially disturb the rate-recruitment relations.
The MU firing rate in the affected muscles also tended to show a more modest reduction as MU size increased. This limited rate reduction indicates that the larger MUs tended to discharge at comparable rates to the smaller MUs, a finding consistent with the disturbed onion-skin property. This reduced rate-size association can arise from multiple mechanisms.
First, the lack of correlation can be a potential manifestation of reduced rate modulation across MUs, in that the smaller MUs are not driven to higher rates despite an increase of excitatory drive, and this potential change is similar to the impaired rate modulation in low threshold units shown in earlier studies [18]. A lower firing rate in the small MUs can reduce the range of firing rate across the MUs with different sizes, leading to a weaker association between firing rate and MU size.
Second, the rate-size correlation can also be disrupted by disordered recruitment based on MU size. An earlier study from our group has shown that the recruitment order link to the size principle is disturbed in the affected muscles of stroke survivors [20]. If larger units are recruited earlier, these units would experience a larger range of excitation drive as the force increases, potentially driving these units to discharge at higher rates, and therefore, disrupting the rate-size association.
Lastly, the limited rate reduction of MUs across different sizes could also reflect compensation for inefficient MU force generation in the affected muscles. A reduced firing rate of some MUs and concurrent fiber atrophy can lead to inefficient force generation of the MU pool. To accommodate these changes, the excitation drive may need to be increased further and drive active units, potentially later recruited ones, to higher discharge rate. If the recruitment order based on MU size is disorganized, the later recruited MUs can be either small or large, which can disrupt the rate-size association. These non-uniform changes in firing rates (i.e., a reduced firing rate in the small MUs and an increased firing rate in the larger MUs), can lead to a weaker correlation between firing rate and MU size.
Modulation of firing patterns with force levels
In addition to the overall weaker association of firing rate with the recruitment threshold force and with MU size, the characteristic scaling of these firing rate patterns with force level is also absent in the affected muscle. In intact individuals, we typically observe a shallower slope of the onion-skin firing pattern with increasing muscle force, and a less marked reduction of the firing rate in larger MUs [9, 21]. Such scaling patterns hold across multiple muscle groups. This shift of firing patterns indicates an increase of the overall firing rate of the active MUs and convergence of the firing rate across units with higher excitation drive. The absence of these systematically modified firing patterns with increasing excitation in the affected muscles represents a disorder in MU activation pattern in the affected muscles.
The disordered MU firing patterns can originate from inconsistent changes of the firing rate, or from shifts in the recruitment threshold or in the orderly recruitment, relative to the excitatory drive. Based on evidence provided in earlier studies [20, 22], it is possible that all these factors can occur simultaneously, and can lead to impaired firing rate patterns with the excitatory input. Such disordered firing patterns may also lead to inefficient muscle force generation, especially at higher force levels. In particular, with increasing excitatory drive, already active units fail to further increase the firing rate, and the extra force is produced primarily by recruiting new units. As a consequence, the pool of active units discharge at lower rates, and some may fall below their optimal firing range, producing reductions in unit force.
Clinical implications
The altered firing rate patterns observed in the affected muscle correlated significantly with the severity of motor impairment (i.e., with both the muscle strength reductions and with other clinical assessments). These correlations indicate that the disorganized firing rate patterns may contribute to the impaired muscle force generation in stroke survivors. The use of non-invasive recording and the high-yield MU sampling features of the sEMG techniques can potentially be applied in the clinic, and can facilitate the development of diagnostic tools evaluating impairment of MU control. Such information may eventually be valuable for clinicians when prescribing treatment procedures. The information on MU activation patterns obtained from these techniques can also help us to assess the recovery process in muscle force control during therapeutic interventions.
Overall, our study establishes the finding that in addition to potential reductions in descending drive and muscle atrophy, there are concurrent impairments in the central control of MUs activation, and thereby a change in muscle control. This is significant in that the residual capacity following corticospinal injury linked to the stroke is further eroded by potentially inefficient and disorganized MU control in the periphery.
Our current study cannot distinguish the relative contribution of these different factors to muscle weakness. Furthermore, the role of reduced central drive and of MU control will likely vary, depending on the specific features of the stroke, such as the lesion size and location, the types of interventions received, and the daily activities involved after the stroke. Further study is also required to understand if disordered MU control arises from the original neural insult, or is an adaptive mechanism to changes in muscle contractile and passive properties.
Abbreviations
- MU
Motor unit
- EMG
Electromyogram
- sEMG
Surface electromyogram
- FDI
First dorsal interosseous
- MVC
Maximal voluntary contraction
- P–P
Peak–peak
- ANOVA
Analysis of variance
References
- 1.Adams RW, Gandevia SC, Skuse NF. The distribution of muscle weakness in upper motoneuron lesions affecting the lower limb. Brain. 1990;113:1459–76. doi: 10.1093/brain/113.5.1459. [DOI] [PubMed] [Google Scholar]
- 2.Burke D. Spasticity as an adaptation to pyramidal tract injury. Adv Neurol. 1988;47:401–23. [PubMed] [Google Scholar]
- 3.De Luca CJ, Contessa P. Hierarchical control of motor units in voluntary contractions. J Neurophysiol. 2012;107:178–95. doi: 10.1152/jn.00961.2010. [DOI] [PMC free article] [PubMed] [Google Scholar]
- 4.De Luca CJ, Contessa P. Biomechanical benefits of the onion-skin motor unit control scheme. J Biomech. 2015;48:195–203. doi: 10.1016/j.jbiomech.2014.12.003. [DOI] [PMC free article] [PubMed] [Google Scholar]
- 5.Gemperline JJ, Allen S, Walk D, Rymer WZ. Characteristics of motor unit discharge in subjects with hemiparesis. Muscle Nerve. 1995;18:1101–14. doi: 10.1002/mus.880181006. [DOI] [PubMed] [Google Scholar]
- 6.Chou LW, Palmer JA, Binder-Macleod S, Knight CA. Motor unit rate coding is severely impaired during forceful and fast muscular contractions in individuals post stroke. J Neurophysiol. 2013;109:2947–54. doi: 10.1152/jn.00615.2012. [DOI] [PMC free article] [PubMed] [Google Scholar]
- 7.Li X, Holobar A, Gazzoni M, Merletti R, Rymer WZ, Zhou P. Examination of poststroke alteration in motor unit firing behavior using high-density surface EMG decomposition. IEEE Trans Biomed Eng. 2015;62:1242–52. doi: 10.1109/TBME.2014.2368514. [DOI] [PMC free article] [PubMed] [Google Scholar]
- 8.Nawab SH, Chang SS, De Luca CJ. High-yield decomposition of surface EMG signals. Clin Neurophysiol. 2010;121:1602–15. doi: 10.1016/j.clinph.2009.11.092. [DOI] [PMC free article] [PubMed] [Google Scholar]
- 9.De Luca CJ, Hostage EC. Relationship between firing rate and recruitment threshold of motoneurons in voluntary isometric contractions. J Neurophysiol. 2010;104:1034–46. doi: 10.1152/jn.01018.2009. [DOI] [PMC free article] [PubMed] [Google Scholar]
- 10.Hu X, Rymer WZ, Suresh NL. Assessment of validity of a high-yield surface electromyogram decomposition. J Neuroeng Rehabil. 2013;10:99. doi: 10.1186/1743-0003-10-99. [DOI] [PMC free article] [PubMed] [Google Scholar]
- 11.Hu X, Rymer WZ, Suresh NL. Accuracy assessment of a surface electromyogram decomposition system in human first dorsal interosseus muscle. J Neural Eng. 2014;11:026007. doi: 10.1088/1741-2560/11/2/026007. [DOI] [PubMed] [Google Scholar]
- 12.De Luca CJ, Adam A, Wotiz R, Gilmore LD, Nawab SH. Decomposition of surface EMG signals. J Neurophysiol. 2006;96:1646–57. doi: 10.1152/jn.00009.2006. [DOI] [PubMed] [Google Scholar]
- 13.Hu X, Rymer WZ, Suresh NL. Motor unit pool organization examined via spike triggered averaging of the surface electromygram. J Neurophysiol. 2013;110:1205–20. doi: 10.1152/jn.00301.2012. [DOI] [PMC free article] [PubMed] [Google Scholar]
- 14.Hu X, Rymer WZ, Suresh NL. Reliability of spike triggered averaging of the surface electromyogram for motor unit action potential estimation. Muscle Nerve. 2013;48:557–70. doi: 10.1002/mus.23819. [DOI] [PubMed] [Google Scholar]
- 15.De Luca CJ, LeFever RS, McCue MP, Xenakis AP. Control scheme governing concurrently active human motor units during voluntary contractions. J Physiol. 1982;329:129–42. doi: 10.1113/jphysiol.1982.sp014294. [DOI] [PMC free article] [PubMed] [Google Scholar]
- 16.Oya T, Riek S, Cresswell AG. Recruitment and rate coding organisation for soleus motor units across entire range of voluntary isometric plantar flexions. J Physiol. 2009;587:4737–48. doi: 10.1113/jphysiol.2009.175695. [DOI] [PMC free article] [PubMed] [Google Scholar]
- 17.Grimby L, Hannerz J, Hedman B. Contraction time and voluntary discharge properties of individual short toe extensor motor units in man. J Physiol. 1979;289:191–201. doi: 10.1113/jphysiol.1979.sp012732. [DOI] [PMC free article] [PubMed] [Google Scholar]
- 18.Mottram CJ, Heckman CJ, Powers RK, Rymer WZ, Suresh NL. Disturbances of motor unit rate modulation are prevalent in muscles of spastic-paretic stroke survivors. J Neurophysiol. 2014;111:2017–28. doi: 10.1152/jn.00389.2013. [DOI] [PMC free article] [PubMed] [Google Scholar]
- 19.Suresh AK, Hu X, Powers RK, Heckman CJ, Suresh NL, Rymer WZ. Changes in motoneuron afterhyperpolarization duration in stroke survivors. J Neurophysiol. 2014;112:1447–56. doi: 10.1152/jn.01091.2012. [DOI] [PMC free article] [PubMed] [Google Scholar]
- 20.Hu X, Suresh AK, Rymer WZ, Suresh NL. Assessing altered motor unit recruitment patterns in paretic muscles of stroke survivors using surface electromyography. J Neural Eng. 2015;12:066001. doi: 10.1088/1741-2560/12/6/066001. [DOI] [PMC free article] [PubMed] [Google Scholar]
- 21.Hu X, Rymer WZ, Suresh NL. Control of motor unit firing during step-like increases in voluntary force. Front Hum Neurosci. 2014;8:721. doi: 10.3389/fnhum.2014.00721. [DOI] [PMC free article] [PubMed] [Google Scholar]
- 22.Hu X, Suresh AK, Li X, Rymer WZ, Suresh NL. Impaired motor unit control in paretic muscle post stroke assessed using surface electromyography: a preliminary report. Proc. Engineering in Medicine and Biology Society (EMBC), 2012 Annual Int. Conf. of the IEEE; San Diego, CA: IEEE; 2012. pp. 4116–9. [DOI] [PubMed] [Google Scholar]


