

Abstract
Single-cell paired TCR identification is a powerful tool, but has been limited in its previous incompatibility with further functional analysis. The current protocol describes a method to clone and functionally evaluate in vivo TCRs derived from single antigen-responsive human T cells and monoclonal T cell lines. We have improved upon current PCR-based TCR sequencing protocols by developing primers that allow amplification of human TCRα and TCRβ variable regions, while incorporating specific restriction cut sites for direct subcloning into the template retroviral vector. This streamlined approach for generating human:mouse chimeric TCR vectors allows for rapid TCR expression in humanized-retrogenic (hu-Rg) mice through retroviral mediated stem cell gene transfer. Using widely available techniques and equipment, this method is easily adaptable by most laboratories. This is the first TCR identification protocol that is efficiently combined with subsequent in vivo TCR expression.
Keywords: T cell receptor, TCR, PCR, Single cell, Human, Humanized mice
1. Introduction
The broad specificity of the T cell population is encoded by the heterodimeric α- and β-chains of the T cell receptor (TCR), which can specifically recognize target peptide epitopes presented in the context of the human leukocyte antigen (HLA). The complete TCR repertoire is highly diverse, and in humans has been estimated at 1 × 10⁸ unique combinations of TCR α- and β-chains (Qi et al., 2014). Several autoimmune diseases including type 1 diabetes, multiple sclerosis, celiac disease, and rheumatoid arthritis, are associated with a pathogenic T cell response specific to a well-characterized auto-antigen. Yet, even these focused immune responses can result in recruitment of a T cell population encompassing over 850 unique TCRs (Jenkins et al., 1993; Qian et al., 2010; Eugster et al., 2015; Zhao et al., 2016). Thus, assessing individual TCRs involved in any specific immune response presents a great challenge. In recent years, TCR genes have been identified from single cells through PCR-based methods (Ozawa et al., 2008; Dash et al., 2011; Walchli et al., 2011; Kim et al., 2012; Eugster et al., 2013; Kobayashi et al., 2013; Linnemann et al., 2013; Turchaninova et al., 2013; Han et al., 2014; Guo et al., 2016; Stubbington et al., 2016). These methods advanced our understanding of antigen-specific TCRs by providing essential TCR chain pairing information that was previously unattainable through deep sequencing of bulk messenger RNA (mRNA) or genomic DNA (gDNA). However, the majority of the PCR-based protocols generate a partial amplicon of the variable region, and proceeding to functional analysis requires additional in silico assembly and de novo construction of the TCR (Table 1). We, therefore, have developed a novel method that amplifies TCR chains from a single cell in a manner that allows direct sub-cloning of the PCR product into an expression vector compatible with in vivo animal models. By incorporating unique restriction sites at the 5′ and 3′ ends of the amplified TCR transcripts, we can directly sub-clone paired TCR chains into a template expression vector and eliminate the need for costly and time consuming de novo TCR construct generation. To this end, we have designed a chimeric TCR construct that includes human variable regions and murine constant regions to ensure functional interaction between the chimeric TCR and murine intracellular CD3 signaling complex. This strategy allows in vivo expression of TCRs on the surface of murine cells. Using this novel PCR-approach and chimeric TCR design, we have re-expressed a human TCR in an HLA-humanized retrogenic mouse model to achieve TCR driven in vivo T cell development.
Table 1.
Methods for identifying paired TCR chains.
| Technique | Beta % | Alpha % | Paired % | Amplified TCR regions | Strengths | Major limitations | Reference |
|---|---|---|---|---|---|---|---|
| PCR-based | N/A | 35% | N/A | Full variable region | Limited number of primers | Low throughput Gives a limited assessment of TCR repertoire PCR product is not directly conducive with cloning |
Ozawa et al., (2008) |
| PCR-based 5′-RACE | N/A | N/A | N/A | Full TCR chain | High throughput Compatible with subsequent in vitro studies |
Fully human TCR construct, not compatible with in vivo mouse expression | Walchli et al., (2011) |
| PCR-based | 55–75% | 45–65% | N/A | CDR3 | Limited number of primers | Low throughput Gives a limited assessment of TCR repertoire PCR product is not directly conducive with cloning |
Dash et al., (2011) |
| PCR-based | 27–85% | N/A | 39% | CDR3 | Limited number of primers | Low throughput PCR product is not directly conducive with cloning |
Kim et al., (2012) |
| PCR-based | 67% | 61% | 43% | Full TCR chain | Combines TCR identification with phenotype | Fully human TCR construct, not compatible with in vivo mouse expression | Eugster et al., (2013) |
| Gene capture | 100% | 100% | 100% | N/A | High throughput | Necessary to generate T cell clones to identify Tcra and Tcrb genes Requires in silico assembly and de novo TCR construction |
Linnemann et al., (2013) |
| Emulsion PCR | N/A | N/A | N/A | CDR3 | High throughput Limited number of primers |
PCR product is not directly conducive with cloning | Turchaninova et al., (2013) |
| PCR-based | N/A | N/A | 13–72% | Full TCR chain | Limited number of primers Compatible with subsequent in vitro studies |
Alpha and beta chains are cloned into separate vectors, non-stoichiometric expression Fully human TCR construct, not compatible with in vivo mouse expression |
Kobayashi et al., (2013) |
| PCR-based | 81–92% | 87% | 58–82% | CDR3 | High throughput Combines TCR identification with phenotype |
PCR product is not directly conducive with cloning | Han et al., (2014) |
| PCR-based | N/A | N/A | N/A | CDR3 | Limited number of primers | Low throughput PCR product is not directly conducive with cloning Requires in silico assembly and de novo TCR construction Fully human TCR construct, not compatible with in vivo mouse expression |
Guo et al., (2016) |
| RNA-seq | 88–96% | 74–96% | 70–93% | Full TCR chain | High throughput Combines TCR identification with gene expression profile |
RNA-seq is a prohibitive technique for many labs due to the associated cost TCR sequence information only, would require synthesizing TCR construct for expression (costly) |
Stubbington et al., (2016) |
| Current protocol | |||||||
| PCR-based | 63–89% | 49–60% | 45–59% | Full variable region | Compatible with subsequent in vitro and in vivo studies | Low throughput Gives a limited assessment of TCR repertoire |
|
N/A = not available.
HLA haplotype is the primary genetic susceptibility for many autoimmune disorders, and TCRs selected on these HLA alleles are likely to be preferentially involved in autoimmunity (Todd, 2010; Noble and Valdes, 2011; Bonifacio, 2015). While the mechanisms behind TCR pathogenicity are still largely unknown, studies suggest that thymic selection of pathogenic TCRs is driven by suboptimal antigen presentation during T cell development (Durinovic-Bello et al., 2010). Several mechanisms have been put forth to explain the reduced levels of self-antigens in the thymus, which leads to loss of central tolerance: (1) unusual peptide binding groove of certain HLA molecules, which leads to peptide register shifting and reduced stability of peptide:HLA complexes (Yu et al., 2000; Lee et al., 2001; Bankovich et al., 2004; Levisetti et al., 2007; Mohan et al., 2011); (2) allelic variation in the promoter region of certain self-antigens that results in a lower level of expression in the thymus (Pugliese et al., 1997; Vafiadis et al., 1997; Chentoufi and Polychronakos, 2002); (3) post-translational modification of self-proteins in periphery, which does not occur at the same level in the thymus (McGinty et al., 2015; Delong et al., 2016). In all of these situations, the self-reactive TCR repertoire is presumably changed and is likely to be more pathogenic and potentially lead to autoimmunity. However, it has yet to be formally shown that self-reactive TCRs, which develop in humans with autoimmunity, resist central tolerance and are more pathogenic. Several HLA-transgenic (Tg) mice, including the two HLA alleles that are strongly associated with multiple autoimmune disorders (DRB1*0401 and DQA1*0301-DQB1*0302), have been developed and are widely available (Liu et al., 1999; Covassin et al., 2011). Importantly, these HLA-Tg mice present a unique opportunity for in vivo analysis of auto-reactive TCRs derived from humans. Our study describes an efficient and streamlined approach for in vivo expression of human TCRs isolated from T cell monoclonal lines or single T cells.
2. Materials and methods
2.1. Mice
NOD.Cg-Rag1tm1MomIL2rγtm1WjlTg(HLA-DRA,HLA-DRB1*0401)39-2Kito/ScasJ mice (used for both bone marrow donors and recipients) were obtained from Jackson Laboratories, and crossed with NOD.Rag1-tm1Mom to eliminate the IL2rγtm1Wjl mutation in our facility. All mice were housed in specific-pathogen-free conditions. The protocol was approved by the Baylor College of Medicine Institutional Animal Care and Use Committee.
2.2. Patient samples and human leukocyte antigen (HLA) typing
Samples used in this study were collected with informed consent from 3 patients with type 1 diabetes mellitus, under the guidelines of the Institutional Review Board for Protection of Human Subjects. Limited HLA-typing was performed using a gDNA sample isolated from a cell pellet obtained from approximately 500,000 PBMCs. DNA was isolated with gDNA isolation kit (Zymo Research #D3006). Oligonucleotides complementary to the HLA regions containing single nucleotide polymorphism variations (SNPs) were designed, synthesized (Integrated DNA Technologies), and used at to amplify SNP containing regions from gDNA. PCR products were sequenced, and SNPs were used to predict HLA haplotypes for HLA-DRA, HLA-DRB1*0401, HLA-DQA1, and HLA-DQB1 genes. The analysis of the three SNPs allowed us to identify the presence or absence of the DR4-DQ8 haplotype (Nguyen et al., 2013). The primers designed to amplify the SNP containing regions are listed in Supplemental Table 2.
2.3. Isolation and sort purification of individual antigen-responsive peripheral blood CD4+ T cells
PBMCs were isolated from 5 to 10 mL peripheral blood samples through a ficoll© (Sigma-Aldrich) density gradient. Regulatory T cells were depleted from the total PBMC population by magnetic-activated cell separation using anti-human-CD25 antibody (BC69). The remaining PBMCs were counted and mixed 1:1 with feeder cells, which were NOD.Rag−/−IL2rγ−/−Tg(HLA-DR4) splenocytes. Mixed cells were labeled with 5 μM CFSE and plated at 2–2.5 × 10⁵ in 200 μL 10% FCS complete RMPI (2 mM L-glutamine, 1 mM sodium pyruvate, 100 μM MEM nonessential amino acids, 5 mM HEPES, 5.5 × 10⁻⁵ units of 2-mercaptoethanol, 100 U mL−1 penicillin and 100 μg mL−1 streptomycin) in 96-well round-bottomed culture plates. Cells were stimulated with 25 μM peptide antigen, GAD65 epitope 555–567 (F557I) or Insulin B epitope 9–23 (R22E). On the fourth day of culture approximately 100 μL of media was carefully removed and fresh media was added. After eight days of culture, cells were labeled with 0.2 μg fluorescently labeled anti-human-antibodies CD3 (OKT3) and CD4 (OKT4) (Biolegend) and sorted via fluorescence-activated cell sorting (BD FACS Aria II). CD3+CD4+CFSElo cells were individually sorted into 96-well PCR plates (1 cell/well) with the 12th column left empty (88 cells/plate). After sorting, plates were centrifuged at 300g (1200 rpm) for 5 min, and stored at −80 °C for up to 5 months. NOTE: To avoid RNA degradation, plates should be reverse transcribed within a month of sorting. For best results, cells should be directly sorted into the reverse transcription master mix (described below) and reverse transcribed immediately after sorting.
2.4. RT-PCR and multiplex-nested PCR
Primers complementary to all human TCR-α and -β variable region genes were designed based on sequences downloaded from IMGT. Primer sequences can be found in Supplemental Tables 1 and 2. In total, forty-four TCR-α variable-region primers were combined at a concentration of 2.3 μM/primer to generate a Vα primer pool. Similarly, 40 TCR-β variable-region primers were combined at a concentration of 2.3 μM/primer to generate a Vβ-pool primer stock solution. Two sets of constant region primers complementary to the 5′ ends of the TCR-α and TCR-β genes were designed and primer stocks solutions were reconstituted at 10 μM concentration. All primers were individually synthesized (Integrated DNA Technologies).
RNA from individual cells was reverse transcribed using a cDNA RT kit (Applied biosystems #4368814) 10× buffer, 25× dNTP mix, 15 U RT enzyme, 0.01% Triton X-100, 6 U RNase inhibitor and 383 nM final concentration of each custom RT-TCR primer (Integrated DNA Technologies) in a total volume of 6 μL/well. Primer sequences are listed in Supplemental Table 2. The reverse transcription reaction was performed for 10 min at 25 °C, 45 min at 45 °C, and 5 min at 80 °C. For reverse transcription of TCR mRNA isolated from T cell clones, the above reaction was carried out with 0.5–2 μg mRNA in a 40 μL total reaction volume.
The RT reactions were split into duplicate plates and paired TCR α-and β-chains were amplified from 2.5 μL of individual cell cDNA in separate reactions. For T cell clones, 50–200 ng of cDNA was used for each (α and β) reaction. Each TCR chain amplification was carried out in two rounds of PCR. The first PCR reaction was carried out using a multiplex protocol with a pool of variable-region primers (Vα-pool or Vβ-pool) along with an external constant-region primer (TRACext or TRBCext). Primer sequences are listed in Supplemental Tables 1 and 2. Reaction mix contained 5× Go Taq buffer, 80 μM dNTPs, 3%DMSO, 2 μM primer pool (final concentration of each primer was 46 nM), 200 nM constant primer, 0.75 U Go Taq polymerase (VWR #PAM8298), and 2.5 μL RT reaction mixture in a final volume of 25 μL. The PCR cycles were: 5 min at 95 °C followed by 34 cycles of 20 s at 95 °C, 30 s at 54 °C, and 1 min at 72 °C, followed by 7 min at 72 °C.
The second PCR reaction utilized a nested protocol in which an adaptor primer (TRAVada or TRBVada) and internal constant-region primer (TRACint or TRBCint) were used to amplify a sequence within the first reaction product. The nested PCR reaction was carried out in a final volume of 25 μL including 2.5 μL of the multiplex PCR mixture. The nested PCR was performed in a reaction mixture similar to that for the multiplex PCR, with either 200 nM of the alpha adaptor primer and alpha internal constant primer or the beta adaptor primer and beta internal constant primer. Primer sequences are listed in Supplemental Tables 1 and 2. The PCR cycles were: 5 min at 95 °C followed by 34 cycles of 20 s at 95 °C, 30 s at 56 °C, and 1 min at 72 °C, followed by 7 min at 72 °C.
To confirm successful PCR prior to sequencing and subcloning of the product, 5 μL sample of the 25 μL reaction was run out on 1% agarose gel to verify a band around 500 bp. DNA from the remaining reaction was purified using a PCR purification kit (Zymo Research #11-305C). PCR products were then subjected to Sanger sequencing with either the TRAVada primer or TRBVada primer. TCR sequences were analyzed with the IMGT/V-Quest tool (http://www.imgt.org/).
2.5. Generation of chimeric-TCR retroviral vectors and producer cell lines
The variable-regions of TCRα and β chains from individual cells were sequentially inserted into a modified TCR-pMSCVII-Ametrine (pMIA) vector. This vector contains a fluorescent reporter cassette (Ametrine: ex.406 em.526) to facilitate the identification of transduced cells, and is compatible with the widely used GFP reporter. The original mouse 8-1.1 TCR-pMSCVII-Ametrine (pMIA) vector (Bettini et al., 2014; Lee et al., 2016) was modified by quick change mutagenesis to incorporate the SnabI, SacII, BstbI, and MfeI restriction enzyme cut sites on either side of the TCR α and β variable regions of the encoded ‘placeholder’ TCR.
Purified PCR products from the beta nested reaction and the TCR-pMIA vector were digested with BstbI (NEB #R0519S) and MfeI (NEB #R3589L). The digested PCR products were purified using a DNA purification kit (Zymo Research #11-305C). The digested vector backbone (~ 7500 bp) was gel-purified with a gel DNA purification kit (Zymo Research #11-300). Prior to ligation, the vector backbone was treated with CIP enzyme (NEB #M0290S). Ligation reactions were carried out with the insert at 6 M excess to the vector and <150 ng total DNA. DH5α competent cells (Invitrogen #18265017) were used for transformations. Following sequence confirmation of the inserted beta chain, a similar process was performed for insertion of the alpha variable region. Purified alpha nested PCR products and beta containing TCR vectors were digested with SnabI (NEB #R0130L) and SacII (NEB #R0157S), and ligated.
Stable retroviral producer cell lines were generated as previously described (Holst et al., 2006a). Briefly, HEK293T cells were plated in 10 cm culture plates at 2 × 10⁶ cells/plate in 10 mL 5% FCS complete DMEM (C-DMEM) (2 mM L-glutamine, 1 mM sodium pyruvate, 100 μM MEM nonessential amino acids, 5 mM HEPES, 5.5 × 10⁻⁵ units of 2-mercaptoethanol, 100 U mL−1 penicillin and 100 μg mL−1 streptomycin) tissue culture medium in a 10 cm tissue culture treated plate. HEK293T cells were transfected 24 h later with 4 μg chimeric-TCR-pMIA vector, 4 μg pEQ-Pam3(-E) packaging vector, and 2 μg pVSVg envelope vector using TransIt 293T transfection reagent (Mirus #MIR2700). HEK293T cells were incubated overnight at 37 °C. After 24 h the media was removed and replaced with 5% FCS C-DMEM. GP + E-86 cells (ATCC®CRL-9642™) were plated at 1 × 10⁵ cells/plate in 10 cm culture plates containing 10 mL 5% FCS C-DMEM tissue culture medium. After 24 h, supernatant from the HEK293T cells was transferred through 0.45 μm filters to the GP + E-86 cells. Supernatant transfer was performed every 12 h for 3 days. The top 40% of Ametrine+ GP + E-86 cells were sorted by FACS.
2.6. Surface expression and in vitro specificity
HEK293T cells were plated in 12-well culture plates at 1 × 10⁵ cells/well in 1 mL 5% FCS C-DMEM tissue culture medium and transfected with 0.5 μg chimeric-TCR-pMIA vector, 0.5 μg CD3εγδζP2A-pMIG vector, and TransIt 293T transfection reagent (Mirus #MIR2700). HEK293T cells transfected with a fully murine TCR vector (8-1.1-TCR-pMIA) plus CD3εγδζP2A-pMIG vector, 8-1.1-TCR-pMIA vector alone, and CD3εγδζP2A-pMIG vector alone served as controls. After 24 h, fresh medium was added and the cells were kept in culture for two additional days. Surface expression of the chimeric-TCRs was verified by flow cytometry. Transfected HEK293T cell lines were stained with 0.2 μg anti-mouse CD3ε antibody (Biolegend). The MFI of cell-surface CD3ε expression was compared between TCRs.
To determine TCR specificity, T1D4-TCR expressing HEK293T cells were stained with DRB1*0401:GAD115-127 tetramer (provided by Dr. Eddie James). Tetramer binding was assessed by flow cytometry.
2.7. Generation of humanized-retrogenic mice
Humanized-retrogenic mice were generated in a manner similar to that previously described for mouse TCR retrogenic mice (Bettini et al., 2013; Lee et al., 2016). Bone marrow was harvested from the femur, tibia, hip, and humerus of 6–12 week old donor mice 72 h after intraperitoneal injection of 150 mg/kg 5-fluoruracil (5FU) in PBS at a ratio of 1.5 donors: 1 recipient. Using 5% FCS HBSS, 10 mL syringe, and 25 g needle, bone marrow was flushed through a 70 μm filter into 50 mL conical tubes. Bone marrow cells were cultured for 24 h at 40 × 106 cells/15 cm plate in 30 mL of 20% FCS C-DMEM with murine IL-3 (20 ng/mL), human IL-6 (50 ng/mL), and murine stem cell factor (mSCF) (50 ng/mL). To generate the retroviral supernatant, retroviral producers were plated at 3 × 10⁶ cells/15 cm plate in 18 mL 20% FCS C-DMEM for 24 h. Generally 2 plates of each producer cell line were used per 5 mice. After 24 h, bone marrow cells were plated in 6-well culture plates at 3 × 10⁶ cells/well and 3 mL of filtered supernatant from a retroviral producer was added along with mIL-3 (20 ng/mL), hIL-6 (50 ng/mL), mSCF (50 ng/mL), and polybrene (6 μg/mL). Generally 3 wells of transduced bone marrow are used per recipient. Plates were spun at 1000 × g (2500 rpm) for 60 min at 37 °C. Transduction was repeated 24 h later, and cells were left to rest for additional 48 h. Recipient mice were sub-lethally irradiated with 500 rads 24 h prior to bone marrow transfer and placed on antibiotic water. Transduced bone marrow cells were re-suspended in PBS and 2 × 10⁶ cells were injected into each recipient via tail vein injections. To verify reconstitution mice were bled at 6 weeks post-bone marrow transfer. Red blood cells were lysed and the remaining cells were stained with anti-CD4 and anti-CD3. The percent of CD4+ CD3+Ametrine+ cells was determined by flow cytometry. Mice were analyzed 10 weeks post-bone marrow transfer.
3. Results
3.1. Multiplex-nested PCR identification of paired TCR α- and β-chains
Several PCR-based single-cell TCR sequencing protocols have been developed, with a focus on identifying TCRα/β CDR3 regions, as this is the most variable region and confers the majority of the antigen-specificity of a given TCR (Table 1). However, thus far none are compatible with direct sub-cloning of unknown TCRα/β into an expression vector. To overcome this limitation, we designed primers that incorporate unique restriction sites into the 5′ and 3′ ends of the amplified TCRα/β transcripts. This allows for amplification of the TCR α- and β-chains from the transcription start site to the middle of the constant region (Fig. 1A and Supplemental Fig. 1A). All variable region primers (V-primers) were designed to have a similar melting temperature (Tm) around 56 °C for the initial annealing step, before adaptor sequence incorporation. We determined the optimal annealing temperature for the multiplex reaction at 54 °C by using individual and pooled Vα or Vβ primers to amplify TCRs from polyclonal human-PBMC cDNA in a gradient annealing PCR (51–58 °C). We validated the function and specificity of the individual V-primers using polyclonal human-PBMC cDNA. Each V-primer was able to amplify a band of a correct size (Supplemental Fig. 1B). TCR gene specificity was verified by random sample sequencing of 19 PCR products. About 80% of the primers amplified their specific TCR gene, and 20% resulted in amplification of a TCR gene with ≥95% homology. In a single cell setting this minimal non-specific amplification is acceptable, and PCR bias was not a concern, as there is only a single TCR gene to amplify. Individual V-primer specificities were further confirmed during single cell TCR amplification when we were able to identify 30/40 TRBV and 33/44 TRAV genes. The genes that so far have not been identified in our single cell PCR have been previously shown to be low abundance in a human polyclonal repertoire (Eugster et al., 2013; Liaskou et al., 2015).
Fig. 1.
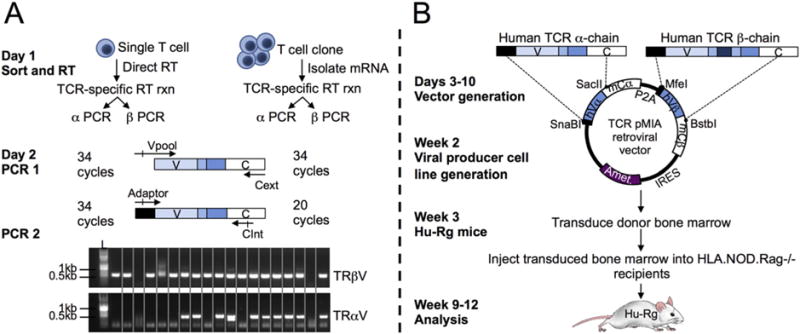
Workflow schematic. TCRs can be identified from single T cells or oligoclonal T cell lines and re-expressed in vivo ready for analysis in 2.5 months. (A) Day 1: Reverse transcribe (RT) mRNA from T cells using TCR specific primers. Day 2: Perform two-step PCR to amplify TCR α- and β-chains. Representative PCR products from single sorted T cells are shown. (B) Day 3–10: Insert TCRβ PCR product into the template retroviral vector. After β insertion is verified, insert TCRα PCR product, and verify insertion. Week 2: Generate GP + E-86 retroviral producer cell lines. Week 3: Using the viral supernatant from TCR-retroviral producer cell line, transduce NOD.Rag−/− bone marrow. Inject transduced bone marrow (i.v.) into sub-lethally irradiated HLA-Tg Rag−/− recipients. Week 8: Verify bone marrow reconstitution based on percent of peripheral T cells in PBMCs of hu-Rg mice.
After the individual primer specificities were verified, primers were mixed to generate a Vα- and Vβ-pools. To validate whether the V-primer pools can identify paired TCR chains from individual cells, we utilized our approach to amplify TCRα/β transcripts from single T cells as well as several monoclonal T cell lines. The primary factor that influenced the success and efficiency of amplification using this method was the time between sorting and reverse transcription of TCR mRNA (Table 2). In general, samples which were single cell sorted and stored at −80 °C for <7 weeks prior to reverse transcription resulted in increased efficiency of TCR amplification. From these samples we were able to detect a TCRα chain from 49 to 60% of cells, a TCRβ chain from 63 to 89% cells, and paired α/β-chains in 45–59% of single sorted T cells (Table 2). Overall, our method considerably increases the efficiency and consistency of paired TCR identification, compared with previously published PCR-based TCR identification protocols (Ozawa et al., 2008; Dash et al., 2011; Walchli et al., 2011; Kim et al., 2012; Eugster et al., 2013; Kobayashi et al., 2013; Linnemann et al., 2013; Turchaninova et al., 2013; Han et al., 2014; Guo et al., 2016; Stubbington et al., 2016) (Table 1).
Table 2.
PCR efficiency.
| Patient/plate | Stored at −80 °C (weeks) | TCRβ identification (%) | TCRα identification (%) | Paired TCR chains (%) |
|---|---|---|---|---|
| Stored at −80 for N7 weeks | ||||
| 2/2 | 18.7 | 30/88 (34) | 34/88 (39) | 11/88 (13) |
| 2/3 | 18.7 | 47/88 (53) | 23/88 (26) | 13/88 (15) |
| 2/4 | 18.7 | 22/88 (25) | 30/88 (34) | 7/88 (8) |
| 2/5 | 18.7 | 13/88 (15) | 25/88 (28) | 7/88 (8) |
| Average | 32% | 32% | 11% | |
| Stored at −80 for >7 weeks | ||||
| 2/1 | 0.7 | 79/88 (90) | 53/88 (60) | 52/88 (59) |
| 3/1 | 1.1 | 55/88 (63) | 51/88 (58) | 40/88 (45) |
| 3/2 | 1.1 | 76/88 (86) | 46/88 (52) | 41/88 (47) |
| 3/3 | 2.1 | 80/88 (91) | 50/88 (57) | 49/88 (56) |
| 3/4 | 2.1 | 77/88 (88) | 43/88 (49) | 42/88 (48) |
| 1/1 | 6.3 | 81/92 (88) | 58/96 (60) | 52/92 (57) |
| Average | 84% | 56% | 52% | |
Select TCR-α and -β PCR products from individual cells were sequentially ligated directly up stream of murine constant regions encoded within the template retroviral vector. This cloning approach results in a human-mouse chimeric TCR construct, with the α and β-chain chains linked by a “cleavable” P2A peptide sequence, allowing for stoichiometric expression of the two chains (Fig. 1B and Supplemental Fig. 2A). Additionally, the retroviral vector contains an IRES-ametrine (ex.406 em.526) fluorescent reporter cassette to facilitate the identification of transduced cells in vitro and in vivo.
3.2. Screening for TCR chain pairing and surface expression of the TCR:CD3 complex
T cells express a single TCR β-chain; however, a significant proportion can rearrange and express a secondary ‘cytoplasmic’ TCR α-chain (Corthay et al., 2001). For this reason it is expected that about 13% of the α-chains identified through the multiplex-nested PCR could be secondary α-chains, of which only few can properly pair with the rearranged β-chain (Corthay et al., 2001). To test cell surface expression of the paired TCR chains, HEK293T cells were co-transfected with a human:mouse chimeric TCR vector and a vector encoding the four murine CD3 chains. Successful cell surface expression of the TCR:CD3 complex was then measured by flow cytometry. Transfection efficiency was about 50%, and was comparable between different TCR vectors (Fig. 2A). Of the nine chimeric TCRs generated, six were able to support TCR complex expression on the surface of HEK293T cells (Fig. 2B). To verify the functionality of these six TCRs, 4G4 thymoma cells were transfected with the TCR constructs and IL-2 production was measured by flow cytometry after stimulation. All six chimeric TCRs resulted in IL-2 production after stimulation with PMA/ionomycin or plate-bound anti-CD3e, which were comparable to full mouse TCR (data not shown). These results indicate that the human:mouse chimeric TCR construct forms a stable TCR:CD3 complex on the cell surface through its interaction with the murine CD3 chains, and that this interaction results in a functional TCR.
Fig. 2.
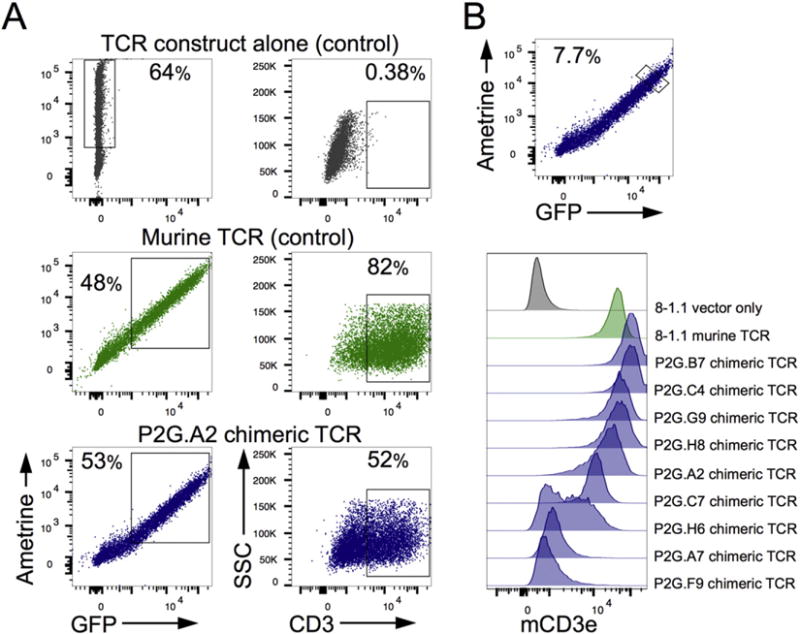
In vitro expression of chimeric TCRs. HEK293T cells were transfected with a TCR construct alone or co-transfected with a construct encoding the murine CD3 complex. (A) Representative flow plots of transfection efficiency and percent of transfected cells expressing CD3 on the cell surface. (B) Levels of cell surface TCR expression were compared between TCRs at similar levels of transfection. Cells were stained with anti-CD3; analysis is gated on Ametrine/GFP expression.
3.3. Development of chimeric CD4+ T cells in humanized-retrogenic mice
To meet a growing need for a viable in vivo system to study multiple human TCRs, we have developed a humanized retrogenic (hu-Rg) mouse system. We modified the previously described retrogenic mouse system (Holst et al., 2006b; Alli et al., 2008; Bettini et al., 2012), and expressed human TCRs on an established HLA transgenic background. Importantly, the retrogenic approach allows us to easily switch out TCRs on the same genetic background, which facilitates analysis of multiple TCRs. Similar to the TCR transgenic model, T cell development, phenotype and function can be evaluated within the thymus and peripheral organs using the hu-Rg system. Additionally, the relevant HLA restriction element is expressed in all tissues, and makes this model applicable for study of autoimmune disorders.
Prior to in vivo TCR expression, the antigenic specificity and HLA restriction should be confirmed by one of two methods: (1) tetramer staining of TCR transfected HEK293T cells, or (2) transfecting a responder cell line and testing TCR stimulation in response to peptide antigen. In order to validate the in vivo functionality of our chimeric construct, we cloned the human T1D4-TCR from an oligoclonal cell line utilizing our multiplex-nested PCR protocol. We chose this TCR as its specificity for the glutamic acid decarboxylase (GAD) 115-127 epitope and DRB1*0401 restriction have been extensively characterized by tetramer staining of the original T cell line (McGinty et al., 2014 and data not shown). Furthermore, the epitope recognized by this TCR is 100% homologous with mouse GAD115-127. Using a similar approach as described for the single cell TCR isolation, we performed multiplex-nested PCR using 125 ng cDNA from the T cell line as a template, and reducing the number of cycles in the second nested reaction from 34 to 20 (Fig. 1A). The TCR-α and TCR-β fragments were sequenced and directly subcloned into the retroviral template vector as described in sections 2.5 and 3.1. Preceding in vivo expression, the antigen specificity of the cloned T1D4-TCR was verified by tetramer staining of HEK293T cells transfected with the retroviral construct (Supplemental Fig. 2B).
Using the T1D4-TCR construct we generated hu-Rg mice on the NOD.DR0401.Rag−/− background through retroviral mediated stem cell gene transfer (Holst et al., 2006b; Bettini et al., 2012). To verify reconstitution of the NOD.DR0401.Rag−/− recipients with the vector transduced bone marrow, mice were bled at 6-weeks post-bone marrow transfer, and PBMCs were analyzed for peripheral expression of the fluorescent reporter (Ametrine) via flow cytometry (Supplemental Fig. 2D). Ametrine+ CD4+ T cells comprised about 20% of PBMCs, which is comparable to traditional murine TCR-Rg mice (Holst et al., 2006b). To confirm the ability of the chimeric TCR to support CD4+ T cell development in vivo, mice were analyzed 10-weeks post-bone marrow transfer. CD4 single positive (SP) cells in the thymus were restricted to the Ametrine+ cell population (Fig. 3A), showing that on the Rag−/− background only cells which harbor the chimeric-TCR construct are able to develop into CD4+ T cells. CD4SP cells accounted for approximately 22% of Ametrine+ thymocytes, indicating that T cell development is supported by the human-mouse chimeric TCR. Furthermore, chimeric TCR expressing T cells comprised about 95% of the Ametrine+ cells in the periphery (Fig. 3B), confirming this as a robust model for in vivo analysis of human derived TCRs. Additionally, T cell development was clearly restricted by the HLA-DR, as the majority of SP thymocytes and peripheral CD3+Ametrine+ T cells expressed the CD4+ co-receptor (over 94% are CD4+ in the lymph nodes) (Fig. 3A, B bottom panel). As previously mentioned, the T1D4-TCR is specific for the self-peptide GAD65(115–127) which is expressed by beta-cells within the pancreatic islets. Thus, to validate this model’s potential for studying the organ infiltrating ability of human tissue-specific TCRs, we assessed T cell accumulation in the islets and found that the T1D4-TCR was able to infiltrate the tissue, albeit at low frequencies (Fig. 3C). This result was in line with previous observations made with mouse GAD reactive TCRs that showed reduced pancreatic infiltration compared to TCRs specific for other beta cell antigens (Lennon et al., 2009), and can be explained by the relatively lower expression of GAD in mouse pancreata (Kim et al., 1993). These data indicate that the hu-Rg system is a viable model for rapid assessment of human TCR development and function in vivo.
Fig. 3.
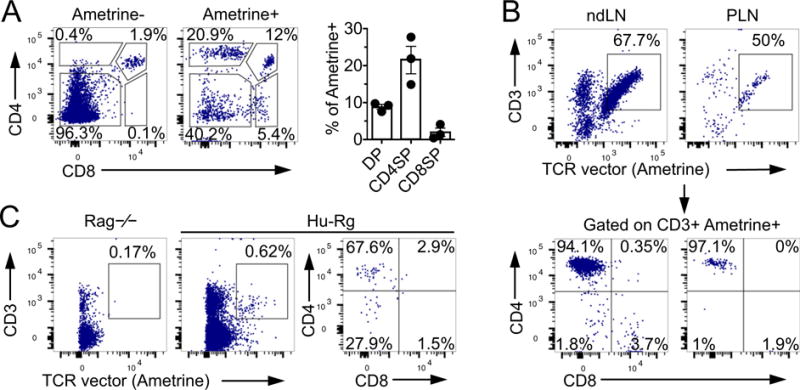
In vivo expression of chimeric TCRs in humanized retrogenic mice (Hu-Rg). (A) Thymocyte development in T1D4-TCR hu-Rg mice (n = 3). (B) Representative analysis of non-draining lymph nodes (LN) and pancreatic LN (PLN) of T1D4-TCR hu-Rg mice. (C) Pancreatic islet infiltration in hu-Rg mice compared to Rag−/− control. Mice were analyzed 10 weeks post bone marrow transfer.
4. Discussion
Although a significant amount of studies regarding the rules that govern the development of self-reactive T cells have been performed in mouse models of autoimmunity, it is hard to confirm the relevance of these findings to human disease. The hu-Rg system is an efficient and flexible model that can directly address a number of assumptions that have been made regarding the development and function of human self-reactive TCRs. Expression of TCRs obtained from autoimmune and healthy samples in hu-Rg mice can be used to define the activation threshold for self-reactive T cells involved in autoimmune disease development. Since the restricting element is expressed in all relevant cells in the HLA-humanized mice, the peripheral function, target organ infiltration, and potential for spontaneous autoimmunity can be assessed in the hu-Rg mice. The efficient TCR sequencing combined with rapid expression of TCRs in HLA-humanized mice allows most laboratories with molecular experience to utilize the system for the study of multiple autoimmune disorders. Importantly, several HLA-Tg mice, including the two HLA alleles that are strongly associated with several autoimmune disorders (DRB1*0401 and DQA1*0301-DQB1*0302), are commercially available (Liu et al., 1999; Covassin et al., 2011).
One of the main strengths of our approach is the ability to amplify the entire variable region, without the need to reconstruct the TCR. Although this method has been developed to efficiently generate an in vivo humanized mouse model, the PCR protocol can also be used for amplification of TCRs for expression in human cells or in vitro systems. Our multiplex-nested PCR products result in an amplification of the complete variable region, which can easily be sub-cloned into a similar template vector with human TCR constant regions. Although, several TCR identification protocols have been published over the years, the PCR approach described here is highly reproducible, and, if performed in a timely manner results at 52% consistent efficiency of paired TCR chain isolation.
In summary, we have described an efficient PCR based protocol for the TCR amplification of single cells or oligoclonal cell lines that is streamlined with an in vivo humanized mouse model. Beyond their potential for the study of TCRs in autoimmunity, we anticipate that the hu-Rg mouse model will be a valuable tool to study human T cell responses to antigen specific immunotherapies, to identify and validate tumor targeting TCRs, as well as study pathogen specific responses. Given the wide availability of HLA transgenic mice, many of which are now commercially available, the hu-Rg model can be easily adapted to study human TCRs with a variety of antigenic specificities.
Supplementary Material
Acknowledgments
We thank Sandra Pena and Andrene McDonald for patient recruitment, Samuel Blum for technical assistance and for the care of the mice used in these studies, Dr. George Makedonas for the gift of antibodies and control DNA used for PCR optimization.
Abbreviations
- TCR
T cell receptor
- HLA
human leukocyte antigen
- hu-Rg
humanized retrogenic
- T1D
type 1 diabetes
- NOD
non-obese diabetic mouse
- PCR
polymerase chain reaction
Appendix A. Supplementary data
Supplementary data to this article can be found online at http://dx.doi.org/10.1016/j.jim.2016.08.010.
Footnotes
This work was supported by the JDRF (1-FAC-2014-243-A-N), American Diabetes Association (7-14-JF-07), the National Institutes of Health (5 P30 DK079638-05 PILOT PJ), and The Robert and Janice McNair Foundation.
Disclosures
The authors declare no competing financial interest.
References
- Alli R, Nguyen P, Geiger TL. Retrogenic modeling of experimental allergic encephalomyelitis associates T cell frequency but not TCR functional affinity with pathogenicity. J Immunol. 2008;181:136–145. doi: 10.4049/jimmunol.181.1.136. [DOI] [PMC free article] [PubMed] [Google Scholar]
- Bankovich AJ, Girvin AT, Moesta AK, Garcia KC. Peptide register shifting within the MHC groove: theory becomes reality. Mol Immunol. 2004;40:1033–1039. doi: 10.1016/j.molimm.2003.11.016. [DOI] [PubMed] [Google Scholar]
- Bettini ML, Bettini M, Vignali DA. T-cell receptor retrogenic mice: a rapid, flexible alternative to T-cell receptor transgenic mice. Immunology. 2012;136:265–272. doi: 10.1111/j.1365-2567.2012.03574.x. [DOI] [PMC free article] [PubMed] [Google Scholar]
- Bettini ML, Bettini M, Nakayama M, Guy CS, Vignali DA. Generation of T cell receptor-retrogenic mice: improved retroviral-mediated stem cell gene transfer. Nat Protoc. 2013;8:1837–1840. doi: 10.1038/nprot.2013.111. [DOI] [PMC free article] [PubMed] [Google Scholar]
- Bettini M, Blanchfield L, Castellaw A, Zhang Q, Nakayama M, Smeltzer MP, Zhang H, Hogquist KA, Evavold BD, Vignali DA. TCR affinity and tolerance mechanisms converge to shape T cell diabetogenic potential. J Immunol. 2014;193:571–579. doi: 10.4049/jimmunol.1400043. [DOI] [PMC free article] [PubMed] [Google Scholar]
- Bonifacio E. Predicting type 1 diabetes using biomarkers. Diabetes Care. 2015;38:989–996. doi: 10.2337/dc15-0101. [DOI] [PubMed] [Google Scholar]
- Chentoufi AA, Polychronakos C. Insulin expression levels in the thymus modulate insulin-specific autoreactive T-cell tolerance the mechanism by which the IDDM2 locus may predispose to diabetes. Diabetes. 2002;51:1383–1390. doi: 10.2337/diabetes.51.5.1383. [DOI] [PubMed] [Google Scholar]
- Corthay A, Nandakumar KS, Holmdahl R. Evaluation of the percentage of peripheral T cells with two different T cell receptor alpha-chains and of their potential role in autoimmunity. J Autoimmun. 2001;16:423–429. doi: 10.1006/jaut.2001.0504. [DOI] [PubMed] [Google Scholar]
- Covassin L, Laning J, Abdi R, Langevin DL, Phillips NE, Shultz LD, Brehm MA. Human peripheral blood CD4 T cell-engrafted non-obese diabetic-scid IL2rγnull H2-Ab1 tm1Gru Tg (human leucocyte antigen D-related 4) mice: a mouse model of human allogeneic graft-versus-host disease. Clin Exp Immunol. 2011;166:269–280. doi: 10.1111/j.1365-2249.2011.04462.x. [DOI] [PMC free article] [PubMed] [Google Scholar]
- Dash P, McClaren JL, Oguin TH, 3rd, Rothwell W, Todd B, Morris MY, Becksfort J, Reynolds C, Brown SA, Doherty PC, Thomas PG. Paired analysis of TCRalpha and TCRbeta chains at the single-cell level in mice. J Clin Invest. 2011;121:288–295. doi: 10.1172/JCI44752. [DOI] [PMC free article] [PubMed] [Google Scholar]
- Delong T, Wiles TA, Baker RL, Bradley B, Barbour G, Reisdorph R, Armstrong M, Powell RL, Reisdorph N, Kumar N, Elso CM, DeNicola M, Bottino R, Powers AC, Harlan DM, Kent SC, Mannering SI, Haskins K. Pathogenic CD4 T cells in type 1 diabetes recognize epitopes formed by peptide fusion. Science. 2016;351:711–714. doi: 10.1126/science.aad2791. [DOI] [PMC free article] [PubMed] [Google Scholar]
- Durinovic-Bello I, Wu RP, Gersuk VH, Sanda S, Shilling HG, Nepom GT. Insulin gene VNTR genotype associates with frequency and phenotype of the autoimmune response to proinsulin. Genes Immun. 2010;11:188–193. doi: 10.1038/gene.2009.108. [DOI] [PMC free article] [PubMed] [Google Scholar]
- Eugster A, Lindner A, Heninger AK, Wilhelm C, Dietz S, Catani M, Ziegler AG, Bonifacio E. Measuring T cell receptor and T cell gene expression diversity in antigen-responsive human CD4+ T cells. J Immunol Methods. 2013:400–401. doi: 10.1016/j.jim.2013.11.003. [DOI] [PubMed] [Google Scholar]
- Eugster A, Lindner A, Catani M, Heninger AK, Dahl A, Klemroth S, Kuhn D, Dietz S, Bickle M, Ziegler AG, Bonifacio E. High diversity in the TCR repertoire of GAD65 autoantigen-specific human CD4+ T cells. J Immunol. 2015;194:2531–2538. doi: 10.4049/jimmunol.1403031. [DOI] [PubMed] [Google Scholar]
- Guo XZ, Dash P, Calverley M, Tomchuck S, Dallas MH, Thomas PG. Rapid cloning, expression, and functional characterization of paired alphabeta and gammadelta T-cell receptor chains from single-cell analysis. Mol Ther Methods Clin Dev. 2016;3:15054. doi: 10.1038/mtm.2015.54. [DOI] [PMC free article] [PubMed] [Google Scholar]
- Han A, Glanville J, Hansmann L, Davis MM. Linking T-cell receptor sequence to functional phenotype at the single-cell level. Nat Biotechnol. 2014;32:684–692. doi: 10.1038/nbt.2938. [DOI] [PMC free article] [PubMed] [Google Scholar]
- Holst J, Szymczak-Workman AL, Vignali KM, Burton AR, Workman CJ, Vignali DA. Generation of T-cell receptor retrogenic mice. Nat Protoc. 2006a;1:406–417. doi: 10.1038/nprot.2006.61. [DOI] [PubMed] [Google Scholar]
- Holst J, Vignali KM, Burton AR, Vignali DA. Rapid analysis of T-cell selection in vivo using T cell-receptor retrogenic mice. Nat Methods. 2006b;3:191–197. doi: 10.1038/nmeth858. [DOI] [PubMed] [Google Scholar]
- Jenkins RN, Nikaein A, Zimmermann A, Meek K, Lipsky PE. T cell receptor V beta gene bias in rheumatoid arthritis. J Clin Invest. 1993;92:2688–2701. doi: 10.1172/JCI116886. [DOI] [PMC free article] [PubMed] [Google Scholar]
- Kim J, Richter W, Aanstoot HJ, Shi Y, Fu Q, Rajotte R, Warnock G, Baekkeskov S. Differential expression of GAD65 and GAD67 in human, rat, and mouse pancreatic islets. Diabetes. 1993;42:1799–1808. doi: 10.2337/diab.42.12.1799. [DOI] [PubMed] [Google Scholar]
- Kim SM, Bhonsle L, Besgen P, Nickel J, Backes A, Held K, Vollmer S, Dornmair K, Prinz JC. Analysis of the paired TCR alpha- and beta-chains of single human T cells. PLoS One. 2012;7:e37338. doi: 10.1371/journal.pone.0037338. [DOI] [PMC free article] [PubMed] [Google Scholar]
- Kobayashi E, Mizukoshi E, Kishi H, Ozawa T, Hamana H, Nagai T, Nakagawa H, Jin A, Kaneko S, Muraguchi A. A new cloning and expression system yields and validates TCRs from blood lymphocytes of patients with cancer within 10 days. Nat Med. 2013;19:1542–1546. doi: 10.1038/nm.3358. [DOI] [PubMed] [Google Scholar]
- Lee KH, Wucherpfennig KW, Wiley DC. Structure of a human insulin peptide-HLA-DQ8 complex and susceptibility to type 1 diabetes. Nat Immunol. 2001;2:501–507. doi: 10.1038/88694. [DOI] [PubMed] [Google Scholar]
- Lee T, Shevchenko I, Sprouse ML, Bettini M, Bettini ML. Retroviral transduction of bone marrow progenitor cells to generate T-cell receptor retrogenic mice. J Vis Exp. 2016;113 doi: 10.3791/54196. [DOI] [PMC free article] [PubMed] [Google Scholar]
- Lennon GP, Bettini M, Burton AR, Vincent E, Arnold PY, Santamaria P, Vignali DA. T cell islet accumulation in type 1 diabetes is a tightly regulated, cell-autonomous event. Immunity. 2009;31:643–653. doi: 10.1016/j.immuni.2009.07.008. [DOI] [PMC free article] [PubMed] [Google Scholar]
- Levisetti MG, Suri A, Petzold SJ, Unanue ER. The insulin-specific T cells of nonobese diabetic mice recognize a weak MHC-binding segment in more than one form. J Immunol. 2007;178:6051–6057. doi: 10.4049/jimmunol.178.10.6051. [DOI] [PubMed] [Google Scholar]
- Liaskou E, Henriksen EK, Holm K, Kaveh F, Hamm D, Fear J, Viken MK, Hov JR, Melum E, Robins H, Olweus J, Karlsen TH, Hirschfield GM. High-throughput T-cell receptor sequencing across chronic liver diseases reveals distinct disease-associated repertoires. Hepatology. 2015;5:1608–1619. doi: 10.1002/hep.28116. [DOI] [PubMed] [Google Scholar]
- Linnemann C, Heemskerk B, Kvistborg P, Kluin RJ, Bolotin DA, Chen X, Bresser K, Nieuwland M, Schotte R, Michels S, Gomez-Eerland R, Jahn L, Hombrink P, Legrand N, Shu CJ, Mamedov IZ, Velds A, Blank CU, Haanen JB, Turchaninova MA, Kerkhoven RM, Spits H, Hadrup SR, Heemskerk MH, Blankenstein T, Chudakov DM, Bendle GM, Schumacher TN. High-throughput identification of antigen-specific TCRs by TCR gene capture. Nat Med. 2013;19:1534–1541. doi: 10.1038/nm.3359. [DOI] [PubMed] [Google Scholar]
- Liu J, Purdy LE, Rabinovitch S, Jevnikar AM, Elliott JF. Major DQ8-restricted T-cell epitopes for human GAD65 mapped using human CD4, DQA1*0301, DQB1*0302 transgenic IA(null) NOD mice. Diabetes. 1999;48:469–477. doi: 10.2337/diabetes.48.3.469. [DOI] [PubMed] [Google Scholar]
- McGinty JW, Chow IT, Greenbaum C, Odegard J, Kwok WW, James EA. Recognition of posttranslationally modified GAD65 epitopes in subjects with type 1 diabetes. Diabetes. 2014;63:3033–3040. doi: 10.2337/db13-1952. [DOI] [PMC free article] [PubMed] [Google Scholar]
- McGinty JW, Marre ML, Bajzik V, Piganelli JD, James EA. T cell epitopes and post-translationally modified epitopes in type 1 diabetes. Curr Diab Rep. 2015;15:90. doi: 10.1007/s11892-015-0657-7. [DOI] [PMC free article] [PubMed] [Google Scholar]
- Mohan JF, Petzold SJ, Unanue ER. Register shifting of an insulin peptide-MHC complex allows diabetogenic T cells to escape thymic deletion. J Exp Med. 2011;208:2375–2383. doi: 10.1084/jem.20111502. [DOI] [PMC free article] [PubMed] [Google Scholar]
- Nguyen C, Varney MD, Harrison LC, Morahan G. Definition of high-risk type 1 diabetes HLA-DR and HLA-DQ types using only three single nucleotide polymorphisms. Diabetes. 2013;62:2135–2140. doi: 10.2337/db12-1398. [DOI] [PMC free article] [PubMed] [Google Scholar]
- Noble JA, Valdes AM. Genetics of the HLA region in the prediction of type 1 diabetes. Curr Diab Rep. 2011;11:533–542. doi: 10.1007/s11892-011-0223-x. [DOI] [PMC free article] [PubMed] [Google Scholar]
- Ozawa T, Tajiri K, Kishi H, Muraguchi A. Comprehensive analysis of the functional TCR repertoire at the single-cell level. Biochem Biophys Res Commun. 2008;367:820–825. doi: 10.1016/j.bbrc.2008.01.011. [DOI] [PubMed] [Google Scholar]
- Pugliese A, Zeller M, Fernandez A, Jr, Zalcberg LJ, Bartlett RJ, Ricordi C, Pietropaolo M, Eisenbarth GS, Bennett ST, Patel DD. The insulin gene is transcribed in the human thymus and transcription levels correlated with allelic variation at the INS VNTR-IDDM2 susceptibility locus for type 1 diabetes. Nat Genet. 1997;15:293–297. doi: 10.1038/ng0397-293. [DOI] [PubMed] [Google Scholar]
- Qi Q, Liu Y, Cheng Y, Glanville J, Zhang D, Lee JY, Olshen RA, Weyand CM, Boyd SD, Goronzy JJ. Diversity and clonal selection in the human T-cell repertoire. Proc Natl Acad Sci U S A. 2014;111:13139–13144. doi: 10.1073/pnas.1409155111. [DOI] [PMC free article] [PubMed] [Google Scholar]
- Qian Z, Latham KA, Whittington KB, Miller DC, Brand DD, Rosloniec EF. An autoantigen-specific, highly restricted T cell repertoire infiltrates the arthritic joints of mice in an HLA-DR1 humanized mouse model of autoimmune arthritis. J Immunol. 2010;185:110–118. doi: 10.4049/jimmunol.1000416. [DOI] [PubMed] [Google Scholar]
- Stubbington MJ, Lonnberg T, Proserpio V, Clare S, Speak AO, Dougan G, Teichmann SA. T cell fate and clonality inference from single-cell transcriptomes. Nat Methods. 2016;13:329–332. doi: 10.1038/nmeth.3800. [DOI] [PMC free article] [PubMed] [Google Scholar]
- Todd JA. Etiology of type 1 diabetes. Immunity. 2010;32:457–467. doi: 10.1016/j.immuni.2010.04.001. [DOI] [PubMed] [Google Scholar]
- Turchaninova MA, Britanova OV, Bolotin DA, Shugay M, Putintseva EV, Staroverov DB, Sharonov G, Shcherbo D, Zvyagin IV, Mamedov IZ, Linnemann C, Schumacher TN, Chudakov DM. Pairing of T-cell receptor chains via emulsion PCR. Eur J Immunol. 2013;43:2507–2515. doi: 10.1002/eji.201343453. [DOI] [PubMed] [Google Scholar]
- Vafiadis P, Bennett ST, Todd JA, Nadeau J, Grabs R, Goodyer CG, Wickramasinghe S, Colle E, Polychronakos C. Insulin expression in human thymus is modulated by INS VNTR alleles at the IDDM2 locus. Nat Genet. 1997;15:289–292. doi: 10.1038/ng0397-289. [DOI] [PubMed] [Google Scholar]
- Walchli S, Loset GA, Kumari S, Johansen JN, Yang W, Sandlie I, Olweus J. A practical approach to T-cell receptor cloning and expression. PLoS One. 2011;6:e27930. doi: 10.1371/journal.pone.0027930. [DOI] [PMC free article] [PubMed] [Google Scholar]
- Yu B, Gauthier L, Hausmann DH, Wucherpfennig KW. Binding of conserved islet peptides by human and murine MHC class II molecules associated with susceptibility to type I diabetes. Eur J Immunol. 2000;30:2497–2506. doi: 10.1002/1521-4141(200009)30:9<2497::AID-IMMU2497>3.0.CO;2-J. [DOI] [PubMed] [Google Scholar]
- Zhao Y, Nguyen P, Ma J, Wu T, Jones LL, Pei D, Cheng C, Geiger TL. Preferential use of public TCR during autoimmune encephalomyelitis. J Immunol. 2016;196:4905–4914. doi: 10.4049/jimmunol.1501029. [DOI] [PMC free article] [PubMed] [Google Scholar]
Associated Data
This section collects any data citations, data availability statements, or supplementary materials included in this article.