

Abstract
Background
STOP-Bang is a tool for predicting the likelihood for sleep-disordered breathing (SDB). In the conventional score, all variables are dichotomous. Our aim was to identify whether modifying the STOP-Bang scoring tool by weighting the variables could improve test characteristics.
Methods
Subjects who participated in the Sleep Heart Health Study (SHHS) were included in this analysis using a derivation dataset (n=1,667) and a validation dataset (n=4,774). In the derivation dataset, each STOP-Bang variable was evaluated using linear regression against the presence of SDB (AHI > 15/hr) in order to determine the coefficients that would allow variable weighting. In other models, BMI, age, and neck circumference were entered as continuous variables. The sum of the weighted dichotomous variables yielded a weighted STOP-Bang (wSTOP-Bang). The sum of the weighted-continuous variables yielded a continuous STOP-Bang (cSTOP-Bang). The wSTOP-Bang, cSTOP-Bang, and the conventional STOP-Bang scores were then applied to the validation dataset and receiver-operating characteristic (ROC) curves were constructed.
Results
The area under the curve (AUC) for cSTOP-Bang (0.738) was greater than the AUC for conventional STOP-Bang (0.706) and wSTOP-Bang (0.69). The sensitivities for cSTOP-Bang, STOP-Bang, and wSTOP-Bang were similar at 93.2%, 93.2%, and 93.3%, respectively. The c-STOP-Bang had a higher specificity (31.8%) than both STOP-Bang (23.2%) and wSTOP-Bang (23.6%). The c-STOP-Bang had a higher likelihood ratio of a positive test (1.36) than both STOP-Bang (1.21) and wSTOP-Bang (1.22).
Conclusions
Modifying the STOP-Bang score by weighting the variables and using continuous variables for BMI, age, and neck circumference can maintain sensitivity while improving specificity, positive likelihood ratio and area under the receiver operating characteristic curve.
Keywords: Obstructive Sleep Apnea, STOP-Bang, Sleep Heart Health Study, Sleep Disordered Breathing
Introduction
Multiple epidemiological studies of obstructive sleep apnea (OSA) in the United States have shown that the public health burden of OSA is high1. Primary care providers -- as gatekeepers of healthcare -- determine whether or not patients are being referred for sleep-apnea evaluations. However, due to time, financial, and organizational constraints, primary care providers need rapid and simple screening tools to identify patients at-risk for OSA. There are several assessment tools that have been used to identify patients at risk for OSA; however, these tools vary widely in their predictive capabilities and need to be tested in community-based populations that are more representative of patients in primary care physicians' office than laboratory-based populations.
The STOP and STOP-Bang scoring tools, developed in 2008 and 2009 by Chung et al., are gaining much popularity. A high risk of OSA is defined as positive responses for ≥ 2 items on the STOP and ≥ 3 items on the STOP-Bang2. Other tools such as the Epworth sleepiness scale (ESS), Berlin Sleep Questionnaire, and 4-variable screening tools have been used and evaluated rigorously. Silva et al. reported that in a community-based population (Sleep Heart Health Study [SHHS]) the STOP-Bang questionnaire had the best sensitivity (SN) for predicting moderate-to-severe OSA (apnea-hypopnea index [AHI]> 15), whereas the 4-Variable tool had the best specificity (SP) for predicting moderate-severe OSA3. While traditionally, the STOP and STOP-Bang have used threshold values, Farney et al. performed weighted models in a laboratory-based population to assess whether such analysis would improve the predictive capability of the STOP-Bang questionnaire. While a weighted model significantly improved the area under the receiver operating curve (AUC) and coefficient of determination, this model was determined to have no clinically significant advantage over a linear model4. Such validation was performed in a laboratory-based population with a high prevalence for OSA, but whether the weighted STOP-Bang measure would perform better in a community-based population is currently unknown.
The purpose of this study was to evaluate whether weighted responses to any of the items in the STOP-Bang scoring tool would improve the test characteristics for predicting OSA in a community-based population. Additionally, we wished to evaluate the sensitivity, specificity, likelihood ratio of a positive and negative test (LR+ and LR-), and AUC for the STOP-Bang in comparison to the weighted STOP-Bang in a community-based population.
Methods
Design and Sample
This study evaluated 6,441 participants who completed in-home polysomnograms (PSGs) in the baseline evaluation of the SHHS5. The SHHS is a prospective multicenter cohort study designed to investigate the relationship of sleep-disordered breathing (SDB) with the development of cardiovascular disease in the United States5. The study participants were recruited from parent cohort studies that were already in progress: Atherosclerosis Risk in Communities Study (1,920 participants), Cardiovascular Health Study (1,248 participants), Framingham Heart Study (1,000 participants), Strong Heart Study (602 participants), New York Hypertension Cohorts (760 participants), and Tucson Epidemiologic Study of Obstructive Airways Disease and the Health and Environment Cohort (911 participants)5. Initial recruitment occurred between December 1995 and January 1998. After recruitment, participants were completed questionnaires related to their sleep and health and had a 1 night home polysomnogram (PSG) performed. The SHHS was approved by an institutional review board for human studies; informed consent was obtained from all participants at the time of enrollment. The SHHS participants completed the Sleep Habits Questionnaire (SHQ) 1 to 2 weeks prior to their home polysomnograms (PSG)5. These questionnaires were checked for completeness and collected by a team of two certified technicians who conducted the in-home PSGs5.
STOP-Bang Questionnaire
The STOP-Bang is a tool developed by Chung et al. (2008) that evaluates eight risk factors for OSA: Snoring, Tiredness, Observed apneas, high blood Pressure, Body mass index (BMI) over 35kg/m2, Age over 50 years, Neck circumference over 40 cm, and male Gender. An affirmative answer to an item in the tool is scored as 1 point, and a negative answer is scored as 0 points. The item scores are added to obtain the total score2. Although Chung et al. (2008) proposed a cut point of 35 kg/m2 for Canadian preoperative patients, Ong et al. (2010) noted that a cut point of 30 kg/m2 identified more Singapore sleep-clinic patients with a high risk for SDB6. For this study, a BMI cut point of 35 kg/m2 was evaluated, as it would compare more directly to the original study of the scoring tool7.
The variables in the SHHS were used to construct approximate answers to each item of the STOP section of the STOP-Bang3. Answers for Snoring were deemed affirmative if participants noted loud snoring on the SHQ. Tiredness or Sleepy was affirmative if the patient reported feeling unrested often or almost always regardless of the amount of sleep obtained and feeling tired all the time, most of the time, or a good bit of the time. Observed apnea answers were noted as affirmative if the participants answered yes to the question, “Based on what you have noticed or household members have told you, are there times when you stop breathing during your sleep?” Answers about high Blood pressure were noted to be affirmative if participants answered yes to whether they were taking medication for high blood pressure. Affirmative answers were given a value of 1; negative answers were given a value of 0. For the Bang section of the STOP-Bang questionnaire, an affirmative answer was scored 1 and a negative answer was scored 0 for each of the following items: Body mass index over 35 kg/m2, Age over 50 years old, Neck circumference over 40 cm, and male Gender. Some subjects had missing data and thus the total values for each variable may vary from the total sample.
In-Home Polysomnograms
The PSGs were completed using a Compumedics Portable PS-2 System (Abbottsville, Victoria, Australia)8. Participants were asked to schedule the arrival of the certified technicians approximately two hours before their normal bedtimes and to make their sleep times and environments as close to their usual patterns as possible. The evening visit lasted between 1.5 to 2 hours8. The PSG montage included the following: right and left electroculograms; bipolar submental electromyogram; thoracic and abdominal inductive plethysmographic bands; electrocardiogram; oximeter; and sensors for airflow, heart rate, body position, and ambient light8. Placement and calibration of all equipment and sensors were done by a team of two certified technicians during the evening visit8.
The sleep parameters' results were scored per the guidelines developed by Rechtschaffen and Kales (1968). Apneas were defined as a complete or nearly complete absence of airflow, as measured by the thermocouple sensor signal, for 10 seconds or more9. Hypopneas were defined as a decrease in amplitude from the participant's baseline airflow or volume of at least 30% that lasted at least 10 seconds9. Only apneas and hypopneas associated with an oxygen desaturation of 4% or more were used to determine the AHI, the average number of respiratory events per hour of sleep10.
Analysis
Data from the baseline SHHS home visit for subjects with complete PSGs were included in the present analysis. The study population was randomly divided into a derivation dataset (n=1,667), and a validation dataset (n=4,774) and the frequencies of each dichotomous variable in the STOP-Bang score were determined. The BMI, age, and neck circumference variables were used as dichotomous variables and in a second model as continuous variables. Differences in proportions between the derivation and validation data set were assessed using chi-square test for categorical variables. Differences in means for continuous variables were assessed using t-tests. SDB was defined as an apnea-hypopnea index ≥ 15 per hour with 4% oxygen desaturation threshold. Utilizing the initial derivation dataset and univariate logistic regression models we determine the standardized beta coefficients (coefficient) that would allow us to weight the variables. In these models each of the individual STOP-Bang variables were entered as predictor variables and the presence or absence of SDB as the outcome variable. Using the coefficients for each variable we constructed a new scoring model. The coefficients are used to compare the relative strength of the various predictors within the model. Because the standardized beta coefficients are all measured in standard deviations, instead of the units of the variables, they can be compared to one another. The sum of the weighted dichotomous variables yielded a weighted STOP-Bang score (wSTOP-Bang). Further regression models were constructed using BMI, age, and neck circumference as continuous variables as opposed to dichotomous variables, the coefficients for each variable were then use to construct a second scoring model, continuous STOP-Bang (cSTOP-Bang). The cSTOP-Bang tool used the aforementioned continuous variables in addition to the traditional dichotomous variables for snoring, tired or sleepy, hypertension, observed apnea, and gender. The wSTOP-Bang, cSTOP-Bang, and the conventional STOP-Bang scores were then applied to the validation dataset and the AUCs, sensitivity, specificity, and LR+ and LR- were compared.
Results
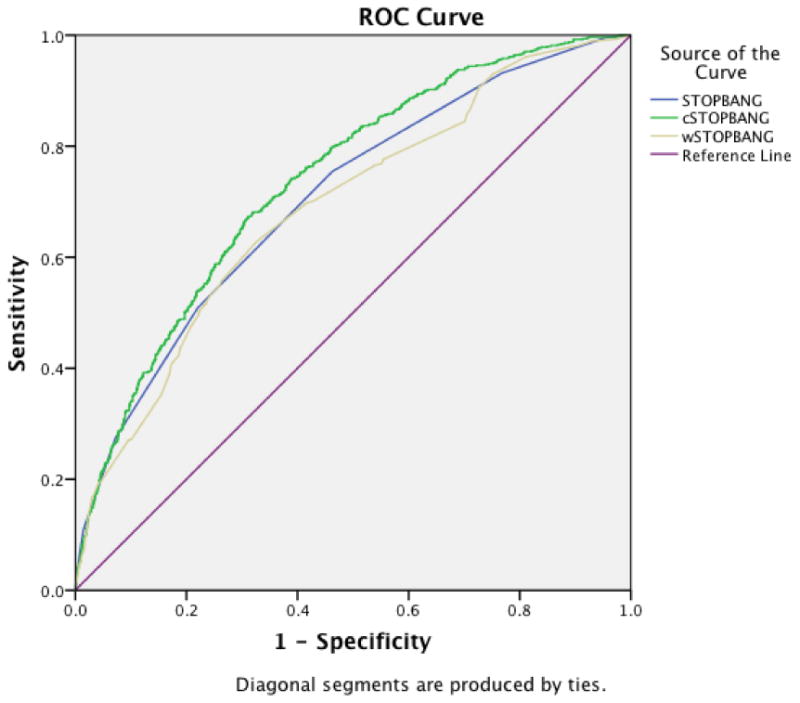
Demographic characteristics for the dichotomous variables are presented in table 1. There were no differences noted between the derivation and the validation samples, except for gender. There were proportionally more men in the derivation dataset. This may have also explained the proportionally higher number of subjects with neck circumferences greater than 40 cm. Table 2 shows the demographic characteristics for the continuous variables. There were no differences in means between the derivation and the validation samples, except for neck circumference where there was a higher mean in the derivation sample likely due to the higher proportion of men in that sample. The linear regression coefficients for the STOP-Bang dichotomous variables predicting SDB are shown in table 3. Snoring and tired or sleepy have negative and non-significant coefficients predicting SDB, observed apnea, BMI, and gender have the highest coefficients predicting SDB. After applying the derived wSTOP-Bang to the validation data we obtained the AUC. The AUC for the cSTOP-Bang was 0.738 with a standard error (SE) of 0.010 (95% confidence interval [CI] 0.72, 0.76) and was greater than the AUC for the conventional STOP-Bang, which had an AUC of 0.71 with a SE of 0.01 (95% CI 0.68, 0.73), and the wSTOP-Bang, which had an AUC of 0.69 with a SE of 0.01 (95% CI 0.67, 0.71) (Table 4; Figure 1).
Table 1.
Sample characteristics for dichotomous variables.
| Variable | Derivation dataset (n=1667) | Validation dataset (n=4774) | p-value | |
|---|---|---|---|---|
| Number (%) | Number (%) | |||
| Snoring | Yes | 485 (29.1) | 1387 (29.1) | 0.93 |
| No | 1162 (69.7) | 3339 (69.9) | ||
| Tired/Sleepy | Yes | 1281 (76.8) | 3703 (77.6) | 0.79 |
| No | 84 (5.0) | 251 (5.3) | ||
| Observed Apnea | Yes | 188 (11.3) | 597 (12.5) | 0.22 |
| No | 1436 (86.1) | 4094 (85.8) | ||
| Elevated Blood Pressure | Yes | 706 (42.4) | 2031 (42.5) | 0.89 |
| No | 961 (57.6) | 2743 (57.5) | ||
| BMI > 35 kg/m2 | Yes | 177 (10.6) | 512 (10.7) | 0.88 |
| No | 1465 (87.9) | 4179 (87.5) | ||
| Age > 50 years | Yes | 1431 (85.8) | 4124 (86.4) | 0.61 |
| No | 235 (14.1) | 650 (13.6) | ||
| Neck circumference > 40cm | Yes | 501 (30.1) | 1339 (28.0) | 0.10 |
| No | 1155 (69.3) | 3413 (71.5) | ||
| Gender | Female | 846 (50.7) | 2559 (53.6) | 0.04 |
| Male | 821 (49.3) | 2215 (46.4) |
p-value for chi-square difference in proportion between derivation and validation data sets.
Table 2.
Sample characteristics for continuous variables.
| Variable | Derivation sample (n=1667) | Validation sample (n=4774) | p-value | ||||||
|---|---|---|---|---|---|---|---|---|---|
| Mean | Max. | Min. | SD | Mean | Max. | Min. | SD | ||
| BMI (kg/m2) | 28.6 | 56.8 | 12.0 | 5.3 | 28.5 | 58.9 | 12.1 | 5.4 | 0.67 |
| Age (years) | 62.9 | 98.0 | 39.0 | 10.9 | 62.9 | 100 | 39.0 | 11.0 | 0.89 |
| Neck circumference (cm) | 38.1 | 59.0 | 22.5 | 4.3 | 37.9 | 56.0 | 22.0 | 4.2 | 0.05 |
p-value for t-test comparing derivation and validation samples.
Table 3.
Individual linear regression models used to determine coefficients for the STOP-Bang dichotomous variables predicting AHI.
| Variable | Unstandardized beta coefficient | Standard error | Standardized beta coefficient | t | Significance | 95% confidence interval |
|---|---|---|---|---|---|---|
| Snoring | -0.04 | 0.021 | -0.047 | -1.9 | .056 | 0.172 - 0.217 |
| Tired/Sleepy | -0.075 | 0.043 | -0.047 | -1.739 | 0.082 | -0.160 - 0.010 |
| Observed Apnea | 0.248 | 0.029 | 0.205 | 8.41 | 0.000 | 0.190 - 0.306 |
| Elevated Blood Pressure | 0.051 | 0.019 | 0.064 | 2.629 | 0.009 | 0.013 - 0.088 |
| BMI | 0.018 | 0.002 | 0.243 | 10.147 | 0.000 | 0.014 - 0.021 |
| Age | 0.003 | 0.001 | 0.078 | 3.201 | 0.001 | 0.001 - 0.004 |
| Neck circumference | 0.028 | 0.002 | 0.317 | 13.57 | 0.000 | 0.024 - 0.033 |
| Gender | 0.159 | 0.019 | 0.205 | 8.54 | 0.000 | 0.123 - 0.196 |
Table 4.
Areas under the curve for the STOP-Bang, cSTOP-Bang, and wSTOP-Bang.
| Test Result Variable(s) | Area | Std. Error | Asymptotic Sig. | Asymptotic 95% Confidence Interval | |
|---|---|---|---|---|---|
| Lower Bound | Upper Bound | ||||
| STOP-Bang | .706 | .011 | .000 | .683 | .728 |
| cSTOP-Bang | .738 | .010 | .000 | .717 | .758 |
| wSTOP-Bang | .690 | .011 | .000 | .668 | .713 |
Figure 1. Receiver Operating Curve for each scoring model compared to the reference line.
Using the recommended cut-off point of 3 for the conventional STOP-Bang, the sensitivity was 93.2%, specificity was 23.2%, with 35% percent of subjects being correctly classified by the scoring tool. By increasing the cut-off point to 4, in order to increase specificity, sensitivity fell to 75.43% (Table 5). Again, the possible outcomes ranged from 0 to 8. Due to the nature of the wSTOP-bang model, both fractions and whole numbers were possible scores. As some coefficients were negative, possible outcomes ranged from -0.517 to 3.474. Thus, a cut-off value of 0.594 yielded a sensitivity of 93.3% and specificity of 23.6%, with 35.8% of subjects being correctly classified by the scoring tool (Table 6). This cutoff was selected at it yielded the maximal sensitivity for the screening tool. In comparison to the traditional scoring tool, there was no improvement in specificity over the conventional STOP-Bang for any given sensitivity. Similar to the wSTOP-Bang, the cSTOP-Bang has the possibility of both whole numbers and fractions. Since BMI, Age and Neck circumference were used as continuous variables as opposed to dichotomous variables, the number of possible outcomes increases significantly. However, by selecting a cut-off value that would produce a similar sensitivity to the conventional STOP-Bang, there was a notable increase in specificity. Outcomes ranged from 16.21 to 33.55. A cut-off value of 22.3 yielded a sensitivity of 93.2% and specificity of 31.8%, with 42.2% of subjects being correctly classified. Furthermore, if the cut-off is reduced to 21.6, sensitivity can be increased to 95.7% while specificity remains similar to conventional STOP-Bang at 23.2% with 35.4% of subjects being correctly classified (Table 7).
Table 5.
STOP-Bang sensitivity, specificity, and likelihood ratios.
| Cutpoint | Sensitivity | Specificity | Correctly classified | LR+ | LR- |
|---|---|---|---|---|---|
| ≥ 0 | 100% | 0% | 16.82% | 1.0000 | 0.0000 |
| ≥ 1 | 100% | 0.22% | 17.00% | 1.0022 | 0.0000 |
| ≥ 2 | 99.53% | 4.59% | 20.56% | 1.0432 | 0.1016 |
| ≥ 3 | 93.16% | 23.24% | 35.00% | 1.2136 | 0.2945 |
| ≥ 4 | 75.43% | 53.77% | 57.42% | 1.6317 | 0.4570 |
| ≥ 5 | 50.86% | 77.99% | 73.42% | 2.3103 | 0.6302 |
| ≥ 6 | 27.37% | 92.80% | 81.79% | 3.8010 | 0.7826 |
| ≥ 7 | 10.89% | 98.55% | 83.81% | 7.5259 | 0.9042 |
| ≥ 8 | 2.33% | 99.81% | 83.42% | 12.3642 | 0.9785 |
Table 6. wSTOP-Bang sensitivity, specificity, and likelihood ratios (only selected values are shown).
| Cutpoint | Sensitivity | Specificity | Correctly classified | LR+ | LR- |
|---|---|---|---|---|---|
| ≥ 0 | 98.69% | 6.40% | 22.58% | 1.0543 | 0.2053 |
| ≥ 0.594 | 93.31% | 23.57% | 35.80% | 1.2209 | 0.2838 |
| ≥ 1 | 78.73% | 42.24% | 48.64% | 1.3631 | 0.5035 |
| ≥ 2 | 40.98% | 82.14% | 74.93% | 2.2950 | 0.7185 |
| ≥ 3 | 9.56% | 97.84% | 82.36% | 4.4270 | 0.9244 |
| ≥ 3.41 | 1.91% | 99.77% | 82.61% | 8.3622 | 0.9831 |
Table 7. cSTOP-Bang sensitivity, specificity, and likelihood ratios (only selected values are shown).
| Cutpoint | Sensitivity | Specificity | Correctly classified | LR+ | LR- |
|---|---|---|---|---|---|
| ≥ 16.21 | 100% | 0% | 16.85% | 1.0000 | 0.0000 |
| ≥ 19.02 | 99.69% | 2.77% | 19.10% | 1.0253 | 0.1121 |
| ≥ 21.00 | 97.83% | 15.34% | 29.24% | 1.1555 | 0.1415 |
| ≥ 21.61 | 95.66% | 23.16% | 35.38% | 1.2449 | 0.1874 |
| ≥ 22.28 | 93.18% | 31.80% | 42.15% | 1.3663 | 0.2145 |
| ≥ 25.00 | 56.59% | 75.71% | 72.48% | 2.3295 | 0.5734 |
| ≥ 26.00 | 39.22% | 87.65% | 79.49% | 3.1759 | 0.6934 |
| ≥ 28.00 | 12.71% | 97.64% | 83.33% | 5.3938 | 0.8939 |
| ≥ 30.02 | 2.33% | 99.78% | 83.36% | 10.5715 | 0.9789 |
| ≥ 33.5 | 0.00% | 99.97% | 83.12% | 0.0000 | 1.0003 |
Discussion
Several tools have been used to estimate the pretest probability of OSA prior to polysomnography. The Epworth Sleepiness Scale (ESS), developed in 1991 by Johns et al., was the traditional screening method for determining the need for further OSA evaluation. While higher scores (ESS > 10) correlate with moderate-to-severe OSA, the ESS was developed to measure the likelihood of sleep onset rather than to determine OSA risk11. The Berlin Questionnaire (BQ) categorizes items known as OSA risk factors. Category 1 includes items on the presence of snoring, Category 2 includes items on daytime sleepiness, and Category 3 includes items on hypertension and obesity. Positive item responses in two of three categories identifies patients at risk for OSA12. The simple 4-Variable screening tool consists of only four variables: gender, blood pressure, body mass index (BMI), and reported snoring. Values are assigned to each variable; blood pressure and BMI are assigned values based on predetermined ranges. The final score for the 4-Variable screening tool is determined by a linear regression formula. A final score of ≥ 14 indicates a high risk for OSA13.
A systematic review in 2010 by Abrishami et al reported that the BQ, overall, had the highest sensitivity (SN; 80%) and specificity (SP; 76%) for predicting OSA (apnea- hypopnea index [AHI] ≥ 5 events per hour) in persons without a history of sleep disorders14. Silva et al. compared the ESS, STOP, STOP-Bang, and the 4-Variable screening tools using data from the Sleep Heart Health Study (SHHS), a community-based epidemiological study. Values were assigned to the items in the four tools by extrapolating the SHHS data3. They reported that for predicting moderate-to-severe OSA (AHI > 15), the ESS had a sensitivity (SN) of 39% and a specificity (SP) of 71%, the STOP had a SN of 62% and a SP of 56%, the STOP-Bang had a SN of 87% and a SP of 43%, and the 4-Variable tool had a SN of 24% and a SP of 93%3. Based on the SHHS data, the STOP-Bang was determined to be a simple, rapid, and sensitive assessment tool for moderate-to-severe OSA in the general population3. The STOP-Bang identifies persons as high risk if there are at least three affirmative responses to the eight items. Interestingly, a 51-year-old male with hypertension would be classified as high risk without any additional OSA risk factors; whereas, a 40-year-old female who has a BMI over 35 kg/m2 and witnessed apnea would be considered lower risk with only two affirmative answers.
Farney et al. noted that as STOP-Bang scores increased from 0 to 3, the probability of having any degree of sleep apnea increased. Also, as the scores increased > 3, the probability of severe sleep apnea increased, while the probability for lesser degrees of sleep apnea decreased. In effect, scores < 3 virtually excluded the possibility of OSA, scores between 3-5 were equivalent for determining the degree of sleep apnea, and scores 6-8 were highly predictive of severe OSA4. Notably, Farney et al. constructed three analytical models, including linear, curvilinear, and weighted. While a weighted model significantly improved the area under the receiver operating curve (AUC) and coefficient of determination, this model was determined to have no clinically significant advantage over a linear model4.
The conventional STOP-Bang scoring tool is a simple and rapid screening tool for identifying those at risk for moderate to severe obstructive sleep apnea. However, STOP-Bang questionnaire's sensitivity for detecting SDB is low and thus carries a high false positive rate at the defined cut-off. By increasing the cut-off to improve specificity, sensitivity drops to unacceptable levels. When comparing wSTOP-Bang to traditional STOP-bang, there was no improvement in specificity at cutoff levels with similar sensitivity. By weighting each variable and using BMI, Age, and Neck circumference as continuous variables, this study has shown that STOP-Bang can be modified in order to maintain sensitivity while increasing specificity. cSTOP-Bang correctly classified more subjects than did STOP-Bang. One drawback to the cSTOP-bang is that a calculator must be used to determine the score. The benefit of the STOP-Bang is that there are only 8 possible outcomes, while there are innumerable possibilities with cSTOP-Bang. However, the model can easily be constructed into a calculator application with the value for each variable manually entered and the final score generated by the calculator. With the propagation of electronic health record systems in the clinical setting, the calculation can be done automatically with data entry done by staff. While there was a statistically significant improvement in specificity, there remains to be seen whether a clinical significance exists. Theoretically, by improving specificity while maintaining sensitivity, fewer false positives will occur. As in-lab overnight polysomnograms are costly and time-intensive studies, there can be a cost savings by using a more robust scoring tool.
Another improvement to the conventional STOP-Bang scoring tool could be the addition of more variables. Chung,et al (2013) showed that by adding a serum bicarbonate level cut-off of ≥ 28 mmol/L to STOP-Bang, specificity for moderate-to-severe OSA at a score of ≥ 3 improved to 81.7%.15. That study was conducted using a cohort of peri-operative patients. Further studies utilizing general population based cohorts should be conducted to determine if serum bicarbonate level adds utility to STOP-Bang in those populations. Additional variables could also be investigated. Race, tobacco status, concomitant cardiopulmonary conditions, and Mallampati grade are all possible variables that may improve upon STOP-Bang and cSTOP-Bang.
Acknowledgments
The authors would like to acknowledge the Sleep Heart Health Study (SHHS) cohort implemented by the National Heart Lung & Blood Institute and supported by grants (U01HL53916, U01HL53931, U01HL53934, U01HL53937, U01HL53938, U01HL53940, U01HL53941, U01HL64360) from the National Institutes of Health.
Footnotes
Conflict of Interest: The authors declare that they have no conflict of interest.
Presented at SLEEP 2014, the 28th Annual Meeting of the Associated Professional Sleep Societies, LLC (APSS), held at the Minneapolis Convention Center on Monday, June 2, 2014. Presentation control ID #1223.
References
- 1.Lee W, Nagubadi S, Kryger MH, Mokhlesi B. Epidemiology of obstructive sleep apnea: a population-based perspective. Expert Rev Respir Med. 2008;2(3):349–364. doi: 10.1586/17476348.2.3.349. [DOI] [PMC free article] [PubMed] [Google Scholar]
- 2.Chung F, Yegneswaran B, Liao P, Chung SA, Vairavanathan S, Islam S, Khajehdehi A, Shapiro CM. STOP questionnaire: a tool to screen patients for obstructive sleep apnea. Anesthesiology. 2008;108(5):812–821. doi: 10.1097/ALN.0b013e31816d83e4. [DOI] [PubMed] [Google Scholar]
- 3.Silva GE, Vana KD, Goodwin JL, Sherrill DL, Quan SF. Identification of patients with sleep disordered breathing: comparing the Four-Variable screening tool, STOP, STOP-Bang, and Epworth Sleepiness Scales. J Clin Sleep Med. 2011;7(5):467–472. doi: 10.5664/JCSM.1308. [DOI] [PMC free article] [PubMed] [Google Scholar]
- 4.Farney RJ, Walker BS, Farney RM, Snow GL, Walker JM. The STOP-Bang equivalent model and prediction of severity of obstructive sleep apnea: relation to polysomnographic measurements of the apnea/hypopnea index. J Clin Sleep Med. 2011;7:459–465. doi: 10.5664/JCSM.1306. [DOI] [PMC free article] [PubMed] [Google Scholar]
- 5.Quan SF, Howard BV, Iber C, et al. The Sleep Heart Health Study: design, rationale, and methods. Sleep. 1997;20:1077–85. [PubMed] [Google Scholar]
- 6.Ong TH, Raudha S, Fook-Chong S, Lew N, Hsu AAL. Simplifying STOP-BANG: use of a simple questionnaire to screen for OSA in an Asian population. Sleep Breath. 2010;14:371–376. doi: 10.1007/s11325-010-0350-7. [DOI] [PubMed] [Google Scholar]
- 7.Vana KD, Silva GE, Goldberg R. Predictive abilities of the STOP-Bang and Epworth Sleepiness Scale in identifying sleep clinic patients at high risk for obstructive sleep apnea. Research in Nursing & Health. 2013;36:84–94. doi: 10.1002/nur.21512. [DOI] [PubMed] [Google Scholar]
- 8.Redline S, Sanders MH, Lind LK, et al. Methods for obtaining and analyzing unattended polysomnography data for a multicenter study. Sleep Heart Health research Group Sleep. 1998;21:759–67. [PubMed] [Google Scholar]
- 9.Rechtschaffen A, Kales A. Manual of standardized techniques and scoring system for sleep stages of human subjects. Los Angeles: UCLA Brain Information Services and Brain Research Institute; 1968. [Google Scholar]
- 10.Iber C, Ancoli-Israel S, Chesson AL, Jr, Quan SF. The AASM manual for the scoring of sleep and associated events: rules, terminology and technical specifications. Westchester, IL: American Academy of Sleep Medicine; 2007. [Google Scholar]
- 11.Johns MW. A new method for measuring daytime sleepiness: the Epworth Sleepiness Scale. Sleep. 1991;14(6):540–545. doi: 10.1093/sleep/14.6.540. [DOI] [PubMed] [Google Scholar]
- 12.Netzer NC, Stoohs RA, Netzer CM, Clark K, Strohl KP. Using the Berlin Questionnaire to identify patients at risk for the sleep apnea syndrome. Ann Intern Med. 1999;131(7):485–491. doi: 10.7326/0003-4819-131-7-199910050-00002. [DOI] [PubMed] [Google Scholar]
- 13.Takegami M, Hashino Y, Chin K, Sokejima S, Kodtani H. Simple four-variable screening tool for identification of patients with sleep-disordered breathing. Sleep. 2009;32:939–948. [PMC free article] [PubMed] [Google Scholar]
- 14.Abrishami A, Khajehdehi A, Chung F. A systematic review of screening questionnaires for obstructive sleep apnea. Can J Anesth. 2010;57:423–438. doi: 10.1007/s12630-010-9280-x. [DOI] [PubMed] [Google Scholar]
- 15.Chung F, Chau E, Yang Y, Liao P, Hall R, Mokhlesi B. Serum bicarbonate level improves specificity of STOP-Bang screening for obstructive sleep apnea. Chest. 2013;143(5):1284–93. doi: 10.1378/chest.12-1132. [DOI] [PubMed] [Google Scholar]