

Abstract
Objective: This study examined the association between 5‐aminolevulinic acid (5‐ALA) and glucose tolerance.
Design: A double blinded, randomized prospective parallel‐group comparison study.
Setting: Participants were recruited from the community in Honolulu, Hawaii, using radio and TV ads, and at community events.
Participants: One hundred fifty‐four males and females ages 40–70 years, with evidence of prediabetes: hemoglobin A1c (HbA1c) 5.8%–7.0% at the screening visit.
Intervention: Participants were randomized equally to one of three study groups: (1) low dose 5‐ALA supplement (15 mg capsule); (2) high dose 5‐ALA (50 mg capsule); and (3) control (placebo capsule of identical size and color).
Main outcome measures: HbA1c and 2 hours post‐oral glucose tolerance test (OGTT) glucose levels.
Results: Among individuals taking 5‐ALA supplements for 12 weeks, 2 hours post‐OGTT glucose levels declined significantly compared to those not taking the supplement (p= 0.02). The relationships were stronger among those with baseline glucose intolerance, or 2 hours post‐OGTT glucose measurements greater than 140 mg/dL (p= 0.005 and p= 0.02 for the low and high dose group, respectively). Similar trends were observed for HbA1c but results were of borderline significance (p= 0.07). No untoward effects were reported.
Conclusions: Further studies are indicated. The potential benefits of 5‐ALA dietary supplementation are affirmed by this investigation. Clin Trans Sci 2012; Volume 5: 314–320
Keywords: diabetes, glucose, metabolism, diabetes mellitus
Introduction
5‐Aminolevulinic acid (5‐ALA) is a naturally occurring amino acid. It is a natural delta amino acid. As a nonalpha amino acid, it is not a component of proteins. 5‐ALA is synthesized in the mitochondria. It is a precursor of both chlorophyll and heme. The safety of the use of modest doses of 5‐ALA has been demonstrated by animal and human studies. The action of 5‐ALA is described in Figure 1 . 1 The dynamics of 5‐ALA metabolism are reflected in Figure 2 . The availability of iron has been shown to be important in the endogenous formation of protoporphyrin IX from ALA, thus the internal heme pool is an important component of 5‐ALA action. 1 , 2 , 3 5‐ALA is the first compound in the porphyrin synthesis pathway. Porphyrins are organic compounds and one of the most recognized is heme, a cofactor of hemoglobin. 2
Figure 1.
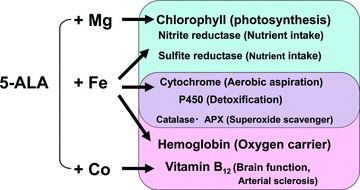
5‐ALA: Origin of life from phytosynthesis in plants to hemoglobin/vitamin B12 in animals.
Figure 2.
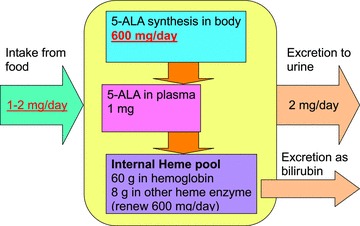
Dynamics of 5‐ALA metabolism in the human body.
The product used in this investigation contains three components: (1) 5‐ALA, (2) sodium ferrous citrate (SFC), and (3) corn starch as filler. It is classified as nongenetically modified organism, bovine spongiform encephalopathy‐free, and alcohol free. The products tested are manufactured under food good manufacturing practice conditions. A certificate of analysis is available. No heavy metals (Pb, As, Hg, Cd) were detected and microbial analysis revealed viable bacterial counts <300/g. Neither Escherichia colior Staphylococcus aureus were detected. 2
Recently the use of 5‐ALA to improve glucose intolerance has been considered. A summary of the existing literature on this amino acid is provided below. The potential relationship between 5‐ALA and diabetes and its mode of action is described. The methods for exploring the potential of a relationship between 5‐ALA and glucose tolerance are provided and the implications of this blinded, randomized study are discussed. 4
Production methods
Recent innovations at COSMO Oil Co, Ltd., Tokyo, Japan, have made a new fermentation process possible which reduces the cost of 5‐ALA production and makes this supplement available at a reasonable cost.
Research has shown that increased production of glucose in the cell leads to decreased 5‐ALA production. At the same time, decreased heme production occurs with aging. This results in decreased heme enzyme activity. A decline in the mitochondrial electron transfer system follows, and this may result in decreased basal metabolism as well as a physical decline. 5
5‐ALA is also used for intraoperative detection of malignant gliomas 4 , 6 and as a photosensitizer for photodynamic therapy. 5 Photodynamic therapy is a nonconventional form of light therapy for treatment of cancer. 7 , 8 No phototoxicity has been reported at low doses, 8 , 9 , 10 , 11 , 12 , 13 which are similar to concentrations found in many common foods (Cosmo Oil SBI, personal communication, 2011). As can be noted in Table 1 , a daily supplemental dose of 5‐ALA results from the intake of foods which most individuals eat everyday.
Table 1.
Common foods that contain 5‐ALA.
| Food | 5‐ALA content in mg/kg |
|---|---|
| Spinach | 0.18 |
| Green pepper | 0.23 |
| Tomato | 0.13 |
| Shitake mushroom | 0.60 |
| Potato | 0.12 |
| Banana | 0.40 |
| Squid | 0.50 |
| Octopus | 1.0 |
| Ground beef | 0.13 |
| Fermented products | |
| Shochu lees | 70 |
| Sake lees | 9—26 |
| Baker’s yeast | 140 |
| Product | 5‐ALA content in mg/L |
| Wine | 1.4–1.22 |
| Vinegar | 0–1‐5 |
| Sweet sake | 0.4—6 |
| Sake for cooking | 0.3—13 |
| Sake | 0.9–4.5 |
| Soy sauce | 0.3 |
Diabetes and 5‐ALA
Glucose intolerance which leads to type 2 diabetes is currently thought to begin with lipid accumulation which induces adipocytokines to decrease insulin sensitivity in cells. This causes an increase in the blood sugar level which in turn causes glycoproteins to accumulate in the blood vessels. In addition, insufficient production of cytochrome causes a decline in the mitochondria electron transfer system; that is, it lowers the basal metabolism. Animal research has shown that administration of 5‐ALA can directly enhance aerobic energy metabolism. 15
We hypothesize a genetic or induced shortage of heme may lead to type 2 diabetes. We propose the following mechanism: Decreased basal metabolism from aging or overeating increases glucose concentration in cells. The glucose effect decreases 5‐ALA synthesis. Decreased production of heme decreases heme enzyme activity and causes a decline in the mitochondrial electron transfer system, which decreases consumption of glucose. 16 This leads to a further increase in glucose concentration in cells, which inhibits 5‐ALA production. Insensitivity to insulin may be caused by a defensive reaction to protect 5‐ALA and heme synthesis. A resulting increase in glucose concentration may also occur in the diabetic patient, with a subsequent decrease in 5‐ALA synthesis, leading to a reduction in heme. 16 Preclinical and safety tests suggest that 5‐ALA is safe at modest doses. 17 , 18
Purpose
The purpose of this investigation is to describe if a relationship exists between the administration of dietary supplements containing 5‐ALA and SFC, and changes in HbA1c and fasting and 2 hours post‐oral glucose tolerance test (OGTT) levels among subjects with prediabetes. We hypothesize 5‐ALA administration will lower blood glucose and HbA1c levels.
Methods
Study design
This was a prospective double blinded, randomized parallel‐group comparison study.
Study sample
A total of 154 participants deemed to have prediabetes (using 2009 criteria) were recruited from the general population in Hawaii and randomized equally to one of three study groups: (1) low dose (15 mg capsule); (2) high dose (50 mg capsule); and (3) control (placebo capsule of identical size and color).
Inclusion criteria
Males and females between 40 and 70 years of age with prediabetes, whose HbA1c level ranged from 5.8% to 7.0% at a screening visit were recruited. Measures of HbA1c generally are thought to be an index of blood sugar over the previous 3 months, whereas fasting glucose is a measure of insulin sensitivity at the time of the test. The word prediabetes is a controversial term. The terminology above was used at the time this investigation was initiated (2009) and later conducted. However, according to the 2012 American Diabetic Association (ADA) Clinical Practice Recommendations, hemoglobin A1C levels of 5.7–6.4% can be called prediabetes (or categories of increased risk for diabetes). Therefore, our participant population with hemoglobin A1C levels of 5.8–7.0% cannot be called prediabetes in its correct sense according to the new criteria. In August of 2010, the reporting format for hemoglobin A1C testing was changed to address the revised ADA Criteria [Standards of Medical Care in Diabetes—2010 Diabetes Care, 33(Supp 1): S1–S61].
Exclusion criteria
Those with a body mass index (BMI) value of more than 30 at the screening examination or a body weight less than 110 lbs or more than 250 lbs were excluded, as there may be differences in glucose metabolism in subjects with extremely low or high BMI. Those taking prescribed health food and/or medical drugs that might affect blood sugar level were also excluded. Those with a history of porphyria were not able to participate, as 5‐ALA may cause adverse effects on porphyria patients. Those with a history of hemochromatosis were excluded as SFC may cause adverse effects on patients that have defects in iron metabolism. Those with a history of hepatitis were excluded, as SFC may cause allergic reactions in this population. Those with active liver disease and iron sensitivity were also excluded. Finally, other common exclusion criteria such as pregnant (or breastfeeding) females, those with life threatening conditions and those participating in another clinical study were also excluded.
Measures
Potential participants completed a screening examination, and if all entry criteria were met, they were randomized to one of the three groups [5‐ALA low dose (15 mg daily), or 5‐ALA high dose (50 mg daily), or placebo]. Study subjects took active or placebo capsules for 12 weeks, with examinations at baseline, and weeks 4, 8, and 12. Participants came back for a follow‐up exam at week 16.
Baseline and week 12 visits included lifestyle and dietary questionnaires and all visits included clinical examinations, anthropometric measurements, and blood pressure. Comprehensive laboratory tests were conducted at baseline and at 12 weeks, with a subset of laboratory measurements at 4 and 8 weeks, and at 16 weeks.
Baseline and week 12 laboratory exams included a fasting glucose and 2 hours post‐OGTT (75 gm) and HbA1c, glycosilated albumin, lipids, blood cell counts, electrolytes, urine tests, adiponectin, insulin, and iron levels. Week 12 also included hepatic and renal tests.
At weeks 4 and 8, the measures included nonfasting HbA1c, ferritin, hepatic and renal function tests (also done at screening visit), and blood cell counts. The tests for week 16 consisted of measurement of nonfasting HbA1c. A daily diary was used to monitor symptoms of potential adverse events in addition to the laboratory measurements listed above.
Procedures
The project was approved by the University of Hawaii at Manoa Institutional Review Board. Participants were recruited through multiple mechanisms including newspaper ads, flyers, TV and radio advertising, and through seminars and presentations in the community. Participants signed an informed consent.
Questionnaires
Dietary reviews and energy expenditure questions were administered by a trained interviewer. A lifestyle questionnaire and leisure‐time physical activity were measured with the PASS Assessment tool adapted from the Honolulu Heart Study. 19 Stress was measured using a Perceived Stress Scale. 20
Other measurements
A calibrated digital precision scale was used to measure weight. The same scale was used for weighing patients at the site throughout the study. Height was measured in the standing position. Height was measured to the nearest millimeter without shoes using a stadiometer. BMI was determined as weight (kg) divided by height squared (m2). Waist circumference was measured using a tension‐controlled measuring tape while the subject was standing. Sitting blood pressure was measured with a calibrated digital sphygmomanometer after patients sat for at least 5 minutes. The same arm (usually left) was used to obtain all readings over the course of the study, and systolic and diastolic blood pressures were estimated, averaging two measurements.
Blood specimens
For baseline and 12 week visits, during which 2‐hour OGTT measurements (along with fasting lipid measurements) were done, venous blood was obtained in the morning after the subjects had fasted for ≥10 hour. Other visits did not require subjects to fast overnight. All analyses were conducted by Diagnostic Laboratories of Hawaii using standardized, reliable, and valid methods.
Statistical Methods
Variables monitored as part of the safety evaluation were assessed by comparing the low and high dose intervention groups separately to the control group, as well as by comparing the combined intervention groups to the control group. Two‐sample t‐tests were used to assess statistical significance. Baseline data were summarized as means and standard deviations with differences among the randomized groups tested for significance by analysis of variance. To measure the possible effects of 5‐ALA dietary supplementation, rates of change in serum markers were estimated using linear regression models. Mixed linear models were fit using the proc mixed procedure in SAS 9.1. 21
The regression models included two indicator variables identifying low‐ and high‐dose participants, a variable for weeks of follow‐up, and interaction terms between each of the indicator variables and follow‐up time. The mixed linear models accounted for the correlations among the repeated measures by employing a compound symmetry variance–covariance structure. The intercepts and slopes were modeled as random effects allowing the various participants to have distinct, estimated regression slopes. Results are summarized as the difference in slopes comparing the intervention groups to the control group. Results are also presented graphically to illustrate the estimated differences in slopes for the three study groups. Additional regression models were fit after combining the low‐ and high‐dose participants into a single group. These models had a single indicator variable for the combined treatment group, a variable for the weeks of follow‐up, and an interaction term between the treatment indicator and follow‐up time. All significant tests are two‐sided. Stratification of the 2‐hour post‐OGTT results <140 and >140 was planned.
Results
As shown in Table 2 , 59% of the participants randomized were female in the control group as were 60% in the low‐dose group, and 62% in the high‐dose group. None of the baseline variables differed significantly (p < 0.05) by intervention group, although because of the relatively small sample size some of the differences appear relatively large, for instance 2 hours post‐OGTT.
Table 2.
Baseline characteristics by intervention group.
| Variable | Control | Low dose | High dose | |||
|---|---|---|---|---|---|---|
| Mean | SD | Mean | SD | Mean | SD | |
| Age | 60.37 | 6.88 | 57.56 | 8.12 | 57.57 | 8.04 |
| Body mass index | 27.48 | 4.94 | 28.38 | 6.51 | 27.28 | 3.60 |
| Waist/hip ratio | 0.87 | 0.05 | 0.85 | 0.10 | 0.88 | 0.05 |
| Hemoglobin A1c | 6.03 | 0.29 | 6.04 | 0.38 | 6.08 | 0.24 |
| 2‐hour glucose | 108.08 | 29.52 | 125.04 | 51.52 | 121.42 | 43.67 |
| Fasting glucose | 99.65 | 10.61 | 102.60 | 11.39 | 98.15 | 9.08 |
| Glycosilated albumin | 0.76 | 0.15 | 0.76 | 0.14 | 0.77 | 0.20 |
| Systolic blood pressure | 125.17 | 14.53 | 120.48 | 14.89 | 123.65 | 9.40 |
| Diastolic blood pressure | 76.21 | 10.35 | 75.71 | 8.92 | 75.35 | 7.49 |
None of the baseline variables differed significantly (p < 0.05) by intervention group. Note that 59% were female in the control group, 60% in the low‐dose group, and 62% in the high‐dose group.
No untoward effects which could be attributed to the supplement are reported in the study. Comparisons of baseline versus week 8 nonfasting blood levels between those randomized to control and to active supplement indicated no significant differences in ferritin, SGOT (AST), SGPT (ALT), or creatinine. Statistically significant differences were seen in changes in hemoglobin levels between the low‐dose and control participants, although high‐dose participants showed borderline significance (see Table 3 ). However, the number of participants with low hemoglobin or low hematocrit values were similar at the beginning and at the end of the study (30 subjects at baseline and 29 subjects at week 12), suggesting that the difference was not clinically significant.
Table 3.
Difference in variables monitored for safety comparing changes in intervention groups to controls.
| Variable | Comparison to control | Difference from control | Lower CI | Upper CI | p‐value |
|---|---|---|---|---|---|
| Ferritin | Low dose | −3.81490 | −16.34835 | 8.71855 | 0.55 |
| High dose | 2.04698 | −12.58993 | 16.68390 | 0.78 | |
| Combined | −2.87468 | −13.32473 | 2.41211 | 0.17 | |
| SGOT (AST) | Low dose | −0.13765 | −1.83465 | 1.55936 | 0.87 |
| High dose | 0.54273 | −1.29963 | 2.38509 | 0.56 | |
| Combined | −2.87468 | −13.32473 | 2.41211 | 0.17 | |
| SGPT (ALT) | Low dose | 0.01020 | −2.23043 | 2.25082 | 0.99 |
| High dose | 0.52793 | −2.16559 | 3.22145 | 0.70 | |
| Combined | 0.30946 | −1.16909 | 1.59628 | 0.76 | |
| Creatinine | Low dose | −0.02761 | −0.06993 | 0.01472 | 0.20 |
| High dose | 0.00303 | −0.04404 | 0.05011 | 0.90 | |
| Combined | −0.01705 | −0.02944 | 0.01390 | 0.48 | |
| Hemoglobin | Low dose | −0.27376 | −0.49929 | −0.04824 | 0.02 |
| High dose | −0.20988 | −0.42637 | 0.00662 | 0.057 | |
| Combined | −0.23517 | 0.01420 | 0.24406 | 0.03 |
Comparisons of week 8 to baseline values (12 weeks).
As illustrated in Table 4 , among individuals taking 5‐ALA supplements for 12 weeks, 2 hours OGTT glucose levels declined significantly compared to those not taking the supplement (p= 0.02). The effects were stronger among those with baseline 2 hours OGTT glucose measurements ≥140 mg/dL (p= 0.005 and p= 0.02, for the low‐ and high‐dose group, respectively). Similar trends were observed for HbA1c, but results were of borderline significance (p= 0.07). This cutoff point was selected to stratify individuals based on normal and abnormal 2‐hour post‐OGTT values.
Table 4.
Estimated difference in slopes per week of serum markers compared to controls among all participants and among participants stratified by 2‐hour glucose levels.
| Serum marker | Strata | Dose | N | Postbaseline difference | Standard error | p‐value |
|---|---|---|---|---|---|---|
| 2‐hour glucose | ||||||
| All | Low | 50 | −1.449 | 0.535 | 0.008 | |
| High | 53 | −0.771 | 0.528 | 0.15 | ||
| Combined | 103 | −1.100 | 0.462 | 0.02 | ||
| <140 | Low | 37 | −0.563 | 0.521 | 0.28 | |
| High | 39 | −0.385 | 0.514 | 0.94 | ||
| ≥140 | Low | 13 | −4.423 | 1.457 | 0.005 | |
| High | 14 | −3.494 | 1.437 | 0.02 | ||
| Fasting glucose | ||||||
| All | Low | 50 | −0.3329 | 0.168 | 0.049 | |
| High | 53 | −0.1549 | 0.166 | 0.35 | ||
| Combined | 103 | −0.2413 | 0.190 | 0.10 | ||
| <140 | Low | 37 | −0.2791 | 0.187 | 0.14 | |
| High | 39 | −0.1521 | 0.387 | 0.42 | ||
| ≥140 | Low | 13 | −0.4589 | 0.382 | 0.24 | |
| High | 14 | −0.1347 | 0.381 | 0.73 | ||
| HbA1c | ||||||
| All | Low | 50 | −0.00460 | 0.00378 | 0.23 | |
| High | 53 | −0.00713 | 0.00373 | 0.058 | ||
| Combined | 103 | −0.00590 | 0.00325 | 0.07 | ||
| <140 | Low | 37 | −0.00491 | 0.00424 | 0.25 | |
| High | 39 | −0.00878 | 0.00419 | 0.04 | ||
| ≥140 | Low | 13 | −0.00272 | 0.00895 | 0.76 | |
| High | 14 | −0.00155 | 0.00882 | 0.86 | ||
| Glycosilated albumin | ||||||
| All | Low | 50 | −0.00134 | 0.00250 | 0.59 | |
| High | 53 | −0.00390 | 0.00251 | 0.12 | ||
| Combined | 103 | −0.00264 | 0.00215 | 0.22 | ||
| <140 | Low | 37 | −0.00167 | 0.00284 | 0.56 | |
| High | 39 | −0.00484 | 0.00287 | 0.10 | ||
| ≥140 | Low | 13 | −0.00035 | 0.00562 | 0.95 | |
| High | 14 | −0.00130 | 0.00554 | 0.82 | ||
N= 154 total sample size.
Figure 3 shows the slope for the three groups with respect to the key outcome variables of the study. The p values comparing the slopes to the control group are found in Table 4 . For 2‐hour glucose levels, there was a significant difference between the slope of the control group (increase in 2 hours OGTT vs. the low dose decrease in 2 hours post‐OGTT) over the 12 weeks (p= 0.008). Consistent results were observed for fasting glucose. There was a significant difference between the slopes of the control group (increase in fasting glucose) versus the low‐dose group (decrease in fasting glucose; p= 0.049).
Figure 3.
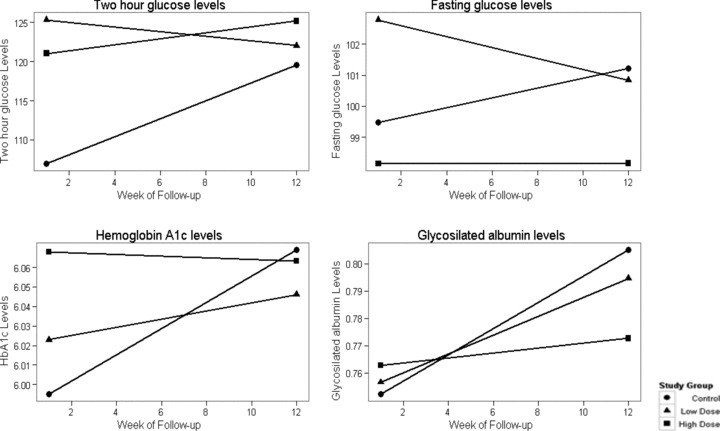
Two‐hour post‐OGTT, fasting glucose, hemoglobin A1C, and glycosilated albumin levels by study group at study baseline and week 12.
For HbA1c, the findings were similar. The difference between the slopes of the control group and the high‐dose group were of borderline significance (p= 0.058). For glycosilated albumin, the findings were in the same direction but not statistically significant.
Figure 4 shows the results for the 2‐hour glucose levels stratified on baseline 2 hours post‐OGTT levels. No significant differences were observed for participants with 2 hours post‐OGTT levels <140 mg/dL at baseline. However, statistically significant differences were observed for participants with baseline levels of 2 hours post‐OGTT of 140 mg/dL or greater, in both the low dose (p= 0.005) and the high dose dietary supplement (p= 0.02).
Figure 4.
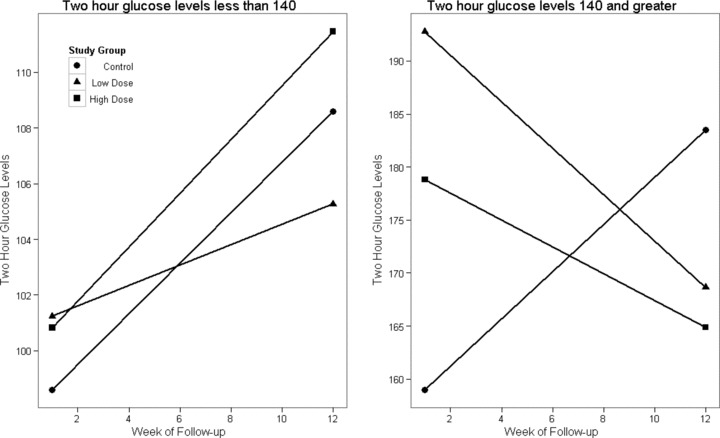
Two‐hour post‐OGTT levels by study group at baseline and at week 12 stratified by normal and abnormal 2‐hour post‐OGTT values.
Discussion
Previous reports from the Honolulu Heart Study, as well as other prospective studies for this factor, have shown the importance of glucose intolerance as a risk factor not only for diabetes, but for many other adverse outcomes including coronary heart disease, sudden death, stroke, and total mortality among others. 22 , 23 , 24 , 25 Therefore, interventions that target glucose intolerance and/or diabetes could have a very significant public health impact.
This study revealed significant differences in the 2 hours post‐OGTT glucose level in those taking 5‐ALA compared to the control group, as one might expect in those with increased insulin resistance. The effect was stronger among those with glucose intolerance or 2 hours post‐OGTT glucose at baseline ≥140 mg/dL, suggesting 5‐ALA may be beneficial among those with abnormal 2‐hour post‐OGTT values.
Among those in the 5‐ALA low‐dose group, the 2 hours post‐OGTT glucose decreased from 192 to 168 mg/dL during the 12‐week study. In the 5‐ALA high‐dose group, 2 hours post‐OGTT glucose decreased from 178 to 164mg/dL. In contrast, in the control group, 2 hours post‐OGTT glucose increased from 159 to 183 mg/dL during the 12‐week study. Individuals with prediabetes have a natural tendency to show an increase in glucose levels over time.
Two hours post‐OGTT glucose is considered to be a measure of insulin resistance in an individual. Borderline significant trends were also seen for HbA1c, which would theoretically be a measure of glucose level over the previous 3 months. However, this measure is thought to be a less reliable indicator in nondiabetics with lower glucose levels. In addition, fasting glucose also showed a significant difference among those in the 5‐ALA low‐dose group compared to the control group (p < 0.05). For glycosilated albumin, the differences were not statistically significant.
Despite the weakness of having a limited sample size in this investigation, all four measures of glucose metabolism were consistent in the direction of the differences observed. Not all differences reached statistical significance, but these findings suggest improved glucose metabolism among those taking the 5‐ALA supplement. It is uncertain why it may be that only a small dose of the supplement (15 mg) is needed to generate an optimal response.
A strength of the study was that there were few dropouts in this study (n= 3) and none could be attributed to the intake of the supplement. There was no evidence of significant adverse reactions to 5‐ALA. This is consistent with previous studies aimed at establishing the safety of this product as a dietary supplement. 8 , 9 , 10 , 11 , 13
In the only other publication related to D delta‐aminolevulinate dehydratase activity in humans “it was found that in diabetic patients the erythrocyte ALA‐D activity was lower than in controls, and the difference of the mean values was statistically highly significant (p less than 0.001).” The authors report a significant negative correlation (r=–0.846, p less than 0.001) between ALA‐D activity and blood glucose levels. “No significant difference in ALA‐D activity was found in the presence of insulin. On the other hand, there was considerable decrease in the enzyme activity in the blood samples after glucose addition.” 26
These results, although relatively short term, are consistent with improvement in insulin resistance related to supplemental 5‐ALA intake. Longer follow‐up, larger sample sizes, and increased specificity in the target population are needed to further establish the efficacy of this dietary supplement. In addition, studies targeting diagnosed diabetics might further our understanding of the efficacy of this compound in more severe disease.
This dietary supplement is unique because it has controlled amounts of 5‐ALA and SFC, the supplement is standardized, and it is produced in a way that leads to a very pure compound without contaminants. The supplement is also unique in that it appears to be related to mitochondrial activity and energy conversion.
Conclusions
Our study showed that 5‐ALA is safe to administer at doses up to 50 mgs a day. This investigation showed a reduction in 2 hours post‐OGTT glucose in comparison to the control group, especially among those with high 2 hours post‐OGTT glucose levels at baseline (≥140 mg/dL). The 5‐ALA high‐dose group showed a mean decrease of 14 mg/dL in 2 hours post‐OGTT glucose over the 12‐week study. Those in the 5‐ALA low‐dose group, showed a mean decline of 24 mg/dL over the 12 weeks. In contrast, the placebo group had an increase of 25 mg/dL in 2 hours post‐OGTT glucose over the 12‐week study (a net difference of 49 mg/dL in 2 hours post‐OGTT glucose between the 5‐ALA low‐dose and the control group). The study suggests that 5‐ALA supplementation may help to prevent or delay the progression to diabetes among those with prediabetes.
Recommendations
The findings of this investigation support the safety and use of 5‐ALA in 15 and 50 mg dosages in combination with SFC, as a dietary supplement among people with prediabetes. The study also showed potential benefits among participants with prediabetes in reducing 2 hours post‐OGTT glucose. Further investigation of 5‐ALA as a dietary supplement in relation to wellness, diabetes and its complications, and other chronic illnesses is heartily encouraged.
Acknowledgments
Strategic Business Innovator (SBI) ALA Promo Co., Ltd provided a contract to the John A. Burns School of Medicine at the University of Hawaii at Manoa to conduct this study. The study supplement was provided by the sponsor. Investigators had full control over the study and the present manuscript. The formulation used in this investigation is available in Japan as a food supplement.
[Correction added after online publication 01‐June‐2012: The academic degrees of authors Johnson and Harrigan have been updated]
References
- 1. Willows RD. Chlorophylls In: Goodman RM, ed. Encyclopaedia of Plant and Crop Science. London : Taylor & Francis Group, 2004: 258–262. [Google Scholar]
- 2. Hua MD, HC. Study on the Safety of Oral ALA Phosphate in Healthy Adults (3). Protocol No.: 21570. Date submitted: June 11, 2010. Submitted by: SBI ALApromo Co.Ltd. Study site: Meguro Medical Clinic, Medical4 Corporation Yukokai Research Organization: TTC Co. Ltd., Tokyo (Representing Director: Tetsuro Yamamoto, Ph.D.).
- 3. Beale SI. Biosynthesis of the tetrapyrrole pigment precursor, 5‐aminolevulinic acid, from glutamate. Plant Physiol. 1990; 93(4): 1273–1279. [DOI] [PMC free article] [PubMed] [Google Scholar]
- 4. Waget A., Cabou C, Masseboeuf M, Cattan P, Armanet M, Karaca M, Castel J, Garret C, Payros G, Maida A, et al Diabetes‐insulin‐glucagon‐gastrointestinal: physiological and pharmacological mechanisms through which the DPP‐4 inhibitor sitagliptin regulates glycemia in mice. Endocrinology. 2011; 152(8): 3018–3029. [DOI] [PubMed] [Google Scholar]
- 5. Fotinos N, Campo MA, Popowycz F, Gurny R, Lange N. Aminolevulinic acid derivatives in photomedicine: characteristics, application and perspectives. Photochem Photobiol. 2006. Jul–Aug; 82(4): 994–1015. [DOI] [PubMed] [Google Scholar]
- 6. Stummer W, Novotny A, Stepp H, Goetz C, Bise K, Jūrgen Reulen H. Fluorescence‐guided resection of glioblastoma multiforme utilizing 5‐ALA‐induced porphyrins: a prospective study in 52 consecutive patients. J Neurosurg. 2000. Dec; 93(6): 1003–1013. [DOI] [PubMed] [Google Scholar]
- 7. Ladner DP, Steiner RA, Allemann J, Haller U, Walt H. Photodynamic diagnosis of breast tumours after oral application of aminolevulinic acid. Br J Breast Cancer. 2001; 84(1): 33–37. [DOI] [PMC free article] [PubMed] [Google Scholar]
- 8. Sugawara K, Ishiuchi S, Kurihara H, Nakazato Y, Saito N. Intraoperative fluorescence detection of malignant gliomas using 5‐Aminolevulinic acid. Kitakanto Med J. 2003; 53(2): 109–113. [Google Scholar]
- 9. Webber J, Kessel, D , Fromm, D . Side effects of photosensitization of human tissue after aminolevulinic acid. J Surg Res. 1977; 68: 31–37. [DOI] [PubMed] [Google Scholar]
- 10. Rizvi I, Celli JP, Evans CL, Abu‐Yousif AO, Muzikansky A, Pogue B, Finkelstein D, Hasan T. Synergistic enhancement of carboplatin efficacy with photodynamic therapy in a three‐dimensional model for micrometastatic ovarian cancer. Cancer Res. 2010; 70: 9319–9328. doi:10.1158/0008‐5472.CAN‐10‐1783. [DOI] [PMC free article] [PubMed] [Google Scholar]
- 11. Tope WD, Ross V, Kollias N, Martin A, Gillies R, Anderson RR. Protoporphyrin IX induced in basel cell carcinoma by 5 aminolevulinic acid. Photochem Photobiol. 1998; 67(2): 249–255. [DOI] [PubMed] [Google Scholar]
- 12. Ganzer , Blana A, Denzinger S, Wieland WF, Adam C, Becker A, Khoder W, Walther S, Stief CG, Zaak D, et al Intraoperative photodynamic evaluation of surgical margins during endoscopic extraperitoneal radical prostatectomy with the use of 5‐aminolevulinic acid. J Endourol. 2009; 23(9) 1387–1394. [DOI] [PubMed] [Google Scholar]
- 13. Zaak , Sroka R, Khoder W, Adam C, Tritschler S, Karl A, Reich O, Knuechel R, Baumgartner R, Tilki D. Photodynamic diagnosis of prostate cancer using 5‐Aminolevulinic acid‐first clinical experiences. J Urology. 2008; 72(2): 345–348. doi:10.1016. [DOI] [PubMed] [Google Scholar]
- 15. Ogura S, Maruyama K, Hagiya Y, Sugiyama Y, Tsuchiya K, Takahashi K, Abe F, Tabata K, Okura I, Nakajima M, et al The effect of 5‐Aminolevulinic acid on cytochrome coxidase activity in mouse liver. BMC Res Notes. 2011; 4: 66. [DOI] [PMC free article] [PubMed] [Google Scholar]
- 16. Morton KA, Kushner P, Straka JG, Burnham BF. Biosynthesis of 5‐Aminolevulinic acid and heme from 4,5‐dioxovalerate in the rat. J Clin Invest. 1983. June; 71(6): 1744–1749. [DOI] [PMC free article] [PubMed] [Google Scholar]
- 17. Ritz R, Feigl GC, Schuhmann MU, Ehrhardt A, Danz S, Noell S, Bornemann A, Tatagiba MS. Use of 5‐ALA fluorescence guided endoscopic biopsy of a deep‐seated primary malignant brain tumor. J Neurosurg. 2011. May; 114(5): 1410–1413. [DOI] [PubMed] [Google Scholar]
- 18. Ji HT, Chien LT, Lin YH, Chien HF, Chen CT. 5‐ALA mediated photodynamic therapy induces autophagic cell death via AMP‐activated protein kinase. Mol Cancer. 2010; Apr 28; 9: 91. [DOI] [PMC free article] [PubMed] [Google Scholar]
- 19. Rodriguez BL, Curb JD, Burchfiel CM, Abbott RD, Petrovitch H, Masaki K, Chiu D. Physical activity and 23‐year incidence of coronary heart disease morbidity and mortality among middle aged men. The Honolulu Heart program. Circulation. 1994; 89(6): 2540–2544. [DOI] [PubMed] [Google Scholar]
- 20. Cohen S, Kamarck T, Mermelstein R. A global measure of perceived stress. J Health Social Behav. 1983; 24: 386–396. [PubMed] [Google Scholar]
- 21. SAS Institute Inc . SAS/STAT® 9.2 User’s Guide. Cary , NC : SAS Institute Inc.; 2008. [Google Scholar]
- 22. Rodriguez BL, Abbott RD, Fujimoto W, Waitzfelder B, Chen R, Masaki K, Schatz I, Petrovitch H, Ross GW, Yano K, et al The American Diabetes Association and World Health Organization Classifications for Diabetes: their impact on diabetes prevalence and total and cardiovascular disease mortality in elderly Japanese‐American men. Diabetes Care. 2002; 25: 951–955. [DOI] [PubMed] [Google Scholar]
- 23. Rodriguez BL, Burchfiel CM, Huang B, Sharp DS, Yano K, Lu J, Fujimoto W. Impaired glucose tolerance, diabetes and cardiovascular risk factor profiles in the elderly; the Honolulu Heart Program. Diabetes Care. 1996; 19: 587–590. [DOI] [PubMed] [Google Scholar]
- 24. Curb JD, Rodriguez BL, Burchfiel C, Yano K, Chiu D. Sudden death, glucose intolerance and diabetes in Japanese–American men. Circulation. 1995; 91: 2591–2595. [DOI] [PubMed] [Google Scholar]
- 25. Burchfiel C, Curb JD, Rodriguez BL, Abbott RD, Chiu D, Yano K. Glucose intolerance and 22‐year stroke incidence; the Honolulu Heart Program. Stroke. 1994; 25: 951–957. [DOI] [PubMed] [Google Scholar]
- 26. Djordjević V. Delta‐aminolevulinic acid dehydratase activity in erythrocytes of diabetic patients. Arch Int Physiol Biochim. 1985. Nov; 93(4): 285–290. [DOI] [PubMed] [Google Scholar]