

Abstract
Background: Chronic kidney disease (CKD) is the end point of a number of renal and systemic diseases. The metabolomics with a highly multiplexed and efficient manner is a challenging goal in nephrology.
Methods: A 1H‐NMR based metabolomics approach was applied to establish a human CKD serum metabolic profile. Serum samples were obtained from CKD patients with four stages (N= 80) and healthy controls (N= 28). The data acquired by CMPG spectrum were further processed by pattern recognition (PR) analysis. Principal components analysis (PCA) and partial least‐squares‐discriminant analysis (PLS‐DA) was capable of clustering the disease groups and establishing disease‐specific metabolites profile.
Results: The classification models could grade CKD patients with considerably high value of Q 2 and R 2. The significant endogenous metabolites that contributed to distinguish CKD in different stages included the products of glycolysis (glucose, lactate), amino acids (valine, alanine, glutamate, glycine), organic osmolytes (betaine, myo‐inositol, taurine, glycerophosphcholine), and so on. Based on these metabolites, the model for diagnosing patients with CKD achieved the sensitivity and specificity of 100%.
Conclusion: The study illustrated that serum metabolic profile was altered in response to renal dysfunction and the progression of CKD. The identified metabolic biomarkers may provide useful information for the diagnosis of CKD, especially in early stages. Clin Trans Sci 2012; Volume 5: 379–385
Keywords: chronic kidney disease, metabolomics, nuclear magnetic resonance spectroscopy
Introduction
Chronic kidney disease (CKD) is a recently recognized global public health problem that is “common, harmful, and treatable” with an estimated prevalence of nearly 10% worldwide. 1 A variety of etiologies such as genetic, autoimmune, infectious, environmental, dietary, medications contribute to the diverse primary outcomes, but all can eventually lead to the same end point—CKD. 2 The primary process can involve glomerular, tubular, interstitial, and/or vascular compartments. Early intervention may slow the progression of CKD to end‐stage renal disease if kidney disease was diagnosed and treated in its earlier stage. 1 , 3 , 4 , 5 The National Kidney Foundation Kidney Disease Outcomes Quality Initiative (KDOQI) guidelines, 6 as well as a recent declaration by the American Heart Association, 7 recommend calculating the estimated GFR (eGFR) in at‐risk populations. However, the eGFR cannot obtain an accurate assessment of kidney function in CKD patients. Thus, it is urgent to develop some effective and convenient techniques for earlier diagnosing, monitoring the progression, and guiding treatment of CKD, which has potentially enormous socioeconomic and medical benefits. 1 , 3 , 4 , 5
Metabolomics, a new but rapidly growing “omic” in system biology, has the ability to detect a large number of small‐molecule metabolites from body fluids or tissues in parallel. Over the past decades, nuclear magnetic resonance (NMR) spectroscopy provides a rapid, nondestructive, reproducible, and high‐throughput methodology for monitoring altered biochemistry. 8 Multivariate statistical analysis especially pattern recognition (PR) methods would be the first choice to handle the large sets of NMR and generate metabolic data. By clustering samples and interpreting of the related metabolic responses, NMR‐based metabolomics surely provides a powerful platform for clinical research and diagnostic applications, including early diagnosis, therapy monitoring, and understanding the pathogenesis. 9 , 10 , 11
In the area of kidney diseases, the previous studies suggested that metabolite profiling in both plasma and serum could successfully separated renal cell carcinoma (RCC) patients from healthy controls. 12 , 13 In other studies, metabolic profiling held potential promise to diagnose acute rejection and monitor immunosuppression treatments in kidney transplantation. 14 , 15 In addition, NMR‐based metabolomics urinalysis, the biomarkers of tubulointerstitial lesions in patients with glomerulonephritides were identified and the metabolite profiling contributed greatly to the early evaluation of the severity of the renal damage. 16 Tubular dysfunction associated with primary renal hypouricemia could also be distinguished from normal controls by NMR‐based urine metabolomic profiling. 17
In such situations, changes in metabolite profile of biofluids in renal diseases could be reflected in the 1H‐NMR spectral fingerprint. We applied 1H‐NMR‐based metabolomics spectrum to examine the serum metabolome of 80 patients with CKD comparing to 28 healthy controls. The aim of this pilot study was to search for a pattern of metabolites in the serum which could result in the diagnosis as well as assessment the progression of CKD.
Material and Methods
Patients and controls
The study included 80 clinically stable, admitted patients to the Department of Nephrology of Shenzhen People Hospital. All the patients were Asian and some of them were nonsmokers, the rest of them have stopped smoking for at least 1 month. The patients were diagnosed based on the modified KDOQI Clinical practice guidelines on CKD, and was classified into four stages based on eGFR (eGFR ≥ 90, 60∼89, 30∼59 or 30 mL/min/1.73 m2). 18 The etiologies of the 80 patients with CKD are as following: 28 patients are due to tubulo‐interstitial diseases, 35 patients are due to nephrotoxicity, and 27 are due to hypertensive nephrosclerosis. The abbreviated MDRD equation was used to eGFR as 186Cr−1.154 × age−0.203 × 0.742 (if female), where Cr is serum creatinine concentration. 19 Twenty‐eight healthy subjects matched for age, sex, and ethnicity served as controls. Exclusion criteria (for both groups) were pregnancy, infection, diabetes, tumor, estimated GFR < 15 mL/min/1.73 m2, and renal replacement therapy (including transplantation). In addition, patients with history of alcoholism, continued smoking and patients taking oral contraceptives were also excluded. The baseline clinical characteristics of the CKD patients and controls are summarized in Table 1 . The study was carried out according to the Principles in the Helsinki Declaration. 20 All study participants gave informed consent for the investigation, which was approved by the Ethical Committee of the Second Clinical Medical College, Jinan University.
Table 1.
Characteristics of health controls and CKD patients.
| Controls | CKD patients of four stages | ||||
|---|---|---|---|---|---|
| Class 1 | Class 2 | Class 3 | Class 4 | ||
| Total individuals (n) | 28 | 20 | 20 | 20 | 20 |
| Age (years)* | 38.29 ± 12.48 | 35.00 ± 10.72 | 37.80 ± 12.81 | 40.10 ± 11.35 | 46.30 ± 14.47 |
| Gender (F/M) | 12/16 | 9/11 | 11/9 | 9/11 | 11/9 |
| GFR (mL/min/1.73 m2) | 94.37 ± 9.42 | 98.58 ± 6.19 | 75.51 ± 7.82 | 49.74 ± 9.57 | 21.82 ± 5.88 |
*Data are presented as mean ± SD. There wasn’t significant difference of demographic data between controls and CKD patients.
All subjects were requested to fast overnight (at least 12 hours) and abstain from any medication (including over‐the‐counter drugs), 24 hours before sampling. Serum samples of all participants were obtained before immunosuppression come in.
Sample preparation
Serum was separated by centrifugation at 3000 rpm for 5 minutes, and stored at –80 °C until analysis. Before the NMR experiments, serum samples were defrosted at room temperature for less than 20 minutes and 200 μL aliquots combined with 400 μL of saline (0.9% NaCl in 10% D2O/90% H2O) were centrifuged at 12,000 × g for 5 minutes. A 550 μL aliquot of this solution was pipetted into a 5 mm NMR tube and samples were frozen at –40°C until NMR analysis.
NMR spectroscopy experiments
1H‐NMR spectra for all serum samples were collected on a Varian Unity INOVA 600 NMR spectrometer, at a frequency of 599.93 MHz and temperature of 300 K. Samples were automatically inserted into a cryogenic probe and gradient shimming was performed prior to the acquisition of each spectrum.
For each sample, one‐dimensional‐Carr‐Purcell‐Meiboom‐Gill (1D‐CPMG) was performed to filter out signals belonging to proteins and other macromolecules, thus obtaining spectra primarily composed of signals from metabolites and small molecules. 21 Typically, 128 scans were collected into 64K data points over a spectral width of 8000.0 Hz with a relaxation delay of 2.1 seconds and acquisition time of 1.0 seconds. All samples were randomly processed and the operator was masked to the clinical diagnosis.
PR analysis
All spectra were Fourier transformed and phased with TOPSPIN 2.0 and MestReNOva 6.0.2 software (Umetrics, Umeå, Sweden). The baseline corrected and referenced to the methyl peak signal of lactate at chemical shift (δ1.33). A line broadening of 0.3 Hz was applied to the free induction decay prior to Fourier transform. NMR spectra were divided into 0.01 ppm wide regions. After removal of regions containing the residual water signal 4.31–5.50 ppm, the remained 880 bins were integrated and normalized for the further analysis.
All PR analyses were applied with centered‐scaling to the variables derived from the binned data using SIMCA 10.0. Principal component analysis (PCA) as an unsupervised PR method was initially applied to identify the intrinsic variation. 22 , 23 In the PCA scores plot where each print represented an individual spectrum of a serum sample, the analysts could visualize the distribution and grouping of the samples based on the first two PCs which contain the largest part of the variance of the data set. The corresponding loading plot revealed the biochemical components responsible for the classification.
Partial least squares discriminant analysis (PLS‐DA) as a supervised analysis technique was applied to build a metabolic profile model which can identify those metabolites which vary between diagnostic groups. 23 The quality of the models was described by R 2 and Q 2 values. R 2 is defined as the proportion of variance in the data explained by the models and indicates goodness of fit. Q 2 is defined as the proportion of variance in the data predictable by the model and indicates predictability. The PLS‐DA model was cross‐validated using venetian blinds, a method which reassigns randomly selected spectral data to the PLS‐DA model to determine the sensitivity and specificity of the model in correctly assigning diagnostic groups. 24 So we randomly divided our data in to a training set of 64 patients and 22 controls and a test set that consisted of the remaining samples. The model was built based on the training set. Then we verified its discriminating ability of the model with the test set. Results are expressed as sensitivity (the proportion of positive (diseased) subjects who test positive with the biomarker profile) and specificity (the proportion of negative (control) subjects who test negative with the biomarker profile).
To further test the power of the PLS‐DA model (control versus class 1 CKD), we selected eight new samples, including four CKD patients in class 1 and four healthy controls, to validate whether the metabolic profiling can distinguish two groups effectively.
Results
1H‐NMR spectra
1H Carr‐Purcell‐Meiboom‐Gill (CPMG) superimposed spectra of serum samples from CKD patients (class 1–4) and from healthy controls (normal) are shown in Figure 1 . The main different peaks among five groups were concentrated in the area of 0.5–4.5 ppm. Over 10 main metabolites were identified by 1H‐NMR and presented in Figure 1 . The serum metabolites were assigned according to extant literature based on their chemical shifts and signal multiplicity. 21
Figure 1.
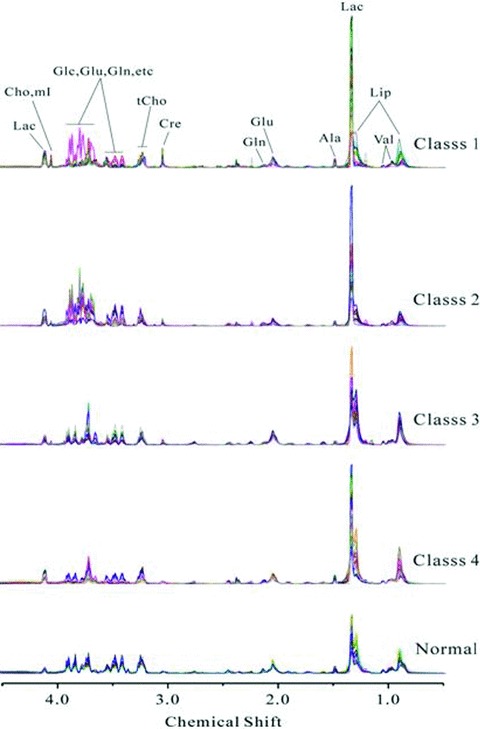
Representative of 600 MHz 1H‐NMR CPMG spectrum (d 4.5–0.5) of serum obtained from CKD patients with GFR ≥90 mL/min/1.73 m2(class 1), 60–89 mL/min/1.73 m2 (class 2), 30–59 mL/min/1.73 m2 (class 3), 30 mL/min/1.73 m2 (class 4) and healthy controls (normal). Ala = alanine; Cre = creatine; Glu = glutamate; Gln = glutamine; Lac = lactate; Cho = choline; tCho = total choline; Val = valine; mI = myo‐inositol; Glc =α‐glucose, β‐glucose; Lip = lipid.
PR analysis
PCA was applied to obtain an overview of the variations about all the CKD patients with four stages and healthy controls. In the score plot, the first two PCs contained 50.9% and 29.4% of the whole variation, respectively. While complete discrimination was not achieved, a clear indication of some degree of separation between the control group and disease group was observed ( Figure 2A ). The corresponding loading plot ( Figure 2B ) suggested that the main metabolite alterations in the serum samples of CKD patients was elevated levels of lactate coupled with lowered levels of lipid, glucose and choline, phosphorylcholine, glycerphosphorylcholine and betaine, taurine, scyllo‐inositol.
Figure 2.
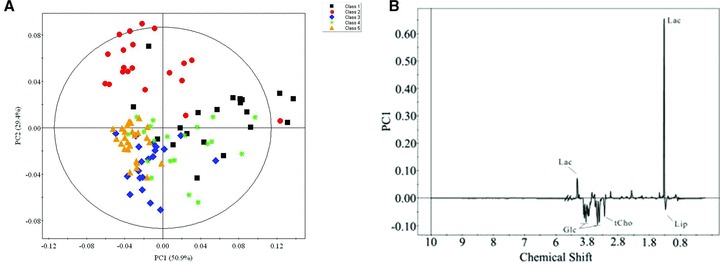
The principal component analysis scores plot using the first two principle components showing all the data points from the study. Black squares (▪), red dots (•), blue diamond (♦), and green spots (*) represent disease group 1, 2, 3, and 4 respectively. And yellow triangle (▴) represents the healthy control. And (B) is the corresponding loading plots of (A). Keys of the assignments were shown in Figure 1 .
In order to further separating the disease groups, the PLS‐DA scores plots were presented ( Figure 3 ). Although there was little overlap, biochemical distinction between all of CKD patients and controls was evident in the PLS‐DA model ( Figure 3A ). CKD patients in class 1–4 were also clearly separated from healthy control in scores plots. ( Figure 3B–E ). Moreover, the distinction between class 1 and class 2 could also be visualized ( Figure 3F ). The R 2 and Q 2 value of all the PLS‐DA models were summarized in Table 2 . And the PLS‐DA prediction model was able to correctly classify the serum samples into CKD and control groups, and it accurately predicted all CKD patients and healthy subjects showing 100% sensitivity and specificity ( Figure 4 ). The coefficients derived from the significance metabolites contributing to the separation for each models are summarized in Table 3 .
Figure 3.
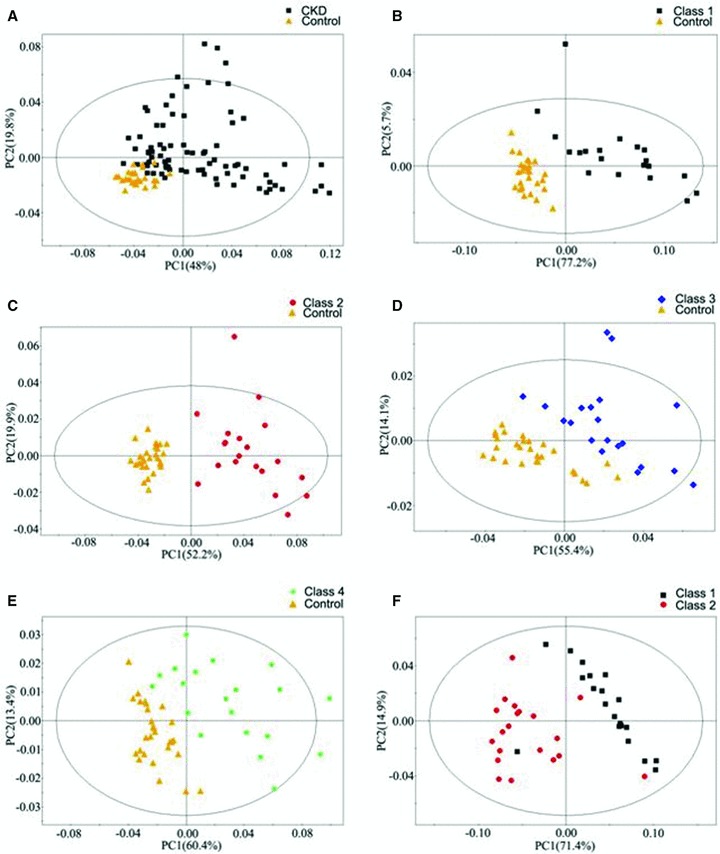
PLS‐DA scores plots derived from 1H‐NMR spectra of serum obtained from different groups. (A) CKD (▪) as compared with the control (▴); (B) Class 1 (▪) as compared with the control (▴); (C) Class 2 (•) as compared with the control (▴); (D) Class 3 (♦) as compared with the control (▴); (E) Class 4 (*) as compared with the control (▴); (F) Class 1 (▪) as compared with Class 2 (•).
Table 2.
The values of R 2 and Q 2 in all PLS‐DA models.
| R 2 | Q 2 | |
|---|---|---|
| All CKD patients versus control | 0.914 | 0.820 |
| Class 1 versus control | 0.980 | 0.932 |
| Class 2 versus control | 0.989 | 0.924 |
| Class 3 versus control | 0.976 | 0.846 |
| Class 4 versus control | 0.971 | 0.817 |
| Class 1 versus class 2 | 0.962 | 0.867 |
Figure 4.
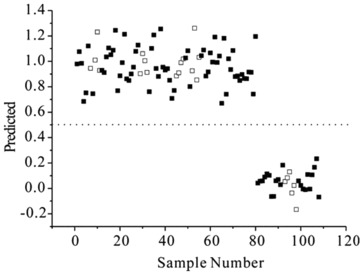
Prediction plot illustrated the accuracy of the PLS‐DA model.
Table 3.
Coefficient of metabolites contributing to separation between serum samples obtained from patients with CKD.
| Metabolite | Chemical shift | r* | |||
|---|---|---|---|---|---|
| Class 1 versus Control | Class 2 versus Control | Class 3 versus Control | Class 4 versus Control | ||
| Myo‐inositol | 4.06 | 0.04 | 0.06 | −0.01 | – |
| Creatine | 3.92 | −0.07 | – | −0.10 | −0.10 |
| Betaine | 3.90 | −0.09 | – | −0.13 | −0.13 |
| Glucose | 3.87 | −0.01 | +0.51 | −0.03 | −0.02 |
| Glucose | 3.78 | −0.03 | +0.42 | −0.07 | −0.07 |
| Glucose | 3.74 | −0.08 | −0.01 | −0.07 | −0.10 |
| Glucose | 3.72 | −0.02 | +0.05 | +0.01 | −0.01 |
| Glycine | 3.55 | −0.03 | 0.01 | −0.05 | −0.07 |
| Glucose | 3.48 | −0.12 | −0.03 | −0.16 | −0.16 |
| Taurine | 3.41 | −0.11 | −0.04 | −0.16 | −0.15 |
| Scyllo‐inositol | 3.36 | −0.03 | −0.07 | −0.07 | −0.03 |
| GPC+PC | 3.23 | −0.03 | −0.11 | −0.10 | −0.06 |
| GPC+PC | 3.22 | −0.02 | −0.12 | −0.10 | −0.05 |
| Choline | 3.21 | +0.01 | −0.07 | −0.05 | −0.01 |
| Glutamate | 2.05 | – | −0.10 | +0.07 | −0.01 |
| Alanine | 1.48 | +0.02 | −0.04 | −0.05 | – |
| Lactate | 1.33 | +0.96 | +0.65 | +0.61 | +0.94 |
| Lipid | 1.29 | −0.12 | −0.28 | +0.65 | +0.10 |
| Lipid | 0.90 | −0.06 | −0.17 | +0.34 | +0.10 |
*The + and – indicate the direction of the change (i.e., + increase and – decrease) in the concentration in serum obtained from patients with CKD as compared to those obtained from healthy volunteers.
The serum metabolic profiles of four CKD patients in class 1 and four healthy controls were overlaid in the PLS‐DA model to evaluate the diagnostic performance ( Figure 5 ). Of these, four CKD patients of class 1 patients were clustered together in the left section of the PLS‐DA model (class 1 group), four controls were clustered together in the right section of the PLS‐DA model (control group). The validation of eight new samples showed the model was reliable.
Figure 5.
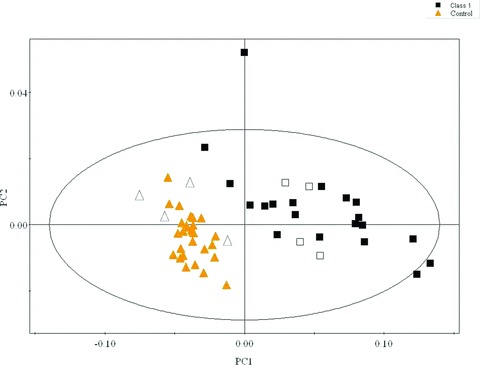
The validation tests of PLS‐DA (control versus class 1 CKD) using eight new samples, including four CKD patients in class 1 (empty squares) and four healthy controls (empty triangles).
Discussion
The study initially indicated that renal dysfunction in patients with CKD correlated with an altered serum metabolite profile. Given the complexity of pathophysiology of CKD, it is conceivable that a combination rather than a single biomarker may detect some early changes and be suggestive of the risk disease evolution. The serum metabolomic profiling based on 1H‐NMR spectroscopy hold the capability of differentiating patients with CKD in four stages from healthy controls. And some metabolites in serum have been found altered. These metabolites are intermediates or end products of cellular processes and, therefore, reflect the global integrated response of both organs and entire biological system to long‐term pathophysiologic stimuli of CKD. In this study, major altered endogenous metabolites in serum contained products of glycolysis (glucose, lactate) and amino acids (valine, alanine, glutamate, and glycine), as well as organic osmolytes (e.g., betaine, myo‐inositol, taurine, and glycerophosphcholine).
Lactate is one of the most important characteristic metabolites of CKD patients in different classes. Combined with the lower level of glucose in serum hinted the increased activity of anaerobic metabolism in CKD patients. 25 , 26
Taurine, β‐amino acid, is not incorporated into protein, and can serve as an intracellular osmolyte. The function of taurine related the pathophysiology of the kidney included the protection against chronic renal failure, acute kidney injury, and glomerulonephritis. 27 This study showed taurine was decreased in CKD patients, especially in patients in class 3 and 4. It was consistent with the previous study which indicated that human patients with chronic renal failure had reduced plasma and muscle intracellular concentrations of taurine 28 , 29 and it might result from decreased endogenous synthesis. 29
Myo‐inositol is a second messenger in various cell types, including inflammatory cells. 30 It increased in patients with class 1 and class 2 CKD suggesting an activating inflammatory state. 31 Besides myo‐inositol, a renal medullary osmolyte, is also a hint medullary injury.
Choline, a quaternary amino cationic alcohol, could be oxidized to betaine in kidney mitochondria. Betaine might play a role in treatment to reduce the risk of atherosclerosis in chronic renal failure by decreased the postmethionine load hyperhomocysteinemia. 32
The decreased levels of choline‐containing metabolites including choline, glycerophosphorylcholine (GPC), and phosphorylcholine (PC) are associated with the structural components of cell membranes. Moreover the lipid of was elevated in patients with class 3 and 4 CKD. The disturbance of phospholipid metabolism might be aroused by an increased rate of metabolism of phospholipids to lipid or a greater demand for phospholipids in rapidly replicating renal cells.
Furthermore, PC, GPC, choline, glycine, and other choline derivatives such as betaine and myo‐inositol are all either intermediates or derivatives of methylamine metabolism. These chemicals have been identified as major osmolytes in the renal medulla. 33 The abnormal alteration of organic osmolyte had also been found in patients with renal cell carcinoma (RCC). 34 , 35 The reasons for the alteration of these metabolites in serum are not quite clear to us at this moment yet, but one possibility might be related to a derangement of kidney cell osmolar function in CKD patients.
In this study, the serum metabolic profiles of the patients with CKD at any disease stage presented distinct alterations from those recorded from healthy individuals. However, GFR did not exhibit evident difference between normal and class 1 CKD. GFR determined by only one substance (creatinine) while the established PLS‐DA model was based on multimetabolites. It is conceivable that the metabolic changes revealed by NMR spectra could be more sensitive than GFR. In addition, the comparison between disease groups showed a statistically significant separation between patients in class 1 and patients in class 2 and a high predictive ability of the corresponding PLS‐DA models. In the predictive tests of the discriminatory power using eight new samples, the results showed that the accuracy of the PLS‐DA model (class1 CKD versus healthy controls) was 100%.
To our knowledge, this pilot study is the first reporting in CKD using of 1H‐NMR metabolomics combined with PR analysis to investigate serum metabolic pathways involved in the pathophysiology of CKD. The results demonstrated the feasibility of applying serum metabolomics profile to the early diagnosis of CKD and monitoring renal function. Further studies with larger numbers of patients and controls will be done to validate the models and to assure its place in routine practice.
Conclusion
This study illustrates the potential value of metabonomics based on 1H‐NMR spectroscopy of serum for an understanding of the whole body effects of the renal dysfunction in patients with CKD at the small molecular metabolic levels. A number of serum metabolites were changed in CKD different stages. 1H‐NMR metabolomics combined with PR analysis of serum, as a rapid and minimally invasive technique, could contribute to the early evaluation of the severity of the renal damage and possibly to the monitoring of the kidney function, and provide insight into the physiopathologic of CKD.
Conflict of Interest
All the authors declared no conflicts of interest.
Acknowledgments
The authors thank all the patients and healthy volunteers who participated in this study. This research is funded by the Shenzhen Science & Technology, Industry, Trade and Information Committee (SZSITIC), in the framework of the program “Public Experimental Platform for Shenzhen Islet stem cell transplantation” SZSITIC [2006] No.446.
References
- 1. Levey AS, Atkins R, Coresh J, Cohen EP, Collins AJ, Eckardt KU, Nahas ME, Jaber BL, Jadoul M, Levin A, et al. Chronic kidney disease as a global public health problem: approaches and initiatives – a position statement from Kidney Disease Improving Global Outcomes. Kidney Int. 2007; 72: 247–259. [DOI] [PubMed] [Google Scholar]
- 2. Connolly JO, Woolfson RG. A critique of clinical guidelines for detection of individuals with chronic kidney disease. Nephron Clin Pract. 2009; 111: 69–73. [DOI] [PubMed] [Google Scholar]
- 3. Chaudhary K, Phadke G, Nistala R, Weidmeyer CE, McFarlane SI, Whaley‐Connell A. The emerging role of biomarkers in diabetic and hypertensive chronic kidney disease. Curr Diab Rep. 2010; 10: 37–42. [DOI] [PubMed] [Google Scholar]
- 4. Giannelli SV, Patel KV, Windham BG, Pizzarelli F, Ferrucci L, Guralnik JM. Magnitude of underascertainment of impaired kidney function in older adults with normal serum creatinine. J Am Geriatr Soc. 2007; 55: 816–823. [DOI] [PMC free article] [PubMed] [Google Scholar]
- 5. Nickolas TL, Barasch J, Devarajan P. Biomarkers in acute and chronic kidney disease. Curr Opin Nephrol Hypertens. 2008; 17: 127–132. [DOI] [PubMed] [Google Scholar]
- 6. K/DOQI Clinical Practice Guidelines for Chronic Kidney Disease: evaluation, classification, and stratification. Am J Kidney Dis. 2002; 39:S1–S246. [PubMed] [Google Scholar]
- 7. Brosius FC, Hostetter TH, Kelepouris E, Mitsnefes MM, Moe SM, Moore MA, Pennathur S, Smith GL, Wilson PW. Detection of chronic kidney disease in patients with or at increased risk of cardiovascular disease: a science advisory from the American Heart Association Kidney and Cardiovascular Disease Council; the Councils on High Blood Pressure Research, Cardiovascular Disease in the Young, and Epidemiology and Prevention; and the Quality of Care and Outcomes Research Interdisciplinary Working Group: developed in collaboration with the National Kidney Foundation. Circulation. 2006; 114: 1083–1087. [DOI] [PubMed] [Google Scholar]
- 8. Coen M, Holmes E, Lindon JC, Nicholson JK. NMR‐based metabolic profiling and metabonomic approaches to problems in molecular toxicology. Chem Res Toxicol. 2008; 21: 9–27. [DOI] [PubMed] [Google Scholar]
- 9. Tiziani S, Lopes V, Günther UL. Early stage diagnosis of oral cancer using 1H NMR‐based metabolomics. Neoplasia. 2009; 11: 269–276. [DOI] [PMC free article] [PubMed] [Google Scholar]
- 10. Maher AD, Crockford D, Toft H, Malmodin D, Faber JH, McCarthy MI, Barrett A, Allen M, Walker M, Holmes E, Lindon JC, Nicholson JK. Optimization of human plasma 1H NMR spectroscopic data processing for high‐throughput metabolic phenotyping studies and detection of insulin resistance related to type 2 diabetes. Anal Chem. 2008; 80: 7354–7362. [DOI] [PubMed] [Google Scholar]
- 11. Sinclair AJ, Viant MR, Ball AK, Burdon MA, Walker EA, Stewart PM, Rauz S, Young SP. NMR‐based metabolomic analysis of cerebrospinal fluid and serum in neurological diseases–a diagnostic tool? NMR Biomed. 2010; 23: 123–132. [DOI] [PubMed] [Google Scholar]
- 12. Zira AN, Theocharis SE, Mitropoulos D, Migdalis V, Mikros E. (1)H NMR metabonomic analysis in renal cell carcinoma: a possible diagnostic tool. J Proteome Res. 2010; 9: 4038–4044. [DOI] [PubMed] [Google Scholar]
- 13. Gao H, Dong B, Liu X, Xuan H, Huang Y, Lin D. Metabonomic profiling of renal cell carcinoma: high‐resolution proton nuclear magnetic resonance spectroscopy of human serum with multivariate data analysis. Anal Chim Acta. 2008; 624: 269–277. [DOI] [PubMed] [Google Scholar]
- 14. Wang JN, Zhou Y, Zhu TY, Wang X, Guo YL. Prediction of acute cellular renal allograft rejection by urinary metabolomics using MALDI‐FTMS. J Proteome Res. 2008; 7: 3597–3601. [DOI] [PubMed] [Google Scholar]
- 15. Kim CD, Kim EY, Yoo H, Lee JW, Ryu do H, Noh DW, Park SH, Kim YL, Hwang GS, Kwon TH. Metabonomic analysis of serum metabolites in kidney transplant recipients with cyclosporine A‐or tacrolimus‐based immunosuppression. Transplantation. 2010; 90: 748–756. [DOI] [PubMed] [Google Scholar]
- 16. Psihogios NG, Kalaitzidis RG, Dimou S, Seferiadis KI, Siamopoulos KC, Bairaktari ET. Evaluation of tubulointerstitial lesions’ severity in patients with glomerulonephritides: an NMR‐based metabonomic study. J Proteome Res. 2007; 6: 3760–3770. [DOI] [PubMed] [Google Scholar]
- 17. Tzovaras VT, Psychogios NG, Kostara CE, Bairaktari ET, Elisaf MS. Evaluation of the proximal tubular function in individuals with primary renal hypouricemia: an NMR‐based metabonomic study. NMR Biomed. 2009; 22: 1072–1083. [DOI] [PubMed] [Google Scholar]
- 18. Kidney Disease Outcome Quality Initiative, Clinical practice guidelines for chronic kidney disease: evaluation, classification, and stratification. Am J Kidney Dis. 2002; 39: S1–S246. [PubMed] [Google Scholar]
- 19. Levey AS, Bosch JP, Lewis JB, Greene T, Rogers N, Roth D. A more accurate method to estimate glomerular filtration rate from serum creatinine: a new prediction equation. Modification of Diet in Renal Disease Study Group. Ann Intern Med. 1999; 130: 461–470. [DOI] [PubMed] [Google Scholar]
- 20. World Medical Association. Declaration of Helsinki: ethical principles for medical research involving human subjects. J Postgrad Med. 2002; 48: 206–208. [PubMed] [Google Scholar]
- 21. Nicholson JK, Foxall PJ, Spraul M, Farrant RD, Lindon JC. 750 MHz 1H and 1H‐13C NMR spectroscopy of human blood plasma. Anal Chem. 1995; 67: 793–811. [DOI] [PubMed] [Google Scholar]
- 22. De Meyer T, Sinnaeve D, Van Gasse B, Rietzschel ER, De Buyzere ML, Langlois MR, Bekaert S, Martins JC, Van Criekinge W. Evaluation of standard and advanced preprocessing methods for the univariate analysis of blood serum 1H‐NMR spectra. Anal Bioanal Chem. 2010; 398: 1781–1790. [DOI] [PubMed] [Google Scholar]
- 23. Trygg J, Holmes E, Lundstedt T. Chemometrics in metabonomics. J Proteome Res. 2007; 6: 469–479. [DOI] [PubMed] [Google Scholar]
- 24. Bijlsma S, Bobeldijk I, Verheij ER, Ramaker R, Kochhar S, Macdonald IA, van Ommen B, Smilde AK. Large‐scale human metabolomics studies: a strategy for data (pre‐) processing and validation. Anal Chem. 2006; 78: 567–574. [DOI] [PubMed] [Google Scholar]
- 25. Foxall PJ, Mellotte GJ, Bending MR, Lindon JC, Nicholson JK. NMR spectroscopy as a novel approach to the monitoring of renal transplant function. Kidney Int. 1993; 43: 234–245. [DOI] [PubMed] [Google Scholar]
- 26. Le Moyec L, Pruna A, Eugène M, Bedrossian J, Idatte JM, Huneau JF, Tomé D. Proton nuclear magnetic resonance spectroscopy of urine and plasma in renal transplantation follow‐up. Nephron 1993; 65: 433–439. [DOI] [PubMed] [Google Scholar]
- 27. Chesney RW, Han X, Patters AB. Taurine and the renal system. J Biomed Sci. 2010; 17: S1–S4. [DOI] [PMC free article] [PubMed] [Google Scholar]
- 28. Bergstrom J, Alvestrand A, Furst P, Lindholm B. Sulphur amino acids in plasma and muscle in patients with chronic renal failure: evidence for taurine depletion. J Intern Med. 1989; 226: 189–194. [DOI] [PubMed] [Google Scholar]
- 29. Qureshi GA, Baig SM. Application of high performance liquid chromatography in study of sulphur amino acid metabolism in uremic patients. Biochem Mol Biol Int. 1993; 29: 359–368. [PubMed] [Google Scholar]
- 30. Blanchet MR, Langlois A, Israel‐Assayag E, Beaulieu MJ, Ferland C, Laviolette M, Cormier Y. Modulation of eosinophil activation in vitro by a nicotinic receptor agonist. J Leukoc Biol. 2007; 81: 1245–1251. [DOI] [PubMed] [Google Scholar]
- 31. Freund‐Michel V, Frossard N. The nerve growth factor and its receptors in airway inflammatory diseases. Pharmacol Ther. 2008; 117: 52–76. [DOI] [PubMed] [Google Scholar]
- 32. McGregor DO, Dellow WJ, Robson RA, Lever M, George PM, Chambers ST. Betaine supplementation decreases post‐methionine hyperhomocysteinemia in chronic renal failure. Kidney Int. 2002; 61: 1040–1046. [DOI] [PubMed] [Google Scholar]
- 33. Sizeland PCB, Chambers ST, Lever M, Bason LM, Robson RA. Organic osmolytes in human and other mammalian kidneys. Kidney Int. 1993; 43: 448–453. [DOI] [PubMed] [Google Scholar]
- 34. Perroud B, Lee J, Valkova N, Dhirapong A, Lin PY, Fiehn O, Kültz D, Weiss RH. Pathway analysis of kidney cancer using proteomics and metabolic profiling. Mol Cancer. 2006; 5: 64–70. [DOI] [PMC free article] [PubMed] [Google Scholar]
- 35. Lin L, Huang Z, Gao Y, Yan X, Xing J, Hang W. LC‐MS based serum metabonomic analysis for renal cell carcinoma diagnosis, staging, and biomarker discovery. J Proteome Res. 2011; 10: 1396–1405. [DOI] [PubMed] [Google Scholar]