Abstract
Triarylmethyl (TAM) radicals are widely used in Electron Paramagnetic Resonance (EPR) spectroscopy as spin labels and in EPR imaging as spin probes for in vivo oxymetry. One of the key advantages of TAMs is extremely narrow EPR line, especially in case of deuterated analogues (~5 μT). Another advantage is their slow spin relaxation even at physiological temperatures allowing, in particular, application of pulsed dipolar EPR methods for distance measurements in biomolecules. In this paper a large series of TAM radicals and their deuterated analogues is synthesized, and corresponding spectroscopic parameters including 13C hyperfine constants are obtained for the first time. The negligible dependence of 13C hyperfine constants on solvent, as well as on structure and number of substituents at para-C atoms of aromatic rings, has been found. In addition, we have demonstrated that 13C signals at natural abundance can be employed for successful room-temperature distance measurements using Pulsed Electron Double Resonance (PELDOR or DEER).
Introduction
Sterically substituted triarylmethyl (TAM) radicals, developed for the first time by Nycomed Innovation AB [1–4] with the aim to be used as polarizing agents for Overhauser MRI, attract a great interest of chemists, biologists and EPR spectroscopists during the last years. In particular, TAMs are widely used as in vivo spin probes for EPR oxymetry [5–9]. Compared to nitroxides, TAMs have several important advantages, namely: (i) extremely narrow EPR line, especially for deuterated analogues (5 μT); (ii) very long electron spin relaxation times even at room temperatures: T1 up to 20 μs and Tm up to 3 μs [10, 11]; (iii) very high stability against reduction in biological systems (tissues and blood). These properties make TAMs very perspective materials with numerous applications in biology [12–18], medicine [19–21], analytical chemistry [8, 22, 23], materials science[24], DNP applications [25, 26].
Recently TAM-based spin labels have emerged as a valuable alternative to nitroxides for nanometer distance measurements using EPR [27–30]. Pulsed dipolar EPR spectroscopy combined with Site-Directed Spin Labeling (SDSL), which allows introduction of spin labels in target sites of biomolecules, provide a unique tool for obtaining distances and distance distributions on nanometer scale in biological systems. The distances between spin labels can be obtained using different approaches, including Pulsed Electron Double Resonance (PELDOR, also known as DEER) [31, 32], Double Quantum Coherence (DQC) EPR [33, 34], single-frequency technique for refocusing dipolar couplings (SIFTER) [35], Relaxation Enhancement (RE) [36,37]. Owing to the narrow linewidth, TAM is not suitable as a spin label for X-band DEER; however, if DQC or SIFTER is used, the narrow line of TAM becomes a huge advantage and leads to a higher sensitivity compared to nitroxides [27,28,38,39]. At high magnetic fields (e.g. G-band) the EPR linewidth of TAM increases due to the g-anisotropy and reaches ca. 130 MHz, thus allowing application of PELDOR/DEER as well [38].
In most cases EPR distance measurements are performed at cryogenic temperatures. However, recently a new trend of measurements at ambient temperatures has emerged, having high potential for studies of conformational sub-states unresolvable by traditional measurements in frozen solutions. In case of nitroxides, the electron spin dephasing (Tm) times at room temperature do not exceed 900 ns [40, 41], whereas TAMs provide as long Tm values as 2–3 μs [39]. In particular, this advantage of TAMs allowed DQC distance measurements in a range 40–50 Ǻ at room temperatures [28, 30, 39].
Recent studies of room-temperature relaxation in TAMs revealed that Tm values are systematically longer at X-band compared to Q-band due to the g-anisotropy; therefore room-temperature pulsed EPR distance measurements using TAMs are more practical at X-band [11]. As was already mentioned above, the linewidth of TAM at X-band is too narrow for application of PELDOR, because it is impossible to accommodate both observer and pump frequencies within this line and provide small enough overlap of the corresponding excitation profiles. However, this can be remedied if 13C satellite line is used for observation and main (12C) line for pumping [28,42]. Note that in comparison with single frequency methods (DQC, SIFTER), two-frequency PELDOR has certain advantages, including more reliable baseline correction because the background function is theoretically described. Therefore, wherever applicable, room-temperature PELDOR/DEER measurements at 13C signals of TAMs can be used to validate the corresponding data obtained by DQC or SIFTER.
In view of the above, the reliable information concerning the origin of additional EPR lines observed in TAM-labeled biomolecules is demanded. On the one hand, these additional lines can arise from weak exchange interactions between spin labels; on the other, they can originate from 13C satellites. The values of 13C hyperfine interaction (HFI) constants are known for simple TAMs already since 60s of the past century [43,44]. However, in case of a family of Finland TAMs synthesized relatively recently, measurements of 13C HFI constants were only performed for the core Finland trityl (FH) [45].
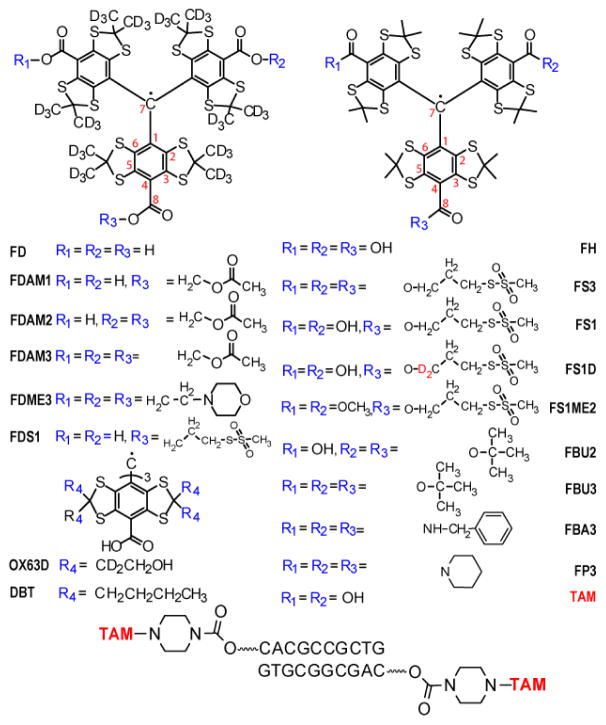
In this paper we report the synthesis and study spectroscopic parameters (including 13C HFI constants) of a large series of TAM radicals shown in Fig. 1, developed for the future application as spin labels. In addition to spectroscopic characterization, we demonstrate the first room-temperature PELDOR/DEER distance measurement in model TAM-labeled DNA using 13C resonance line for observation and main EPR line for pumping.
Figure 1.
Chemical structure of studied TAM radicals and TAM spin labeled DNA duplex.
Experimental
The synthesis of FD, FH, FDAM1, FDAM2, FDAM3, FDME3, OX63D, DBT, FBA3, FP3 was described in detail previously [11]. The synthesis of TAM-labeled DNA duplex and the procedure of its immobilization in trehalose matrix were also described [28, 39].
Synthesis of FS3, FS1, FS1D, FS1ME2, FDS1, FBU2 and FBU3
General
1H and 13C NMR spectroscopic data were recorded using a Bruker AV-400 spectrometer (1H NMR: 400.134 MHz, 13C NMR: 100.624 MHz) Bruker AV-300 (1H NMR: 300.13 MHz, 13C NMR: 75.48 MHz) and for solutions in CDCl3. Chemical shifts (δ scale) are given in ppm with reference to residual signals of [1H]chloroform (1H NMR: 7.26, 13C NMR: 77.16). IR spectra were recorded using a Bruker Tensor 27 and Bruker Vector 22 FTIR spectrometers, and KBr pellets were used. Wavenumber values are given in cm−1. The EPR spectra were recorded on a Bruker ELEXSYS E540 spectrometer (microwave power of 2 mW, modulation frequency of 100 KHz and modulation amplitude of 0.003 mT). MALDI-TOF mass spectra were recorded using an Ultraflex III MALDI-TOF mass spectrometer (Bruker Daltonics, Germany) equipped with a pulsed smart-beam laser (325 nm) in a positive reflectron mode. Ions formed by a laser beam were accelerated to 25 keV kinetic energy. The final spectra were obtained by the accumulation of 200 single-laser-shot spectra. The solution (50 mg/ml) of 2,5-dihydroxybenzoic acid (DHB) in acetonitrile was used as a matrix. A sample solution in chloroform was mixed with the same volume of matrix solution. Approximately 1 μl of the resulting solution was deposited on the 384 ground steel target plate and allowed to dry before being introduced into the mass spectrometer. External calibration in positive mode was done using Peptide Calibration Standard II (Part No. 217498, Bruker Daltonics, Germany). Mass accuracy about 0.1 % was usually achieved. Mass spectra were processed using flexAnalysis 2.4 software (Bruker Daltonik GmbH, Germany). Electrospray ionization mass spectra ESI/MS were recorded using hybrid quadrupole/time-of-flight Bruker micrOTOF-Q spectrometer with methanol used as a solvent and scanning the spectra in m/z range 100–3000 in positive and negative ionization modes. Nitrogen was used as a drying gas at 220 °C and at flow rate of 4 L min−1. Nebulizer pressure was set to 1.0 bar. The capillary voltage was set at − 4.0 kV. Sample solutions were infused into the ESI source by LC Agilent 1200 at FIA mode (Flow Injection Analysis, 2–3 μL at a flow rate of the solvent 0.1 mL min−1). Preparative column chromatography was performed using 60–200 μm silica gel purchased from Acros. Chemicals were purchased from Aldrich and Acros and were used without further purification, unless otherwise stated.
Tris(8-carboxy-2,2,6,6-tetramethylbenzo[1,2-d;4,5-d′]bis[1,3]dithiol-4-yl)methyl (FH, Finland trityl, see Scheme 1) and tris(8-carboxy-2,2,6,6-tetra(trideuteromethyl)benzo[1,2-d;4,5-d′]bis[1,3]dithiol-4-yl)methyl (FD) were prepared by the recently published literature method [46]. Dimethyl ester of FH (TAM 3, Scheme 2) was synthesized according to known protocol [47].
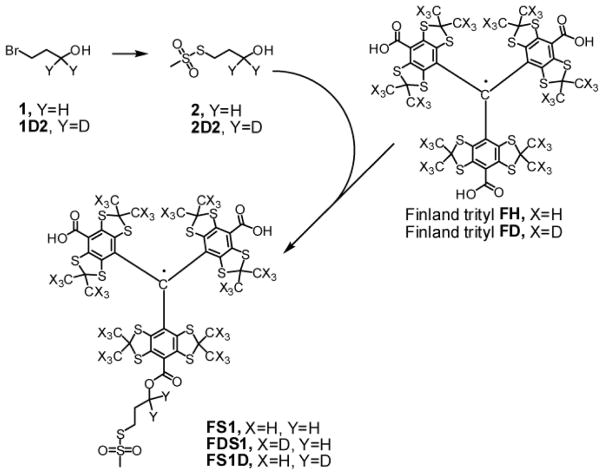
Scheme 1.
Synthesis of TAM-MTS spin labels FS1, FDS1 и FS1D.
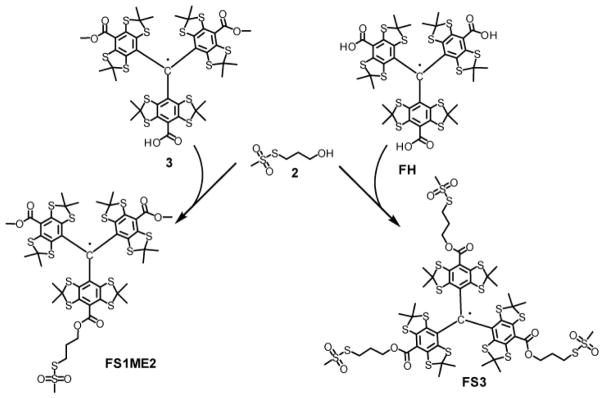
Scheme 2.
Synthesis of FS1ME2 и FS3.
3-Bromopropane-1-D2-1-ol (1D2, Scheme 1)
A three-neck round-bottom 500-mL flask equipped with magnetic stirrer, two dropping funnels, efficient condenser and CaCl2 tube was charged with LiAlD4 (2.17 g, 51.6 mmol) and anhydrous ether (50 mL). The flask was flushed with argon, and a solution of anhydrous AlCl3 (6.86 g, 51.6 mmol) in anhydrous ether (50 mL) was added slowly from a dropping funnel under vigorous stirring with cooling on an ice-bath. After stirring at room temperature for 30 min the mixture was cooled to −20 °C, and a solution of freshly distilled methyl 3-bromopropionate (8.62 g, 51.6 mmol) in anhydrous ether (80 mL) was added dropwise under stirring. The mixture was stirred at −20 °C for 1 h, quenched by slow addition of methanol (8.5 mL) solution in ether (8.5 mL) followed by water (50 mL) and 6 M sulfuric acid (50 mL), and stirred at room temperature for 30 min. The organic layer was separated, and the water phase was extracted with ether (10 × 10 mL). The combined organic extract was dried over MgSO4, filtered through a short plug of silica gel, and concentrated in vacuo to give the title product as a pale-yellow liquid (6.62 g, 91 %). 1H NMR (300.13 MHz, CDCl3): δ = 2.04 (t, 2H, J = 6.42 Hz, CH2CH2CD2), 2.73 (bs, 1H, OH), 3.51 (t, 2H, J = 6.42 Hz, BrCH2). 13C NMR (75.48 MHz, CDCl3): δ = 30.41 (CH2CH2CD2), 34.83 (BrCH2), 59.61 (m, OCD2).
S-3-Hydroxypropyl methanesulfonothioate (2) was prepared according to literature method [30]. 1H NMR (400 MHz, CDCl3): δ = 1.97 (m, 2H, CH2CH2CH2), 2.55 (bs, 1H, OH), 3.28 (t, 2H, J = 7.0 Hz, SCH2), 3.32 (s, 3H, SO2CH3), 3.73 (t, 2H, J = 5.6 Hz, OCH2). 13C NMR (100 MHz, CDCl3): δ = 31.56 (CH2CH2CH2), 32.13 (SCH2), 50.42 (SO2CH3), 59.99 (OCH2). IR (thin film): ν̃ = 3541 (m), 3395 (m), 3028 (w), 3009 (w), 2928 (m), 2884 (w), 1410 (w), 1312 (vs), 1130 (vs), 1049 (m), 959 (m), 748(m), 555 (s), 482 (m) cm−1.
S-3-Hydroxy-3-D2-propyl methanesulfonothioate (2D2) was prepared analogously from sodium methanethiosulfonate and 3-bromopropan-1-D2-1-ol (1D2). 1H NMR (400 MHz, CDCl3): δ = 1.97 (t, 2H, J = 7.00 Hz, CH2CH2CD2), 2.25 (bs, 1H, OH), 3.28 (t, 2H, J = 7.00 Hz, SCH2), 3.33 (s, 3H, SO2CH3). 13C NMR (100 MHz, CDCl3): δ = 31.98 (CH2CH2CD2), 32.97 (SCH2), 50.59 (SO2CH3), 59.37 (m, OCD2).
Methanethiosulfonate derivative of Finland trityl (FS1) was synthesized from alcohol 2 and trityl FH by known literature method [30]. HR MS (ESI, m/z): 1149.921 (measured), 1149.9288 (calcd for C44H46O8S14 [M-H]−). IR (KBr): ν̃ = 2955 (m), 2920 (m), 2855 (m), 1703 (m), 1574 (s), 1487 (m), 1450 (m), 1385 (s), 1315 (s), 1234 (vs), 1167 (m), 1132 (m), 1113 (m), 731 (w), 555 (w) cm−1. EPR spectrum for 0.60 mM deoxygenated solution in methanol: triplet, αH 0.0108 mT, linewidth 0.0055 mT, g=2.00265.
Methanethiosulfonate derivative of deuterated Finland trityl (FDS1) was synthesized analogously from alcohol 2 and deuterated form of Finland trityl (FD). HR MS (ESI, m/z): continuous series of peaks lying in 1177–1188 m/z range with the highest peak corresponding to 1183.130 (measured), 1183.136 (calcd for C44H13D33O8S14 [M-H]−). IR (KBr): ν̃ = 2955 (m), 2922 (m), 2218 (m), 1697 (m), 1571 (s), 1489 (m), 1385 (s), 1354 (s), 1317 (s), 1234 (vs), 1130 (s), 1045 (m), 1022 (m), 1002(m), 887 (w), 727(m), 554 (m) cm−1. EPR spectrum for 0.55 mM deoxygenated solution in methanol: triplet, αH 0.0109 mT, linewidth 0.0028 mT, g=2.00266.
Methanethiosulfonate D2-derivative of Finland trityl (FS1D) was synthesized analogously from alcohol 2D2 and Finland trityl (FH). HR MS (MALDI-TOF, m/z): 1152.987 (measured), 1152.949 (calcd for C44H45D2O8S14 [M]+); 1175.980 (measured), 1175.938 (calcd for C44H45D2NaO8S14 [M+Na]+). IR (KBr): ν̃ = 2957 (m), 2920 (s), 2851 (m), 1695 (m), 1576 (s), 1489 (m), 1452 (m), 1433 (m), 1382 (vs), 1366 (s), 1317 (s), 1273 (m), 1234 (vs), 1167 (m), 1147 (s), 1132 (s), 1112 (m), 1072 (m), 729 (m), 555 (m) cm−1. EPR spectrum for 0.60 mM deoxygenated solution in methanol: singlet, linewidth 0.0044 mT, g=2.00266.
Methanethiosulfonate derivative FS1ME2
A solution of trityl 3 (0.075 g, 0.073 mmol) and dry triethylamine (0.011 g, 0.11 mmol) in freshly distilled anhydrous chloroform (1.50 mL) was stirred at room temp. for 1h under argon. Crystalline BOP-Cl (0.024 g, 0.091 mmol) was added. The mixture was stirred at room temperature for 30 min under argon, after which a solution of alcohol 3 (0.019 g, 0.11 mmol) in anhydrous chloroform (0.20 mL) was added. To resulting deep reddish-brown solution was added a solution of 4-dimethylaminopyridine (DMAP, 0.003 g, 0.04 mmol) in anhydrous chloroform (0.2 mL).
The mixture, which slowly turned to deep green, was stirred in dark under argon at room temperature for 48 h, and then transferred to a 50 mL conical flask. Water (10 mL), dichloromethane (DCM, 5 mL) and sodium bicarbonate (0.140 g, 1.66 mmol) were added, and resulting heterogeneous mixture was vigorously stirred for 20 min. The water phase was acidified with 0.2 M aqueous HCl to pH 3, after which the mixture was extracted with DCM (3 × 10 mL). The combined organic extract was filtered and concentrated in vacuo. Column chromatography on silica gel (DCM, then DCM/ethyl acetate from 30:1 to 1:1 v/v) gave the title trityl FS1ME2 as a black precipitate, M.p. > 240 °C (gradually decomposed). Yield: 0.076 g, 88 %. HR MS (ESI, m/z): 1178.963 (measured), 1178.967 (calcd for C46H51O8S14 [M]+). IR (KBr): ν̃ = 2955 (w), 2922 (w), 2860 (w), 2850 (w), 1705 (s), 1489 (w), 1452 (m), 1433 (m), 1366 (m), 1325 (m), 1273 (m), 1234 (vs), 1167 (m), 1134 (s), 1111 (m), 1043 (w), 789 (w), 743 (w), 690 (w), 554 (w) cm−1. EPR spectrum for 0.50 mM deoxygenated solution in DCM: multiplet, αH(CH3) 0.425 MHz, αH(CH2) 0.329 MHz, linewidth 0.0063 mT, g=2.00280.
Methanethiosulfonate derivative FS3
A mixture of Finland trityl FH (0.110 g, 0.110 mmol) and carbonyldiimidazole (0.107 g, 0.66 mmol) in anhydrous tetrahydrofurane (1.50 mL) was stirred at 50 °C for 2 h under argon, and then overnight at room temperature. A solution of alcohol 3 (0.112 g, 0.66 mmol) in anhydrous THF (0.60 mL) was added. The resulting mixture was stirred under argon for 0.5 h at room temperature, after which sodium hydride (60 % suspension in mineral oil, 0.030 g) was added. The mixture, which turned to deep brownish-green, was stirred under argon at room temperature for 48 h in dark, and then transferred to a 50 mL evaporating flask. THF was removed in vacuo, and then water (5 mL) and DCM (5 mL) were added. The resulting mixture was vigorously stirred, acidified with 0.2 M aqueous HCl to pH 3. Water phase was separated and extracted with DCM (3 × 10 mL). The combined organic extract was washed with water, filtered and concentrated in vacuo. Column chromatography on silica gel (DCM, then DCM/methanol 30:1 v/v) gave the title trityl FS3 as a brownish-black foam, M.p. > 220 °C (gradually decomposed). Yield: 0.081 g, 50 %. HR MS (ESI, m/z): 1454.927 (measured), 1454.929 (calcd for C52H63O12S18 [M]+); 1472.960 (measured), 1472.966 (calcd for C52H67 NO12S18 [M+NH4]+). IR (KBr): ν̃ = 2959 (w), 2920 (w), 2862 (w), 2845 (w), 1744 (w), 1452 (m), 1385 (w), 1366 (m), 1321 (s), 1234 (vs), 1169 (m), 1134 (vs), 1111 (m), 1140 (m), 1017 (3), 955 (m), 744 (w), 554 (s), 482 (m), 467 (m), 451 (m) cm−1. EPR spectrum for 0.50 mM solution in DCM: septet, αH(CH2) 0.335 MHz, linewidth 0.0080 mT, g=2.00280.
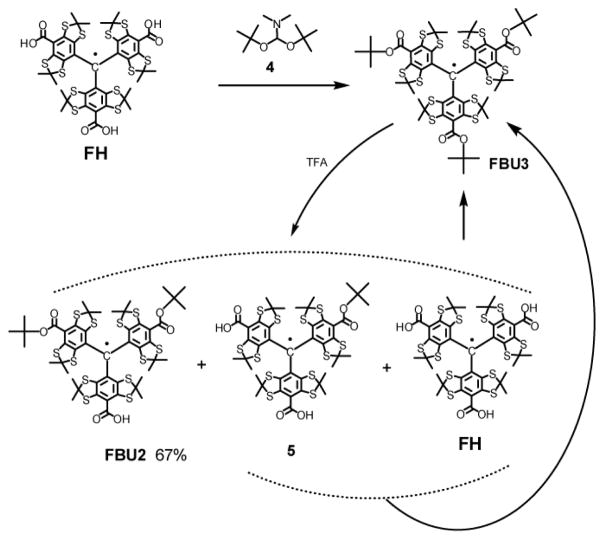
Tris(8-tert-butoxycarbonyl-2,2,6,6-tetramethylbenzo[1,2-d;4,5-d′]bis[dithiol-4-yl)methyl (FBU3, Scheme 3)
Scheme 3.
Synthesis of TAM FBU3 and FBU2.
A 5 mL Wheaton-vial equipped with magnetic stirrer was charged with Finland-trityl FH (0.200 g, 0.197 mmol), anhydrous benzene (2 mL) and N,N-dimethylformamide di-tert-butyl acetal 4 (0.605 g, 2.98 mmol, prepared by literature method). The mixture was stirred at 80 °C for 48 h. The reaction mixture was diluted with DCM (20 mL) and water (2 mL). Organic layer was separated, filtered through a short cotton plug and concentrated in vacuo. Column chromatography on silica gel (hexane, then hexane/DCM from 1:1 to 1:3 v/v) gave the title trityl as a brown precipitate, M.p. > 220 °C (gradually decomposed). Yield: 0.173 mg, 75%. HR MS (ESI, m/z):1167.133 (measured), 1167.127 (calcd for C52H63O6S12 [M]+). IR (KBr): ν̃ = 2958 (s), 2924 (s), 2854 (m), 1728(s), 1697 (s), 1454 (s), 1367 (s), 1281 (s), 1240 (vs), 1163 (s), 1134 (vs), 1113 (s), 1072 (s), 1036 (m), 847 (m), 725 (m), 687 (w), 559 (w), cm−1. EPR spectrum for 0.50 mM deoxygenated solution in DCM: for 0.50 mM solution in DCM: singlet, linewidth 0.0102 mT, g=2.00277.
Di-tert- Bu ester FBU2 (Scheme 3)
A one neck round bottom 20 ml flask equipped with magnetic stirrer was charged with tri-ester FBU3 (0.194 g, 0.166 mmol) and anhydrous benzene (95 ml). A solution of TFA (0.5 mL, 29.6 mmol) in 1 mL DCM was added dropwise under stirring. The mixture was stirred at room temperature for 1.5 h, diluted with DCM (30 mL), washed with 3 mL of saturated solution of NaHCO3. The organic layer was filtered through a short cotton plug and concentrated in vacuo. Column chromatography on silica gel (DCM, then DCM/MeOH, 50:1 v/v) afforded the initial substrate FBU3 (0.083 g, used further in repeated runs), a mixture of mono-ester 5 and Finland trityl FH (0.037 g, used for conversion to substrate FBU3 by the method described above), and the title monocarboxylic acid FBU2 (0.085 g, 51 %). Three iteration afforded 0.123 g of FBU2 (67%) with partial recovery of precursor FBU3 (16%). Data for trityl FBU2: black powder, M.p. > 200 °C (gradually decomposed). HR MS (ESI, m/z): 1110.051 (measured), 1110.057 (calcd for C48H55O6S12 [M-H]−). IR (KBr): ν̃ = 2970 (m), 2956 (m), 2924 (m), 2852 (m), 1697 (s), 1489 (m), 1454 (m), 1435 (m), 1392 (m), 1383 (m), 1367 (s), 1308 (m), 1279 (m), 1238 (vs), 1165 (s), 1136 (s), 1111 (m), 847 (w), 737 (w), 688 (w) cm−1. EPR spectrum for 0.50 mM deoxygenated solution in DCM: singlet, linewidth 0.0108 mT, g=2.00276.
CW EPR measurements
CW EPR data presented in Figures 2–3 were recorded using the X-band (9 GHz) commercial Bruker EMX spectrometer. Experimental CW EPR settings at room temperature were as follows: sweep width, 0.1–3.0 mT; microwave power, 10.11 mW; modulation frequency, 100 kHz; modulation amplitude, 0.01–0.02 mT; time constant, 163.8–327.7 ms; sweep time, 167.77 671.09 s; number of points, 1024–8192; number of scans, 1–6. To prevent the line broadening caused by oxygen, deoxygenation was performed by at least three repeated “freeze–pump–thaw” cycles. The experimental spectra were simulated using Easyspin [48]. The fitting parameters were g-factor, Gaussian and Lorentzian contributions into the linewidth, the values of HFI constants on 13C, 1H and 14N atoms. The obtained spectroscopic parameters are summarized in Table 1.
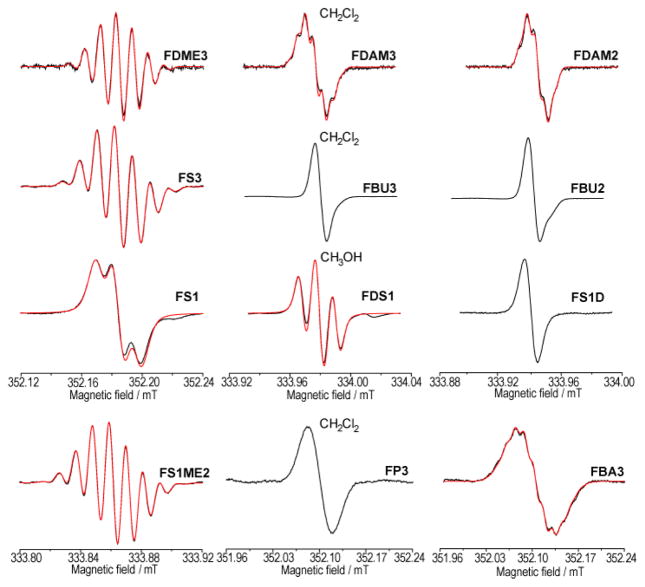
Figure 2.
EPR spectra of studied TAM radicals (central 12C regions). Experimental spectra – black line, simulated spectra - red line (parameters are given in Table 1).
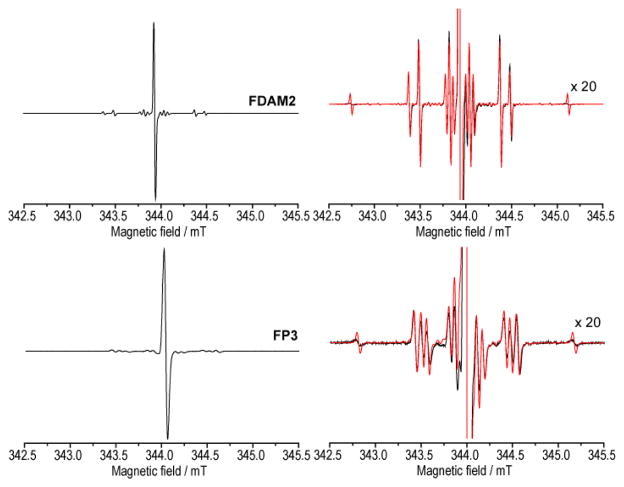
Figure 3.
(Top) EPR spectrum of FDAM2 (typical for all other studied TAMs). Intense EPR line corresponding to 12C atoms appears in the center; other satellite lines corresponding to HFIs with 13C atoms appear on the sides. Right plot magnifies the intensity by a factor of 20. Experimental (CH2Cl2, black line) and simulated (red line). (Bottom). Similar data for FP3 radical. Experimental (CH2Cl2, black line) and simulated (red line). Note that this type of EPR spectrum was observed only for FP3 radical in CH2Cl2 and methanol.
Table 1.
Spectroscopic parameters of studied TAMs. HFI constants are given in mT for 13C and in μT for 1H and 14N nuclei. Accuracy of measurement is ±0.02 mT for C7, and ± 0.01 mT for all other HFI constants. aH1 and aH2 are HFI constants for methylene protons of ester or amide groups. giso values were measured relative to Finland trityl (FD, giso = 2.0026 [50]).
| Solvent | ac7 | ac1 | ac2,6 | ac4 | ac3,5 | ac8 | aH1 | aH2 | aN | giso | |
|---|---|---|---|---|---|---|---|---|---|---|---|
| FD | H2O | 2.34 | 1.11 | 0.90 | 0.33 | 0.24 | 0.13 | - | - | - | 2.00260b |
| MeOH | 2.37 | 1.11 | 0.89 | 0.31 | 0.22 | 0.13 | - | - | - | 2.00260a | |
| FDAM1 | MeOH | 2.36 | 1.11 | 0.89 | 0.32 | 0.23 | 0.13 | 4.7(1)a | 4.3(1)a | - | 2.00266a |
| FDAM2 | CH2Cl2 | 2.36 | 1.10 | 0.89 | 0.30 | 0.22 | 0.14 | 5.5(2) | 4.5(2) | - | 2.00277 |
| MeOH | 2.35 | 1.10 | 0.89 | 0.30 | 0.22 | 0.14 | 5.1(2)a | 4.5(2)a | - | 2.00271a | |
| FDAM3 | MeOH | 2.38 | 1.11 | 0.88 | 0.30 | 0.22 | 0.14 | 5.0(3)a | 4.5(3)a | - | 2.00277a |
| CH2Cl2 | 2.37 | 1.11 | 0.89 | 0.30 | 0.22 | 0.14 | 5.5(3) | 4.6(3) | - | 2.00285 | |
| FDME3 | MeOH | 2.38 | 1.11 | 0.89 | 0.30 | 0.22 | 0.13 | 9.4(3)a | 9.1(3)a | - | 2.00274a |
| CH2Cl2 | 2.38 | 1.11 | 0.89 | 0.29 | 0.22 | 0.13 | 10.5(3) | 9.8(3) | - | 2.00279 | |
| OX63D | MeOH | 2.35 | 1.11 | 0.89 | 0.31 | 0.23 | 0.13 | - | - | - | 2.00267a |
| H2O | 2.33 | 1.11 | 0.89 | 0.33 | 0.23 | 0.13 | - | - | - | 2.00268a | |
| DBT | MeOH | 2.35 | 1.12 | 0.90 | 0.32 | 0.23 | 0.12 | - | - | - | 2.00266a |
| FBA3 | MeOH | 2.39 | 1.13 | 0.91 | 0.34 | 0.22 | - | <6.0(3)a | <6.0(3)a | 18.2(3)a | 2.00255a |
| CH2Cl2 | 2.38 | 1.13 | 0.91 | 0.34 | 0.22 | - | 12.9(3) | 12.9(3) | 13.2(3) | 2.00260 | |
| FP3 | MeOH | 2.37 | 1.12 | 0.97;0.85 | 0.36 | 0.24 | - | - | - | <10.7(3)a | 2.00252a |
| CH2Cl2 | 2.36 | 1.12 | 0.97;0.85 | 0.36 | 0.24 | - | - | - | <10.7(3) | 2.00253 | |
| FBU3 | CH2Cl2 | 2.38 | 1.11 | 0.89 | 0.31 | 0.22 | 0.14 | - | - | - | 2.00277 |
| FBU2 | CH2Cl2 | 2.38 | 1.11 | 0.89 | 0.31 | 0.22 | 0.14 | - | - | - | 2.00276 |
| FH | MeOH | 2.36 | 1.12 | 0.90 | 0.33 | 0.23 | 0.13 | - | - | - | 2.00260 |
| H2O | 2.34 | 1.11 | 0.90 | 0.33 | 0.24 | 0.13 | - | - | - | 2.00260b | |
| FS3 | CH2Cl2 | 2.39 | 1.11 | 0.89 | 0.30 | 0.22 | 0.14 | 11.3(3) | 11.0(3) | - | 2.00280 |
| FS1ME2 | CH2Cl2 | 2.38 | 1.11 | 0.89 | 0.30 | 0.22 | 0.14 | 10.5(6) | 10.8(2) | - | 2.00280 |
| FS1 | MeOH | 2.35 | 1.11 | 0.89 | 0.31 | 0.23 | 0.13 | 11.0(1) | 10.0(1) | - | 2.00265 |
| FDS1 | MeOH | 2.35 | 1.11 | 0.89 | 0.32 | 0.23 | 0.13 | 12.0(1) | 10.0(1) | - | 2.00266 |
| FS1D | MeOH | 2.35 | 1.11 | 0.89 | 0.32 | 0.23 | 0.13 | - | - | - | 2.00266 |
Pulsed EPR measurements
Pulsed EPR experiments were carried out using Bruker Elexsys E580 spectrometer at room temperature. Measurements of electron phase relaxation time were performed using a two-pulse electron spin echo (ESE) sequence. DEER traces were recorded using a standard four-pulse DEER [32] sequence with pulse lengths of 60/120 ns for probe and 120 ns for pump frequency. We used the 13C satellite for observing and the main line of 12C for pumping. Short repetition time between experiments was 350 μs. Number of scans was 4850. Recording time was 20 h. Obtained DEER traces were analyzed with Tikhonov regularization using DeerAnalysis program [49].
RESULTS AND DISCUSSION
Structure of studied TAMs
The series of TAM radicals studied in this paper include Finland trityl (FH, Figure 1); and its perdeuterated analogues FD; their derivative monoesters (FDAM1, FDS1, FS1, FS1D), diesters (FDAM2, FBU2), triesters (FDAM3, FDME3, FS3, FS1ME2, FBU3); triamide derivatives (FBA3, FP3); the deuterated form of OX63 (OX63D) and the dodeca-n-butyl homologue of Finland trityl (DBT). The variety of these TAMs allowed us to investigate the dependence of 13C HFI constants on the number of ester groups (which affect the symmetry of TAM), on additional HFIs with proton and nitrogen atoms, as well as on bulky substituents in TAM core.
FS1, FS3, FDS1, FS1D are perspective for application as spin labels, because they possess methanesulfonothioate groups reacting with cysteine residuals in the proteins. Moreover the study of deuterated radicals, in particular FDS1 and FSD1, is very important for pulse dipolar EPR at room temperatures due to their long electron spin dephasing times [11].
CW EPR
Figure 2 shows the central (12C) regions of CW EPR spectra of studied TAMs, whereas Figure 3 includes the ranges of hyperfine splitting on 13C carbons (exemplified with FDAM2 and FP3). In all cases the 13C satellite EPR lines were observed with ratio of intensities equal to 1:3:6:3:6:3:3:6:3:6:3:1. This ratio nicely corresponds to the number of equivalent carbon atoms in TAM molecule: 1 - C7: 3 - C1: 6 - C2,6: 3- C4: 6- C3,5: 3 - C8 [45]. It should be noted that fast conformational changes exhibited by TAM make carbon atoms in positions C3 and C5, as well as C2 and C6, equivalent. The line width of satellites increases upon an increase of the HFI constant. This is reasonable because the main contribution into the linewidth is determined by modulation of HFI anisotropy, which in most cases increases with the increase of isotropic HFI.
Spectroscopic parameters (HFI constants on 13C, 1H and 14N) obtained by simulations are listed in Table 1. Numbering of 13C atoms corresponds to that shown in Fig. 1. One observes that the values of 13C HFI constants are nearly the same within experimental accuracy for all studied TAMs. Interestingly, the values of 13C HFI constant do not depend on the number of ester group (FD, FDAM1, FDAM2, FDAM3), on bulky substituents in TAM core (FH, OX63D, DBT) and on solvent (water, methanol and ethylene chloride).
Most of the studied TAMs give similar EPR spectra, however noticeable difference is observed for amide derivative of Finland radical FP3, where the rotation along amide bond is impeded by bulky piperidine groups. As a result C2 and C6 carbons of benzene ring become nonequivalent (Fig. 1) leading to the splitting in EPR spectrum with values of 13C HFI constants equal to 0.97 and 0.85 mT (Fig. 3 and Table 1). It is interesting that the mean value of these two HFIs is equal to the HFI values found for C2 and C6 in other TAMs. This effect was not observed for the other amide derivative of Finland radical FBA3 due to a free rotation of benzyl groups.
DEER measurements
PELDOR/DEER distance measurements require immobilization of spin-labeled biomolecule to provide that the dipole-dipole interaction is not averaged out by rotational diffusion. This requirement is naturally fulfilled for the sample in frozen solution. For room temperature measurements different approaches were previously used, including tethering of the protein to a solid support prior to labeling [27], immobilization of DNA duplex electrostatically on common ion exchange sorbent [28], immobilization of biomolecule in glassy trehalose [39–41]. For our DEER measurements we used the latter approach, which was successfully implemented for immobilization of proteins [40], as well as DNA [39].
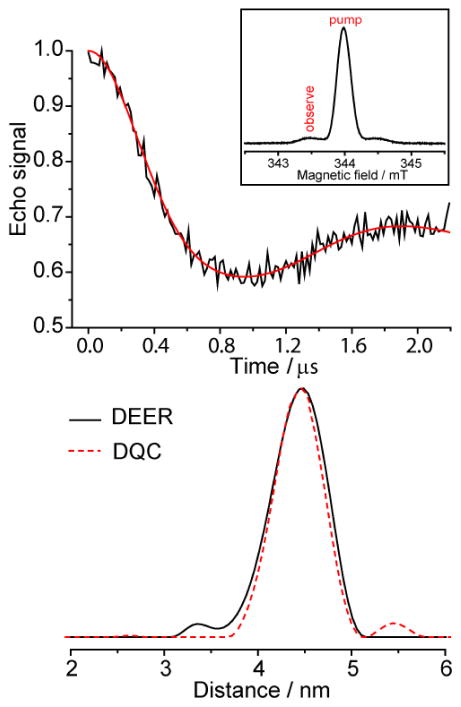
For validation purposes, we have investigated model doubly TAM-labeled DNA duplex in glassy trehalose, which was previously studied at room temperature using DQC (described in detail in [39]). Figure 4 clearly shows that the room temperature DEER employing 13C satellite of TAM for observation and the main line for pumping allows obtaining similar distances as those found previously by DQC for the same sample. The phase memory time Tm measured using two-pulse sequence is slightly larger at central (12C) EPR line (Tm = 2.2 μs) compared to that at 13C satellite (Tm = 1.7 μs) due to the contribution from modulation of anisotropic 13C HFI for the latter. However, still the value of Tm and the signal intensity at 13C satellite are sufficient for reliable DEER measurements at room temperature. The spin-spin distance obtained using DEER equals to 4.43 ± 0.27 nm, being in excellent agreement with previously obtained data for this duplex [28].
Figure 4.
(Top) Background-corrected X-band DEER time trace obtained at room temperature (black line) and the fit obtained by Tikhonov regularization (red). Inset illustrates the pump and probe pulse positions on the spectrum of TAM. (Bottom) Corresponding distance distributions for DEER (solid black line) and DQC (previously obtained in [39]) (dashed red line).
Conclusions
Large series of TAM radicals, including their deuterated analogues, were developed and synthesised for prospective use as spin labels in pulsed dipolar EPR spectroscopy. The measurements of their spectroscopic parameters revealed a negligible dependence of 13C hyperfine constants on solvent, as well as on nature and number of substituents at para-C atoms of aromatic rings. The possibility of room temperature PELDOR/DEER distance measurements in TAM-labeled biomolecules using 13C satellite line of TAM at natural abundance has been demonstrated for the first time.
Acknowledgments
This work was supported by Russian Science Foundation (no. 14-14-00922).
Footnotes
NOTES
The authors declare no competing financial interests.
References
- 1.Anderson S, Golman K, Rise F, Wikstrom H, Wistrand L. 5530140. US Patent. 1996
- 2.Andersson S, Radner F, Rydbeck A, Servin R, Wistrand LG. US5728370 A. 1998
- 3.Thaning M. WO1998039277 A1. 1998
- 4.Ardenkjaer-Larsen JH, Leunbach I. WO1997009633 A1. 1997
- 5.Epel B, Redler G, Pelizzari C, Tormyshev VM, Halpern HJ. In: Oxygen Transport to Tissue XXXVII. Elwell CE, Leung TS, Harrison DK, editors. Springer; New York: 2016. p. 185. [Google Scholar]
- 6.Epel B, Redler G, Tormyshev V, Halpern HJ. In: Oxygen Transport to Tissue XXXVII. Elwell CE, Leung TS, Harrison DK, editors. Springer; New York: 2016. p. 363. [Google Scholar]
- 7.Dhimitruka I, Bobko AA, Eubank TD, Komarov DA, Khramtsov VV. J Am Chem Soc. 2013;135:5904. doi: 10.1021/ja401572r. [DOI] [PMC free article] [PubMed] [Google Scholar]
- 8.Dhimitruka I, Bobko AA, Hadad CM, Zweier JL, Khramtsov VV. J Am Chem Soc. 2008;130:10780. doi: 10.1021/ja803083z. [DOI] [PMC free article] [PubMed] [Google Scholar]
- 9.Dhimitruka I, Velayutham M, Bobko AA, Khramtsov VV, Villamena FA, Hadad CM, Zweier JL. Bioorg Med Chem Lett. 2007;17:6801. doi: 10.1016/j.bmcl.2007.10.030. [DOI] [PMC free article] [PubMed] [Google Scholar]
- 10.Owenius R, Eaton GR, Eaton SS. J Magn Reson. 2005;172:168. doi: 10.1016/j.jmr.2004.10.007. [DOI] [PubMed] [Google Scholar]
- 11.Kuzhelev AA, Trukhin DV, Krumkacheva OA, Strizhakov RK, Rogozhnikova OY, Troitskaya TI, Fedin MV, Tormyshev VM, Bagryanskaya EG. J Phys Chem B. 2015;119:13630. doi: 10.1021/acs.jpcb.5b03027. [DOI] [PMC free article] [PubMed] [Google Scholar]
- 12.Khan N, Swartz H. Mol Cell Biochem. 2002;234:341. [PubMed] [Google Scholar]
- 13.Kuppusamy P, Wang PH, Chzhan M, Zweier JL. MagnResonMed. 1997;37:479. doi: 10.1002/mrm.1910370402. [DOI] [PubMed] [Google Scholar]
- 14.Liu YP, Villamena FA, Song YG, Sun JA, Rockenbauer A, Zweier JL. J Org Chem. 2010;75:7796. doi: 10.1021/jo1016844. [DOI] [PMC free article] [PubMed] [Google Scholar]
- 15.Halevy R, Tormyshev V, Blank A. Biophys J. 2010;99:971. doi: 10.1016/j.bpj.2010.05.002. [DOI] [PMC free article] [PubMed] [Google Scholar]
- 16.Liu YP, Villamena FA, Sun J, Wang TY, Zweier JL. Free Radical Biol Med. 2009;46:876. doi: 10.1016/j.freeradbiomed.2008.12.011. [DOI] [PMC free article] [PubMed] [Google Scholar]
- 17.Liu Y, Villamena FA, Sun J, Xu Y, Dhimitruka I, Zweier JL. J Org Chem. 2008;73:1490. doi: 10.1021/jo7022747. [DOI] [PubMed] [Google Scholar]
- 18.Rizzi C, Samouilov A, Kutala VK, Parinandi NL, Zweier JL, Kuppusamy P. Free Radical Biol Med. 2003;35:1608. doi: 10.1016/j.freeradbiomed.2003.09.014. [DOI] [PubMed] [Google Scholar]
- 19.Elas M, Hleihel D, Barth ED, Haney CR, Ahn KH, Pelizzari CA, Epel B, Weichselbaum RR, Halpern HJ. Mol Imaging Biol. 2011;13:1107. doi: 10.1007/s11307-010-0436-4. [DOI] [PMC free article] [PubMed] [Google Scholar]
- 20.Elas M, Ahn KH, Parasca A, Barth ED, Lee D, Haney C, Halpern HJ. Clin Cancer Res. 2006;12:4209. doi: 10.1158/1078-0432.CCR-05-0446. [DOI] [PubMed] [Google Scholar]
- 21.Elas M, Williams BB, Parasca A, Mailer C, Pelizzari CA, Lewis MA, River JN, Karczmar GS, Barth ED, Halpern HJ. MagnResonMed. 2003;49:682. doi: 10.1002/mrm.10408. [DOI] [PubMed] [Google Scholar]
- 22.Driesschaert B, Marchand V, Leveque P, Gallez B, Marchand-Brynaert J. Chem Commun (Camb) 2012;48:4049. doi: 10.1039/c2cc00025c. [DOI] [PubMed] [Google Scholar]
- 23.Bobko AA, Dhimitruka I, Komarov DA, Khramtsov VV. Anal Chem. 2012;84:6054. doi: 10.1021/ac3008994. [DOI] [PMC free article] [PubMed] [Google Scholar]
- 24.Talmon Y, Shtirberg L, Harneit W, Rogozhnikova OY, Tormyshev V, Blank A. Phys Chem Chem Phys. 2010;12:5998. doi: 10.1039/b922060g. [DOI] [PubMed] [Google Scholar]
- 25.Leggett J, Hunter R, Granwehr J, Panek R, Perez-Linde AJ, Horsewill AJ, McMaster J, Smith G, Kockenberger W. Phys Chem Chem Phys. 2010;12:5883. doi: 10.1039/c002566f. [DOI] [PubMed] [Google Scholar]
- 26.Ardenkjaer-Larsen JH, Fridlund B, Gram A, Hansson G, Hansson L, Lerche MH, Servin R, Thaning M, Golman K. Proc Natl Acad Sci U S A. 2003;100:10158. doi: 10.1073/pnas.1733835100. [DOI] [PMC free article] [PubMed] [Google Scholar]
- 27.Yang ZY, Liu YP, Borbat P, Zweier JL, Freed JH, Hubbell WL. J Am Chem Soc. 2012;134:9950. doi: 10.1021/ja303791p. [DOI] [PMC free article] [PubMed] [Google Scholar]
- 28.Shevelev GY, Krumkacheva OA, Lomzov AA, Kuzhelev AA, Rogozhnikova OY, Trukhin DV, Troitskaya TI, Tormyshev VM, Fedin MV, Pyshnyi DV, Bagryanskaya EG. J Am Chem Soc. 2014;136:9874. doi: 10.1021/ja505122n. [DOI] [PubMed] [Google Scholar]
- 29.Shevelev GY, Krumkacheva OA, Lomzov AA, Kuzhelev AA, Trukhin DV, Rogozhnikova OY, Tormyshev VM, Pyshnyi DV, Fedin MV, Bagryanskaya EG. J Phys Chem B. 2015;119:13641. doi: 10.1021/acs.jpcb.5b03026. [DOI] [PMC free article] [PubMed] [Google Scholar]
- 30.Yang Z, Bridges MD, López CJ, Rogozhnikova OY, Trukhin DV, Brooks EK, Tormyshev V, Halpern HJ, Hubbell WL. J Magn Reson. 2016;269:50. doi: 10.1016/j.jmr.2016.05.006. [DOI] [PMC free article] [PubMed] [Google Scholar]
- 31.Milov AD, Salikhov KM, Shirov MD. Fiz Tverd Tela. 1981;23:975. [Google Scholar]
- 32.Pannier M, Veit S, Godt A, Jeschke G, Spiess HW. J Magn Reson. 2000;142:331. doi: 10.1006/jmre.1999.1944. [DOI] [PubMed] [Google Scholar]
- 33.Saxena S, Freed JH. J Chem Phys. 1997;107:1317. [Google Scholar]
- 34.Borbat PP, Freed JH. Chem Phys Lett. 1999;313:145. [Google Scholar]
- 35.Jeschke G, Pannier M, Godt A, Spiess HW. Chem Phys Lett. 2000;331:243. [Google Scholar]
- 36.Jager H, Koch A, Maus V, Spiess HW, Jeschke G. J Magn Reson. 2008;194:254. doi: 10.1016/j.jmr.2008.07.012. [DOI] [PubMed] [Google Scholar]
- 37.Razzaghi S, Brooks EK, Bordignon E, Hubbell WL, Yulikov M, Jeschke G. ChemBioChem. 2013;14:1883. doi: 10.1002/cbic.201300165. [DOI] [PMC free article] [PubMed] [Google Scholar]
- 38.Akhmetzyanov D, Schöps P, Marko A, Kunjir N, Sigurdsson ST, Prisner T. Phys Chem Chem Phys. 2015;17:24446. doi: 10.1039/c5cp03671b. [DOI] [PubMed] [Google Scholar]
- 39.Kuzhelev AA, Shevelev GY, Krumkacheva OA, Tormyshev VM, Pyshnyi DV, Fedin MV, Bagryanskaya EG. The Journal of Physical Chemistry Letters. 2016 doi: 10.1021/acs.jpclett.6b01024. in press. [DOI] [PMC free article] [PubMed] [Google Scholar]
- 40.Meyer V, Swanson MA, Clouston LJ, Boratyński PJ, Stein RA, Mchaourab HS, Rajca A, Eaton SS, Eaton GR. Biophys J. 2015;108:1213. doi: 10.1016/j.bpj.2015.01.015. [DOI] [PMC free article] [PubMed] [Google Scholar]
- 41.Kuzhelev AA, Strizhakov RK, Krumkacheva OA, Polienko YF, Morozov DA, Shevelev GY, Pyshnyi DV, Kirilyuk IA, Fedin MV, Bagryanskaya EG. J Magn Reson. 2016;266:1. doi: 10.1016/j.jmr.2016.02.014. [DOI] [PubMed] [Google Scholar]
- 42.Reginsson GW, Kunjir NC, Sigurdsson ST, Schiemann O. Chem-Eur J. 2012;18:13580. doi: 10.1002/chem.201203014. [DOI] [PubMed] [Google Scholar]
- 43.Mohos B, Tüdös F, Jókay L. Phys Lett A. 1967;24:310. [Google Scholar]
- 44.Schreiner K, Berndt A, Baer F. Mol Phys. 1973;26:929. [Google Scholar]
- 45.Bowman MK, Mailer C, Halpern HJ. J Magn Reson. 2005;172:254. doi: 10.1016/j.jmr.2004.10.010. [DOI] [PubMed] [Google Scholar]
- 46.Rogozhnikova OY, Vasiliev VG, Troitskaya TI, Trukhin DV, Mikhalina TV, Halpern HJ, Tormyshev VM. Eur J Org Chem. 2013;2013:3347. doi: 10.1002/ejoc.201300176. [DOI] [PMC free article] [PubMed] [Google Scholar]
- 47.Trukhin DV, Rogozhnikova OY, Troitskaya TI, Vasiliev VG, Bowman MK, Tormyshev VM. Synlett. 2016;27:893. doi: 10.1055/s-0035-1561299. [DOI] [PMC free article] [PubMed] [Google Scholar]
- 48.Stoll S, Schweiger A. J Magn Reson. 2006;178:42. doi: 10.1016/j.jmr.2005.08.013. [DOI] [PubMed] [Google Scholar]
- 49.Jeschke G, Chechik V, Ionita P, Godt A, Zimmermann H, Banham J, Timmel CR, Hilger D, Jung H. Appl Magn Reson. 2006;30:473. [Google Scholar]
- 50.Fielding AJ, Carl PJ, Eaton GR, Eaton SS. Appl Magn Reson. 2005;28:231. [Google Scholar]


