Figure 7.
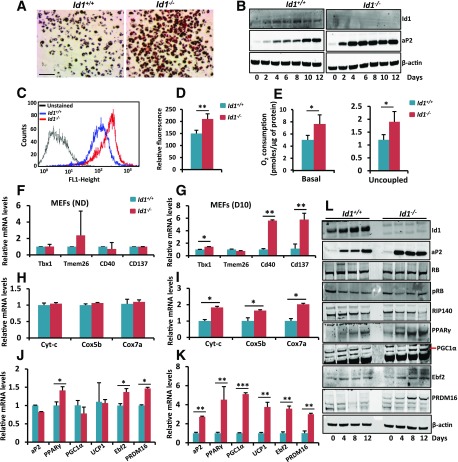
Increased beige/thermogenic gene expression in Id1−/− MEFs. A: Representative Oil Red O staining of day 10 differentiated Id1+/+ and Id1−/− MEFs. Scale bar = 20 μm. B: Expression patterns of Id1, aP2, and β-actin in differentiating MEFs at the indicated time points after inducing brown adipogenesis. C and D: FACS analysis of unstained and nonyl acridine orange–stained day 10 differentiated Id1+/+ and Id1−/− MEFs (C) and the quantification of fluorescence level (FL) (D) (n = 4). E: Basal and uncoupled respiration (after blocking ATP synthase with oligomycin) rate of day 10 differentiated Id1+/+ and Id1−/− MEFs (n = 3). F–K: Relative mRNA transcript levels of beige (F and G), mitochondrial (H and I), and thermogenic (J and K) genes in nondifferentiated (ND) (F, H, and J) and day 10 differentiated (D10) (G, I, and K) Id1+/+ and Id1−/− MEFs (n = 3). L: Expression levels of indicated proteins in Id1+/+ and Id1−/− differentiating MEFs at the indicated time points after inducing brown adipogenesis. Data are mean ± SD. *P < 0.05; **P < 0.005; ***P < 0.0005.

