

Abstract
Oxidative damage to the genome can yield the base 8-oxo-7,8-dihydroguanine (OG). In vitro studies suggested OG would preferentially form in 5′-GG-3′ sequence contexts after exposure to reactive oxygen species. Herein, OG locations in the genome were studied by development of “OG-Seq” to sequence OG sites via next-generation sequencing at ∼0.15-kb resolution. The results of this study found ∼10000 regions of OG enrichment in WT mouse embryonic fibroblasts and ∼18000 regions when the OG repair glycosylase Ogg1 was knocked out. Gene promoters and UTRs harbor more OG-enriched sites than expected if the sites were randomly distributed throughout the genome and correlate with reactive 5′-GG-3′ sequences, a result supporting decades of in vitro studies. Sequencing of OG paves the way to address chemical and biological questions surrounding this modified DNA base, such as its role in disease-specific mutations and its epigenetic potential in gene regulation.
Graphical abstract
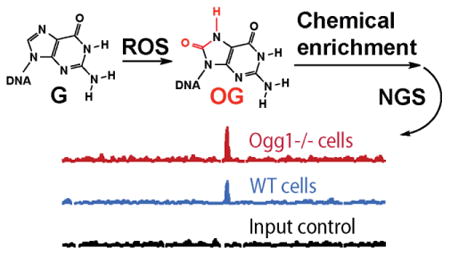
We report sequencing of the mouse genome for the oxidatively modified base 8-oxo-7,8-dihydroguanine (OG) by a method we are naming OG-Seq. OG stems from oxidation of the guanine (G) heterocycle by cellular reactive oxygen species (ROS).1 Oxidation of G is favored over the other heterocyclic DNA bases because it has the lowest redox potential.2 One-electron oxidation studies of oligomers in vitro have determined that the 5′ G of 5′-GG-3′ sequences is preferentially oxidized; the sequence dependency in the reaction results from base stacking decreasing the redox potential at the 5′ G.3,4 Further, oxidations under conditions that model the reducing cellular state show increased yields of OG.5 This observation is supported by extraction of genomic DNA from ROS-stressed cells where high yields of OG were identified.1 A drawback to the current methods of analyzing cellular OG levels is that the DNA is digested to nucleosides followed by mass spectrometry analysis causing all sequence information to be lost. Thus, it remains unknown if the OG formed in the genome occurs randomly, or if oxidations are site or region specific. More importantly, tracking preferential locations of OG formation is critical for understanding the molecular basis of disease and cancer causing G→T transversions;6 this mutation type is indirectly assigned to result from OG. Recently, evidence supporting a regulatory function for OG located in gene promoters was documented that suggests this modification may be epigenetic-like;7-10 therefore, to better understand both the mutational and epigenetic-like properties of OG, an OG sequencing approach is urgently needed.
Initial attempts to sequence OG from a genome followed two different methods. The first method harnessed a PCR primer to conduct polymerase extension to elucidate if an OG-specific mutation (G→T) occurs at a given site by Sanger sequencing.9,11 The second type of method utilized an OG antibody to find OG sites in the genome. If the genomic DNA is fragmented followed by OG antibody enrichment, microarray analysis allows OG sequencing at ∼10-kb resolution.12 When in situ immunodetection of OG was used to construct a chromosome map of OG, the resulting map was obtained at ∼1000-kb resolution.13 The OG antibody allowed ChIP-Seq analysis of OG in the rat genome at ∼0.1-kb resolution.10 These techniques all offer significant advancement of our knowledge regarding genomic OG, although each method has drawbacks. The PCR primer approach is low throughput and requires prior knowledge of critical locations to interrogate. For the antibody methods, generally the resolution is not high enough to determine precise genomic elements (i.e., promoters, UTRs, etc) in which OG resides; additionally, as we demonstrate below, the OG antibody binding affinity is significantly impacted by DNA secondary structures. The latter issue introduces considerable bias in the data obtained. In the present work, an approach was developed to map OG in the mouse genome at ∼0.15-kb resolution that utilized chemistry to label OG with biotin for affinity purification (AP) rather than immunoprecipitation (IP) for sample enrichment. The enriched samples were analyzed by next generation sequencing (NGS) to obtain the data sets described for the entire mouse genome.
Finding the sequences of the ∼1–2 OGs per 106 Gs for the entire mouse genome13 requires fragmenting the genome to smaller pieces (∼150 mers) followed by enrichment of the OG-containing strands. To identify the best enrichment protocol, control experiments were conducted with synthetic OG-containing oligomers of known sequence and secondary structure. The controls were also spiked with duplex oligomers devoid of OG to determine the impact that the non-OG-containing strands from the genomic sample (∼104–105 more) will have on the enrichment efficiency. A commercially available OG antibody was titrated from 10–7000 equiv. relative to OG in the contexts of ssDNA, dsDNA, and G4-DNA (Figures S1 and S2). These structures represent common contexts in which OG will reside after the genomic DNA has been fragmented and denatured by flash cooling for IP. We monitored the capture by 32P radiolabeling the strands followed by scintillation counting to quantify the enrichment. The OG strands were immunoprecipitated with the OG antibody, IgGb2, and protein-G coated magnetic beads. In Figure 1A, the results for enrichment using 7000 equiv. of the OG antibody relative to the OG-containing strands was 8±2% for ssDNA, 5±1% for G4-DNA, and background levels were observed for dsDNA. These observed yields were very low causing great concern going forward.
Figure 1.
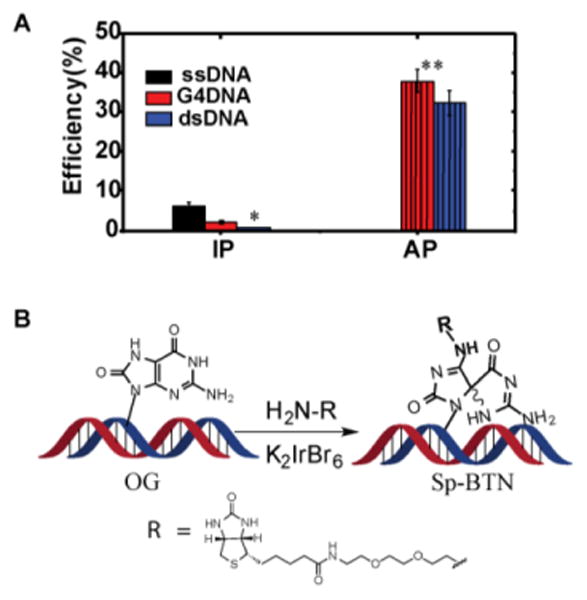
Chemical labeling of OG with biotin. (A) Comparison of context dependency on enrichment efficiency of OG-containing DNA by IP vs. AP. (B) Selective oxidation of OG with a mild one-electron oxidant (K2IrBr6) to form a covalent adduct to a primary-amine terminated biotin. *Enrichment was near the background levels. **The chemical labeling reaction was conducted at 75 °C such that a mixture of single-stranded DNA (ssDNA) or G-quadruplex (G4) DNA are present with double-stranded DNA (dsDNA).
Therefore, we turned to chemistry to find a solution to overcome the low antibody yields. An unusual property of OG is its redox potential that is ∼600 mV lower than G allowing selective oxidation of OG with a mild oxidant (∼13 kcal/mol difference; Fig. S2).5,14 Oxidation of OG yields an electrophilic intermediate that can be trapped with a primary-amine nucleophile to furnish a stable amine-conjugated product.15,16 Greenberg and co-workers harnessed this approach to synthesize biotin-terminated polyamines for labeling OG in the genomic context and quantify its concentrations.17 We capitalized on the Greenberg approach but used a commercially available amine-terminated biotin with a polyethylene glycol linker (BTN; Figure 1B). Additionally, we fine tuned the oxidant, selecting K2IrBr6 as a mild one-electron oxidant that is sufficiently reactive with OG without introducing oxidative damage to G. The test samples were identical to those used with the antibody except the enrichment step was achieved by AP of the biotinylated samples from the mixture with streptavidin (STP) coated magnetic beads. The K2IrBr6 (5 mM) was allowed to oxidize OG with 20 mM BTN present in conditions of 100 mM NaPi buffer at pH 8 and 75 °C for 30 min. Following AP, the reaction yield was determined as described above. We found that the OG-containing strands were enriched in a nearly 40% yield (Figures 1A and S2), representing a vast improvement over the OG antibody method; moreover, secondary structure did not impact the yield (Figure S2).
Chemical labeling of OG with BTN was applied to genomic DNA extracted from wild-type mouse embryonic fibroblasts (WT MEFs) and MEFs with Ogg1 knocked out (Ogg1-/- MEFs).18 The DNA glycosylase Ogg1 is the base excision repair protein responsible for removing genomic OG when base paired with C.19 The data sets derived from these two cell lines allow a comparison to identify locations in which OG concentrations increase due to inadequate repair; however, the low redox potential of OG14 results in increased susceptibility to further oxidation at these sites to yield hydantoin products5 that are silent to the sequence experiments conducted in the present study.
The WT and Ogg1-/- MEFs were grown under standard conditions to obtain ∼107 cells to harvest the genomic DNA (∼30 μg). The extracted DNA was fragmented by sonication to obtain a population of strands with an average length of 150 bp (Figures 2A and S3). The chemical labeling reaction was conducted on the fragmented samples. Next, STP magnetic beads were used to extract the biotinylated strands followed by releasing the complementary strands from the beads with 150 mM NaOH at 20 °C for 10 min (Figure 2A). The amine adducts are stable to these conditions.20 The ∼150-mer complementary strands (∼10 ng) were submitted for NGS using the Illumina HiSeq instrument (125 cycle paired-end v4). A single-stranded DNA adaptor kit was used for library preparation. The sequencing experiments obtained 89 million reads for the WT cells and 90 million reads for the Ogg1-/- cells. An input control was obtained by fragmenting WT-MEF DNA that was fragmented but not treated with the BTN labeling step (Figure 2A). The control sample provided 110 million reads. The reads provided a ∼3× average depth for the regions selected (Figure S4). This control was used to eliminate any sequence-dependent biases that may occur during the sequencing library preparation steps.
Figure 2.

(A) Enrichment method for OG strands from genomic DNA and (B) genome browser view to illustrate peak enrichment in WT and Ogg1-/- MEFs.
The NGS reads were aligned to the reference mouse genome (NCBI37/mm9) and more than 85% reads were successfully mapped to the reference (Figure S5). Enrichment peaks were called by MACS 2.0 using the input data without OG selection as a control (Figure 2B). Starting at 3-fold enrichment, 9,717 peaks in the WT-cell genomes and 18,097 from the Ogg1-/--cell genomes were observed (Figure 3A). The nearly 2-fold increase in peaks observed in the Ogg1-/- cells is consistent with the ∼2-fold increase in OG observed in the mice from which these cell lines were obtained.18 At 4-fold enrichment, there were many fewer peaks overall and the Ogg1-/--cell genomes had 5× more peaks than the WT-cell genomes (Figure 3A). Lastly, at 5-fold enrichment, there again was a reduction in the peak count and the Ogg1-/--cell genomes had nearly 10× more peaks of OG enrichment over the WT-cell genomes (Figure 3A). The observation that sequencing reads aligned to give peaks of enrichment supports a conclusion that OG formation is non-random in the genome. Moreover, the genomic regions enriched in OG, as is evident by the peaks, are regions that are more highly reactive toward oxidation than those where OG-enriched peaks were not observed. Although each set of sequencing experiments, with WT vs. Ogg1-/- genomes, was only performed once, the fact that the increase in OG in the repair-compromised cells was consistent with literature reports of the overall two-fold increase in OG lends confidence to the results.18 Further experiments will be needed to verify the consistency of the sites of modification in various cell lines and at different times in the cell cycle.
Figure 3.

Analysis of NGS reads obtained by applying OG-Seq to WT and Ogg1-/- MEFs. (A) Peak counts from the two cell lines at 3-, 4-, and 5-fold enrichment and above. (B) Counts of (5′-GT-3′)n microsatellite and telomere repeat DNA per million unmapped reads extracted from the two cell lines. (C) Enrichment in the 3-fold or more enriched peaks in each genomic element of the WT and Ogg1-/- MEF genomes. The counts plotted represent the fold enrichment observed in the genomic element relative to the expected count if the OG-enriched peaks were randomly distributed throughout the genome on the basis of each elements genomic distribution.
Repeat DNA does not align to the reference genome and is generally discarded from NGS analysis; however, we counted the number of reads comprised of the telomere repeat sequence (5′-TTAGGG-3′)n and the (5′-GT-3′)n microsatellites because they have the same percent G but different sequence contexts and chromosome positions. The counts are presented as number of repeat reads per million unmapped reads obtained. The counts found the Ogg1-/--cell genomic DNA contained more repeat strands with OG than the WT-cellular genomes; additionally, the (5′-GT-3′)n repeat count doubled while the telomere count increased by 33% in the Ogg1-/--cell genomes relative to the WT-cell genomes. We had anticipated more OG in the telomeres than the (5′-GT-3′)n on the basis of our previous experiments;21 however, the total lengths of these repeats in the mouse genome are not yet well understood,22 and telomeres show great variability in length between chromosomes and cells23 that prevents us from making any strong conclusions from these values. Lastly, telomeres are generally exposed to more damage23 likely resulting in further oxidation of OG to hydantoin products21 that would be silent in the present sequencing experiment.
In the next analysis, the genomic regions with peaks of 3-fold enrichment or more were inspected based on the genomic element in which they reside (Figures 2B and 3C), including promoters, 5′-UTRs, 3′-UTRs, genic regions (exons plus introns), and intergenic regions. The data in Figure 3C were normalized with respect to the relative distribution each genomic element has in the mouse genome (Figure S6). First, between the WT- and Ogg1-/--cell genomes, intergenic regions provided fewer peaks than would be predicted if enriched peaks were randomly distributed. This observation is consistent with intergenic regions being protected as heterochromatin to safeguard them from oxidation. Interestingly, promoters, 5′-UTRs, and 3′-UTRs provided greater relative numbers of OG-enriched peaks than expected by a random distribution of the peaks throughout the genome. Additionally, the genomes from Ogg1-/- cells gave more OG-enriched peaks (1.3–1.6×) than the WT cells in these reactive regions. The promoters and UTRs are critical for gene regulation causing them to be the most exposed for regulatory protein interactions. Consequently, the increased exposure of these genomic elements apparently results in their increased levels of G oxidation to OG. The genes found enriched with OG are provided in Tables S1 and S2. Notable examples from these tables include the oncogenes Brca1, c-Kit, Ret, and Palm. The genic regions from both cell lines provided peaks of OG enrichment that were similar in distribution as expected if the peaks were randomly distributed throughout the genome. It is not clear why genic regions were less reactive than the flanking control UTRs, but the importance to maintain a proper coding sequence must cause the cell to guard these regions from oxidation.
A chromosomal-level analysis of the OG-enriched peaks (3-fold enrichment) was then made for the WT and Ogg1-/- genomes (Table 1). First, the number of OG-enriched peaks per chromosome was not dependent on the chromosome length (Table 1). For example, chromosome 10 provided the most OG-enriched peaks from the two cell lines but this chromosome is intermediate in length, and a similar observation occurs with chromosome 15. Next, we looked to see if chromosomes that are richer in genes gave more OG-enriched peaks. Chromosomes possessing a greater density of genes possibly have greater amounts of euchromatin and may be more reactive toward oxidation. For instance, chromosomes 7 and 11 are gene rich but were found to have some of the lowest levels of OG-enriched peaks; thus, greater gene density does not yield greater G oxidation to OG.
Table 1.
Chromosomal-level comparisons of locations of peaks enriched in OG vs. gene density, and percent of 5′-GG-3′ sequences in the reference chromosome vs. peaks of OG enrichment from the WT- and Ogg1-/--MEF cell genomes.
| Chr* | Length (Mbp) | Gene density (genes/Mbp) | Peak Count in WT MEFs | Peak Count in Ogg1-/-MEFs | % 5′-GG-3′ (Ref Chr)* | % 5′-GG-3′ (WT MEF peaks) | %5′-GG-3′ (Ogg1-/- MEF peaks) |
|---|---|---|---|---|---|---|---|
| 1 | 197 | 6.1 | 689 | 657 | 10.1 | 11.1 | 11.6 |
| 2 | 182 | 10.1 | 525 | 199 | 10.6 | 11.3 | 12.9 |
| 3 | 160 | 6.3 | 583 | 1023 | 9.8 | 10.5 | 10.9 |
| 4 | 156 | 8.3 | 445 | 555 | 10.8 | 11.3 | 11.0 |
| 5 | 153 | 7.9 | 689 | 1072 | 10.8 | 12.1 | 12.5 |
| 6 | 150 | 7.8 | 544 | 753 | 10.3 | 11.3 | 11.6 |
| 7 | 153 | 13.1 | 467 | 366 | 11.2 | 11.5 | 11.5 |
| 8 | 132 | 7.9 | 441 | 198 | 10.7 | 11.9 | 13.0 |
| 9 | 124 | 9.9 | 435 | 583 | 10.9 | 11.5 | 11.4 |
| 10 | 130 | 7.6 | 704 | 3393 | 10.3 | 10.8 | 11.9 |
| 11 | 122 | 13.7 | 450 | 302 | 11.5 | 12.1 | 12.9 |
| 12 | 121 | 5.9 | 278 | 154 | 10.5 | 11.0 | 12.0 |
| 13 | 120 | 6.7 | 484 | 937 | 10.3 | 10.8 | 11.1 |
| 14 | 125 | 6.1 | 440 | 1061 | 10.2 | 11.0 | 10.9 |
| 15 | 103 | 7.7 | 599 | 2207 | 10.6 | 11.3 | 12.1 |
| 16 | 98 | 6.8 | 358 | 1111 | 10.0 | 11.0 | 11.7 |
| 17 | 95 | 11.1 | 362 | 665 | 10.9 | 11.7 | 13.1 |
| 18 | 91 | 5.8 | 391 | 676 | 10.2 | 11.1 | 11.4 |
| 19 | 61 | 11.8 | 380 | 1796 | 10.9 | 11.6 | 12.0 |
| X | 167 | 5.6 | 453 | 387 | 9.6 | 10.4 | 11.6 |
| Y | 16 | 0.6 | 0 | 2 | 9.5 | 0.0 | 14.4 |
Chromosome information was derived from the mouse-reference genome NCBI37/mm9.
In vitro oxidations have found the 5′ G in 5′-GG-3′ sequence contexts are more reactive toward oxidation.3,4 Thus, the percentage of 5′-GG-3′ sequences in each chromosome was determined and compared to the enriched peak counts from each chromosome (Table 1). Chromosomes 7 and 11 have the largest percentage of global 5′-GG-3′ sequences; however, these chromosomes did not show greater amounts of OG-enriched peaks. Thus, G content must not define chromosome reactivity toward oxidation. Although, when the OG-enriched peaks were inspected for their percentage of 5′-GG-3′ sequences, we found that the peaks were composed of more of these local reactive sequences than expected if the sequences were randomly selected from the genome (Figure S7). The present results provide genome-level results supporting the many in vitro studies that predicted oxidation of 5′-GG-3′ sequences would dominate in vivo.3-5 Lastly, one hypothesis for this non-random chromosome-level distribution of OG-enriched peaks may reside in the non-random spatial distribution of interphase chromosomes in the nucleus.12 Interphase chromosomes bias regions for interacting with the nuclear envelope causing these regions to be preferentially exposed to more oxidants diffusing into the nucleus, while other regions are protected from oxidation because they are toward the interior of the nucleus.12 The non-random spatial distribution of chromosomes in the nucleus would bias the observed regions of G oxidation.
The OG-enriched peaks were then inspected for G4s because these G-rich sequences should be more prone to oxidation on the basis of our previous studies.21 The analysis found ∼20% of the peaks from WT-MEF genomes and ∼25% of the Ogg1-/--MEF genomes possessed potential G4s. These G4 counts were greater than expected when compared to randomized samples (Figure S8). An increased level of OG enrichment in G4s was also documented by the Gillespie laboratory.10
The present work sequenced OG in the mouse genome via OG-Seq developed in this work. At the heart of this method is the power of chemistry to label OG with BTN for STP enrichment (i.e., AP) while minimizing the structural bias that is a major limitation for IP enrichment protocols (Figure 2A). Enrichment of the fragmented and labeled duplexes by AP followed by release of the complementary strands allowed OG-Seq at 0.15-kb resolution. The method was applied to WT- and Ogg1-/--MEF genomes to find regions of OG enrichment. These regions preferentially reside in promoter and UTR regulatory regions flanking protein-coding sequences (Figure 3C). These genomic elements exist in euchromatin regions that are less protected resulting in greater oxidation of G to OG. Additionally, the OG-enriched peaks harbored more 5′-GG-3′ reactive sequences and G4s than expected by random chance (Table 1 and Figure S7). These findings support many decades of in vitro studies aimed at understanding oxidative damage to cellular DNA.3-5
We further recognize that sequencing of the biotinylated strands would introduce a characteristic mutation at the Sp-BTN nucleotide after polymerase bypass (Figures 1B and 2A). During NGS library preparation, a PCR step is performed. The polymerase bypass of the Sp-BTN adduct would most likely yield a characteristic G→T and G→C mutation signature if these sites are bypassed in the same way as the spiroiminodihydantoin core structure.24 Mining the sequence reads from an NGS experiment for these characteristic mutations would allow single-nucleotide resolution of the OG locations. Critical to the ability to successfully achieve this goal is sequencing at high depth (>30×) to perform proper statistical analysis of the results. Future application of this approach will greatly increase our knowledge surrounding the chemical biology of OG with respect to its disease-causing mutation potential6 and point to possible sites where OG plays an epigenetic-like regulatory role.7-9
Supplementary Material
Acknowledgments
The MEF cell lines were provided by Dr. Tomas Lindahl (Imperial Cancer Research Fund, UK). We thank the University of Utah core facilities for assistance. This work was partially supported by a National Cancer Institute grant (R01 CA090689) and a seed grant from the Nuclear Control Program at Huntsman Cancer Institute at the University of Utah (P30 CA042014).
Footnotes
Supporting Information: The Supporting Information is available free of charge on the ACS Publications website at http://pubs.acs.org. Complete methods, HPLC chromatograms for biotinylation of each sequence context, and NGS data analysis.
Notes: The authors declare no competing financial interests.
References
- 1.Cadet J, Douki T, Ravanat JL. Mut Res. 2011;711:3–12. doi: 10.1016/j.mrfmmm.2011.02.004. [DOI] [PubMed] [Google Scholar]
- 2.Steenken S, Jovanovic SV. J Am Chem Soc. 1997;119:617–618. [Google Scholar]
- 3.Genereux JC, Barton JK. Chem Rev. 2010;110:1642–1662. doi: 10.1021/cr900228f. [DOI] [PMC free article] [PubMed] [Google Scholar]
- 4.Liu Y, Liu Z, Geacintov NE, Shafirovich V. Phys Chem Chem Phys. 2012;14:7400–7410. doi: 10.1039/c2cp40759k. [DOI] [PMC free article] [PubMed] [Google Scholar]
- 5.Fleming AM, Burrows CJ. Free Radic Biol Med. 2016 doi: 10.1016/j.freeradbiomed.2016.11.030. [DOI] [Google Scholar]
- 6.Roberts SA, Gordenin DA. Nat Rev Cancer. 2014;14:786–800. doi: 10.1038/nrc3816. [DOI] [PMC free article] [PubMed] [Google Scholar]
- 7.Fleming AM, Ding Y, Burrows CJ. Proc Natl Acad Sci U S A. 2016 doi: 10.1073/pnas.1619809114. [DOI] [Google Scholar]
- 8.Pan L, Zhu B, Hao W, Zeng X, Vlahopoulos SA, Hazra TK, Hegde ML, Radak Z, Bacsi A, Brasier AR, Ba X, Boldogh I. J Biol Chem. 2016;291:25553–25566. doi: 10.1074/jbc.M116.751453. [DOI] [PMC free article] [PubMed] [Google Scholar]
- 9.Park J, Park JW, Oh H, Maria FS, Kang J, Tian X. PLoS ONE. 2016;11:e0155792. doi: 10.1371/journal.pone.0155792. [DOI] [PMC free article] [PubMed] [Google Scholar]
- 10.Pastukh V, Roberts JT, Clark DW, Bardwell GC, Patel M, Al-Mehdi AB, Borchert GM, Gillespie MN. Am J Physiol Lung Cell Mol Physiol. 2015;309:L1367–1375. doi: 10.1152/ajplung.00236.2015. [DOI] [PMC free article] [PubMed] [Google Scholar]
- 11.Nachtergael A, Belayew A, Duez P. DNA Repair (Amst) 2014;22:147–152. doi: 10.1016/j.dnarep.2014.08.002. [DOI] [PubMed] [Google Scholar]
- 12.Yoshihara M, Jiang L, Akatsuka S, Suyama M, Toyokuni S. DNA Res. 2014;21:603–612. doi: 10.1093/dnares/dsu023. [DOI] [PMC free article] [PubMed] [Google Scholar]
- 13.Ohno M, Miura T, Furuichi M, Tominaga Y, Tsuchimoto D, Sakumi K, Nakabeppu Y. Genome Res. 2006;16:567–575. doi: 10.1101/gr.4769606. [DOI] [PMC free article] [PubMed] [Google Scholar]
- 14.Steenken S, Jovanovic SV, Bietti M, Bernhard K. J Am Chem Soc. 2000;122:2373–2374. [Google Scholar]
- 15.Hosford ME, Muller JG, Burrows CJ. J Am Chem Soc. 2004;126:9540–1. doi: 10.1021/ja047981q. [DOI] [PubMed] [Google Scholar]
- 16.Xue L, Greenberg MM. J Am Chem Soc. 2007;129:7010–7011. doi: 10.1021/ja072174n. [DOI] [PMC free article] [PubMed] [Google Scholar]
- 17.Bajacan JEV, Hong IS, Penning TW, Greenberg MM. Chem Res Toxicol. 2014;27:1227–1235. doi: 10.1021/tx500120p. [DOI] [PMC free article] [PubMed] [Google Scholar]
- 18.Klungland A, Rosewell I, Hollenbach S, Larsen E, Daly G, Epe B, Seeberg E, Lindahl T, Barnes DE. Proc Natl Acad Sci U S A. 1999;96:13300–13305. doi: 10.1073/pnas.96.23.13300. [DOI] [PMC free article] [PubMed] [Google Scholar]
- 19.David SS, O'Shea VL, Kundu S. Nature. 2007;447:941–950. doi: 10.1038/nature05978. [DOI] [PMC free article] [PubMed] [Google Scholar]
- 20.Fleming AM, Armentrout EI, Zhu J, Muller JG, Burrows CJ. J Org Chem. 2015;80:711–721. doi: 10.1021/jo502665p. [DOI] [PMC free article] [PubMed] [Google Scholar]
- 21.Fleming AM, Burrows CJ. Chem Res Toxicol. 2013;26:593–607. doi: 10.1021/tx400028y. [DOI] [PMC free article] [PubMed] [Google Scholar]
- 22.Ellegren H. Nat Rev Genet. 2004;5:435–445. doi: 10.1038/nrg1348. [DOI] [PubMed] [Google Scholar]
- 23.O'Sullivan RJ, Karlseder J. Nat Rev Mol Cell Biol. 2010;11:171–181. doi: 10.1038/nrm2848. [DOI] [PMC free article] [PubMed] [Google Scholar]
- 24.Kornyushyna O, Burrows CJ. Biochemistry. 2003;42:13008–13018. doi: 10.1021/bi0350755. [DOI] [PubMed] [Google Scholar]
Associated Data
This section collects any data citations, data availability statements, or supplementary materials included in this article.