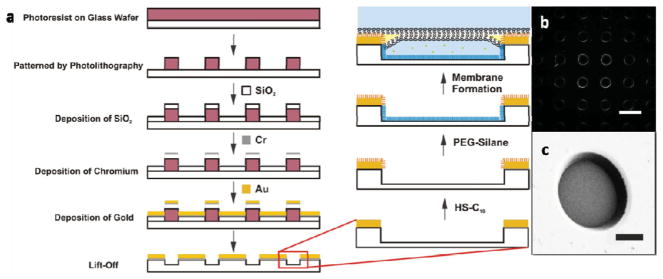
Figure 1.
BLM array fabrication. a) Schematic illustration of the BLM array fabrication and membrane formation process. b) Dark-field image of a BLM array and c) scanning electron microscopy (SEM) image of a single well in the array. Scale bars in (b) and (c): 100 and 25 μm, respectively. PEG = polyethylene glycol.

