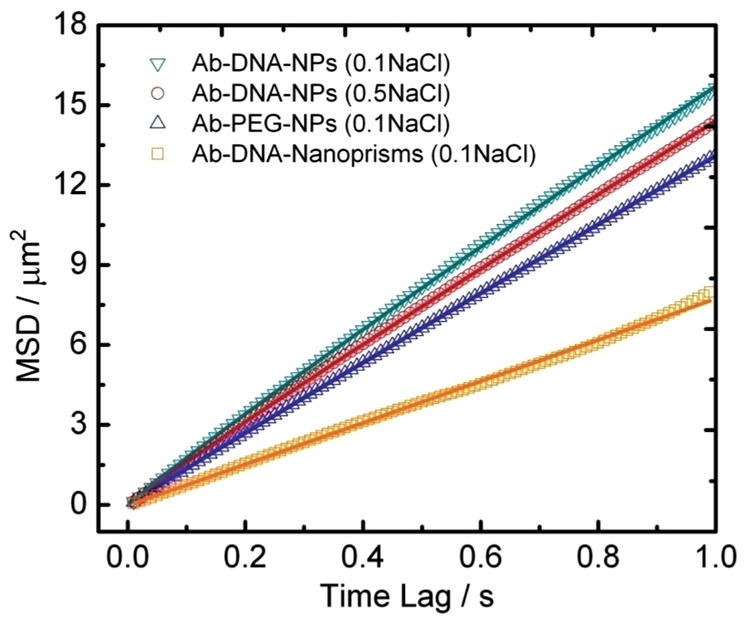
Figure 5.

MSD versus time lag for different NP surfaces. The investigated conditions include: 1) Ab-DNA-NPs in buffer with ionic strength of 0.1 mol L−1 (green triangles); 2) Ab-DNA-NPs in buffer with ionic strength of 0.5 mol L−1 (red circles); 3) Ab-PEG-NPs in buffer with ionic strength of 0.1 mol L−1 (blue triangles); 4) Ab-DNA-nanoprisms in buffer with ionic strength of 0.1 mol L−1.
