Abstract
Response to dexamethasone (DEXA), as a hallmark drug in the treatment of childhood acute lymphoblastic leukemia (ALL), is one of the pivotal prognostic factors in the prediction of outcome in ALL. Identification of predictive markers of chemoresistance is beneficial to selecting of the best therapeutic protocol with the lowest effect adverse. Hence, we aimed to find drug targets using the 2DE/MS proteomics study of a DEXA-resistant cell line (REH) as a model for poor DEXA responding patients before and after drug treatment. Using the proteomic methods, three differentially expressed proteins were detected, including voltage dependent anion channel 1 (VDAC1), sorting Nexin 3 (SNX3), and prefoldin subunit 6 (PFDN6). We observed low expression of three proteins after DEXA treatment in REH cells. We subsequently verified low expression of resulted proteins at the mRNA level using the quantitative PCR method. These proteins are promising proteins because of their important roles in drug resistance and regulation of apoptosis (VDAC1), protein trafficking (SNX3), and protein folding (PFDN6). Additionally, mRNA expression level of these proteins was assessed in 17 bone marrow samples from children with newly diagnosed ALL and 7 non-cancerous samples as controls. The results indicated that independent of the molecular subtypes of leukemia, mRNA expression of VDAC1, SNX3, and PFDN6 decreased in ALL samples compared with non-cancerous samples particularly in VDAC1 (p < 0.001). Additionally, mRNA expression of three proteins was also declined in high-risk samples compared with standard risk cases. These results demonstrated diagnostic and prognostic value of these proteins in childhood ALL. Furthermore, investigation of protein-protein interaction using STRING database indicated that these proteins involved in the signaling pathway of NR3C1 as dexamethasone target. In conclusion, our proteomic study in DEXA resistant leukemic cells revealed VDAC1, SNX3, and PFDN6 are promising proteins that might serve as potential biomarkers of prognosis and chemotherapy in childhood ALL.
Keywords: Acute leukemia lymphoblastic, Dexamethasone, VDAC1, SNX3, PFDN6
Introduction
Notwithstanding, survival rates presently exceed about 80 % in pediatric acute lymphoblastic leukemia, but one-fifth of patients are not cured with current multi-agent treatment protocols (Carroll and Raetz 2012; Cooper and Brown 2015). Treatment in newly diagnosed ALL is ordinarily conducted by glucocorticoid chemotherapy regimens. DEXA, as a glucocorticoid, has cytotoxic effects against hematological cells through activation of the apoptotic processes. A failure response to initial glucocorticoid therapy is associated with unfavorable prognosis and adverse outcome in pediatric ALL (Moricke et al. 2013; Dördelmann et al. 1999).
Diverse responses to treatment in pediatric ALL led to the classification of patients based on risk groups to optimize treatment strategies. Risk-based guidelines in treating could provide differentiated therapeutic protocols in patients for improvement of the final outcome with the lowest adverse effects (Zhou et al. 2012). Risk stratification is estimated based on factors such as initial white blood cells, age, chromosomal aberrations, glucocorticoid response and MRD (minimal residual disease), albeit the identifying of drug resistance biomarkers remains entirely unknown (Delbuono et al. 2008).
Investigation of the patient’s response to therapy by using the multi-color flow cytometry, as a powerful predictor of clinical outcome, has some limitations such as similarities between leukemic and normal cells (phenotypic shifts) in various phases of ALL that may lead to false positivity and also the interpretation of flow cytometry data is completely user-dependently (Jaso et al. 2014). Additionally, dependency of the patient’s response to therapy after completing the initial period of treatment is one of the important limitations. While acquired chemoresistance can be developed during the treatment as a cellular response to drug exposure (Luqmani 2005).
Hence, identifying of chemoresistance biomarker panel, as a supplemental approach which avoids the mentioned limitations, beside the other risk stratification methods can provide more opportunity for a cure. Proteomics-based tools could provide novel insights on the identifying of potentially drug resistance biomarkers to develop the risk-based therapy (Li et al. 2011). From this point of view, the identification of the DEXA resistance biomarkers could potentially predict drug response in ALL relapsed patients. The intention of our study was to detect the specific prognostic biomarkers of pediatric ALL-relapses to be the representative of the poor response in high-risk patients.
Accordingly, we investigated changes in protein expression levels in the REH cell line as a model for poor DEXA responding cases before and after DEXA treatment. For the better understanding of the clinical importance of resulted proteins in the progression of ALL as well as their prognostic value, we examined their mRNA expression in 17 bone marrow samples of ALL patients at diagnosis (10 standard risk and 7 high risk) and 7 normal bone marrow samples.
Materials and methods
Cell culture
Precursor B-ALL cell line, namely REH, was acquired from the Pasteur Institute of Iran. REH cells were grown in RPMI 1640 culture medium supplemented with 10 % FBS, 1 % penicillin-streptomycin.
In vitro drug-resistance assay
The cellular cytotoxicity of dexamethasone (D4902, Sigma) was determined in REH cells by the in vitro MTT assay. Cells at a concentration of 3 × 10⁵ cells/ml were plated in the 96-well plate. REH cells were treated for 48 h with 0, 200, 500 and 1000 nM of dexamethasone.
Annexin-V flow cytometry analysis
The apoptosis induced by dexamethasone were analyzed by PI/Annexin double staining kit (eBioscience) based on the manufacturer’s instructions. REH cells were incubated with 0, 200, 500 and 1000 nM of dexamethasone within 48 h. The rate of whole apoptotic cells was calculated by Annexin-V positive gated cells in comparison with the whole amount of cells gated.
Proteomics analysis
Forty-eight hours after subculture, control and DEXA treated cells (200 nM) were lysed on ice in lysis buffer (7 M urea, 4 % CHAPS, 2 M thiourea, 0.2 % Biolyte 3/10, 50 mM DTT and 40 mM Tris), sonicated for four cycles 15 s and then incubated on ice for 20 min. Lysates were centrifuged at 14000×g at 4 °C for 10 min. Protein concentration was determined using a Bradford method using BSA as a standard. Samples were analyzed by the Protein Chemistry & Proteomics Unit (Pasture Institute of Iran) using 2-DE gel electrophoresis (pH 3–10, 12–15 % gradient). The gels were coomassie blue stained, followed by in-gel digestion of spots expressed exclusively in one of the samples (control or DEXA-treated). The samples were analyzed using MALDI-TOF/TOF-MS and Mascot program for database searching.
RNA extraction and quantitative RT-PCR analysis
We selected bone marrow samples at diagnosis from 17 children with newly diagnosed B-lineage ALL (7 high risk and 10 standard risk) and 7 non-cancerous bone marrow samples who were admitted to Mofid Hospitals (Tehran, Iran). Our study was approved by the Clinical Research Ethics Committees of the Mofid Hospitals, and all samples were collected with informed consent. The patients were divided into two groups contain high-risk and standard-risk based on age, flow-MRD on day 33 and cytogenetic assays. Clinical characteristics of these 17 ALL patients are summarized in Table 1.
Table 1.
Distribution of childhood ALL patients, 10 standard risk patients and 7 high risk patients were involved in this study
| Standard risk n = 10 |
High risk n = 7 |
|
|---|---|---|
| Gender | ||
| Male | 7 | 5 |
| Female | 3 | 2 |
| Age at diagnosis | ||
| <1 year | 0 | 0 |
| 1–9 years | 10 | 5 |
| ≥10 years | 0 | 2 |
| Chromosome translocation | ||
| Non-detected | 8 | 5 |
| ETV6-RUNX1 | 1 | 0 |
| BCR-ABL | 0 | 0 |
| Down syndrome | 0 | 1 |
| Hypodiploidy | 0 | 1 |
| Hyperdiploidy | 1 | 0 |
| Flow-MRD at day 33 | ||
| <0.1 | 10 | 0 |
| ≥0.1 | 0 | 7 |
| Status | ||
| Complete remission | 10 | 4 |
| Relapsed | 0 | 1 |
| Induction failure | 0 | 1 |
| Died | 0 | 1 |
Briefly, mononuclear cells were separated and harvested from bone marrow aspirates using Ficoll-Paque density gradient centrifugation. Total RNA was extracted from the cells using the total RNA isolation solution (GeneAll, Korea) and the cDNA was synthesized using a RevertAid H Minus First Strand cDNA synthesis kit (Fermentas, USA), according to the manufacturer’s instructions and stored at −20 °C. Quantitative real-time PCR was performed with the SYBR Green PCR master mix 2× (Takara, Japan) using a Rotor gene 6000 instrument (Corbett, Germany). ABL was used as an internal control to normalize differences in the amount of total RNA in each sample. Relative expression level was estimated by the Pfaffl method (Pfaffl 2001). The primers are listed in Table 2.
Table 2.
Quantitative real-time Polymerase chain reaction primers
| Name | Sequence |
|---|---|
| ABL-Forward | 5′-CTTCTTGGTGCGTGAGAGTGAG-3′ |
| ABL-Reverse | 5′-GACGTAGAGCTTGCCATCAGAAG-3′ |
| VDAC1-Forward | 5′-CGGTGCACACGTCAGTCC-3′ |
| VDAC1-Reverse | 5′-GCCAAGATCGGCATACGTGG-3′ |
| SNX3-Forward | 5′-GCTCCCTGGGAAAGCGT-3′ |
| SNX3-Reverse | 5′- GGATGACCAGCGACCTTGTTTA-3′ |
| PFDN6-Forward | 5′-GAGAAATATCAACAGCTACAGAAGGACTTA-3′ |
| PFDN6-Reverse | 5′-GGCCAGTTCCTCTTTCACGATATT-3′ |
Results
REH cell line displayed resistance to dexamethasone treatment
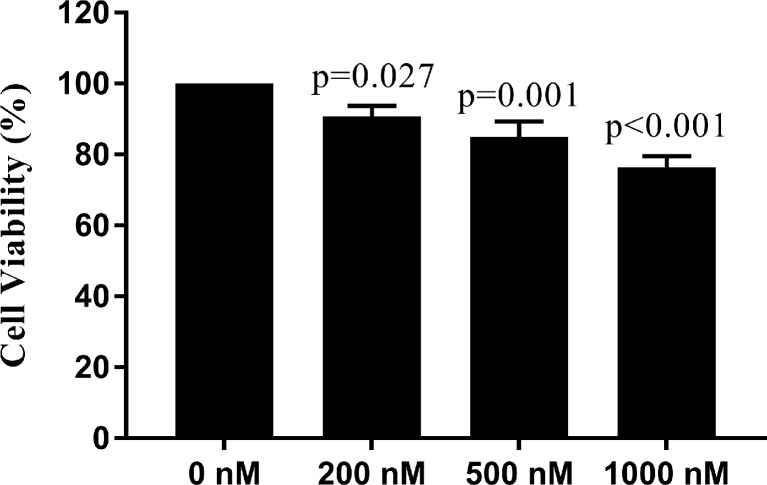
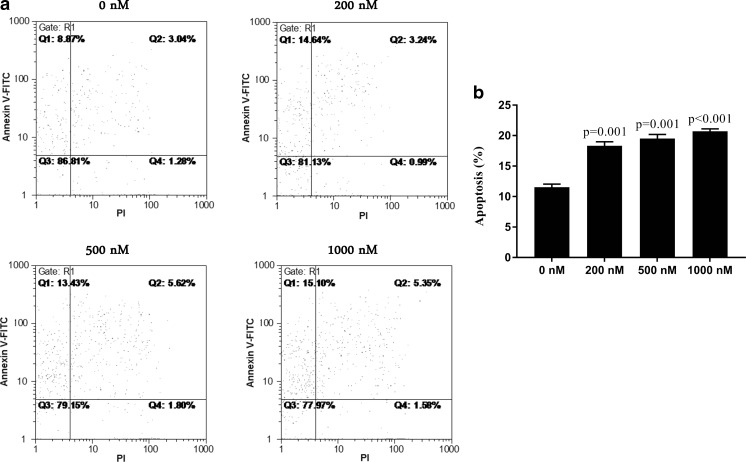
MTT results showed REH cells are resistant to dexamethasone treatment with approximately 77 % of cells survived at the concentration of 1000 nM and 48 h time point (Fig. 1). In addition, investigation of apoptosis by annexin-V flow cytometric assay indicated the apoptosis rate of dexamethasone-treated REH cells is about 20 % in 1000 nM dexamethasone (Fig. 2). Taken together, the results showed that dexamethasone has no significant effect on cell proliferation and apoptosis of REH cells. Finally, we selected 200 nM final concentration of DEXA for performing remained experiments. In addition, sensitivity to concentration of 200 nM DEXA was confirmed in NALM-6 cells as DEXA sensitive cells. Related results are available upon request.
Fig. 1.
Cytotoxicity of dexamethasone in REH cells were determined by MTT assay. The cell viability after dexamethasone treatment at concentrations of 0, 200, 500 and 1000 nM for 48 h were shown. One-way analysis of variance followed by Dunnett’s post hoc test was used for statistical analysis. Data are shown as means ± SE, n = 3
Fig. 2.
The effect of dexamethasone on the apoptosis induction in REH cells by annexin V-FITC/PI double–staining analysis. FCM images (a) and quantitative data (b) of REH cells exposed to 0, 200, 500 and 1000 nM dexamethasone for 48 h. One-way analysis of variance followed by Dunnett’s post hoc test was used for statistical analysis. Data are shown as means ± SE, n = 2
2-DE profiling of proteins from DEXA-treated and untreated REH cells
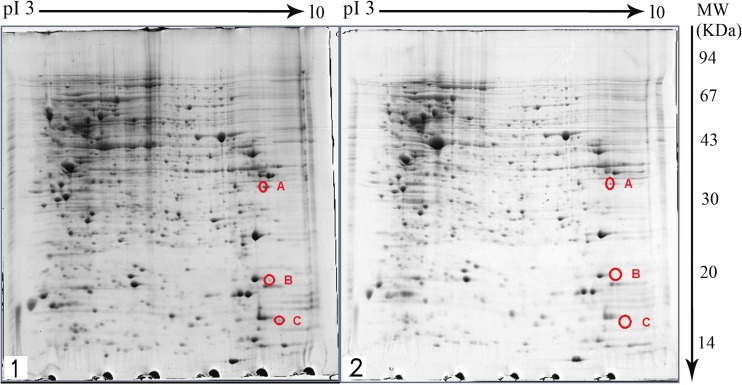
The gels obtained from two-dimensional gel electrophoresis of DEXA-treated and untreated (control) REH cell proteins were compared (Fig. 3). In these gels more than 600 protein spots could be observed. Three proteins were revealed to have undergone a change in expression following treatment with 200 nM DEXA for 48 h. These three proteins had a decreased expression in DEXA-treated samples compared with non-treated cells.
Fig. 3.
2DE gels of the non-treated REH cell (1) and DEXA-treated REH cell (2) that stained with coomassie blue on 17 cm IPG strips with a pH range of 3–10 and SDS-PAGE 12–15 %. The altered spots are shown A: VDAC1, B: SNX3 and C: PFDN6
Protein identification by MALDI-TOF/TOF MS
Identification of spots by using MALDI-TOF/TOF and database searching led to the detection of three novel biomarkers namely, voltage dependent anion channel 1 (VDAC1), sorting nexin 3 (SNX3) and prefoldin subunit 6 (PFDN6). The identified proteins and their Uniprot code, Mascot score, and fold change is shown in Table 3.
Table 3.
Differentially expressed proteins in non-treated and dexamethasone-treated samples of dexamethasone-resistant REH cells
Validation of the identified potential markers in REH cell line at mRNA expression level
Quantitative RT-PCR analysis indicated mRNA expression level of VDAC1, SNX3 and PFDN6 decreased after DEXA treatment in REH cells, suggesting that expression of the identified protein markers is closely associated with the mRNA expression level (Fig. 4).
Fig. 4.
The mRNA expression levels of VDAC1, SNX3 and PFDN6 in the DEXA-treated and untreated samples of REH cells. The p-values between control and treated cells were calculated with t-test. Data are shown as means ± SE, n = 3
Low expression of VDAC1, SNX3 and PFDN6 in ALL patient’s bone marrow samples
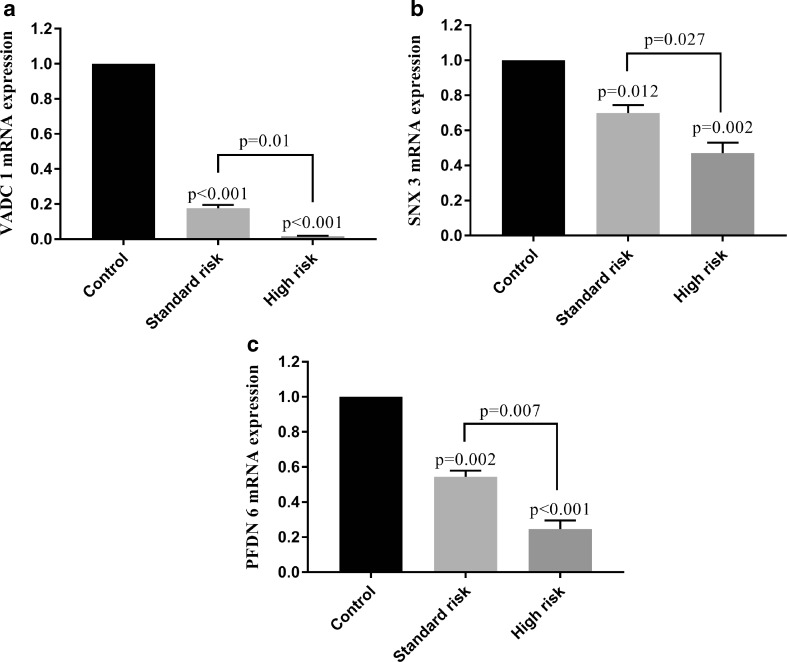
Q-PCR results indicated the lower expression levels of VDAC1, SNX3 and PFDN6 in ALL samples compared with normal samples. Additionally, mRNA expression levels of VDAC1, SNX3 and PFDN6 significantly differed in standard-risk samples in compared with high-risk samples. Indeed, the weaker expression levels of proteins were observed in high-risk compared with standard-risk samples (Fig. 5). These results indicate the clinical significance and the prognostic and diagnostic value of these differentially expressed proteins.
Fig. 5.
The diagnostic and prognostic significance of VDAC1, SNX3 and PFDN6 in the 17 ALL patients (10 standard risk and 7 high risk samples) and 7 non-cancerous bone marrow samples. One-way analysis of variance followed by Tukey’s post hoc test was used for statistical analysis. Data are shown as means ± SE, n = 3
Discussion
Dexamethasone is the most commonly used chemotherapeutic drugs in inducing remission in ALL patients. Resistance to chemotherapy is one of the significant elements in the failure treatment of pediatric ALL (Inaba and Pui 2010). Identification of drug resistance markers is helpful for selecting of an appropriate therapy protocol before initial treatment. Hence, new etiologic studies will be useful to investigate novel diagnostic and prognostic tools for ALL. Comparative proteomics is expanding for the identifying of differentially expressed proteins related to chemoresistance (Li et al. 2011). However, the mechanisms and roles of these biomarkers in chemoresistance required to be further demonstrated, but some of identified proteins may be beneficial to prediction of chemotherapeutic feedback.
Nevertheless, we used a proteomics approach to recognizing the differences in the proteome of DEAX-resistant cell line before and after DEXA treatment. Indeed, we focused on the candidate proteins from the DEXA-resistant REH cell line, as a model of ETV6/RUNX1, that induces the most frequent fusion oncogene in B-ALL (Jin et al. 2016). Overall, protein identification using MALDI-TOF/TOF mass spectrometry showed that three proteins VDAC1, SNX3, and PFDN6 were differentially expressed after DEXA treatment in DEXA-resistant REH cell line (p < 0.05).
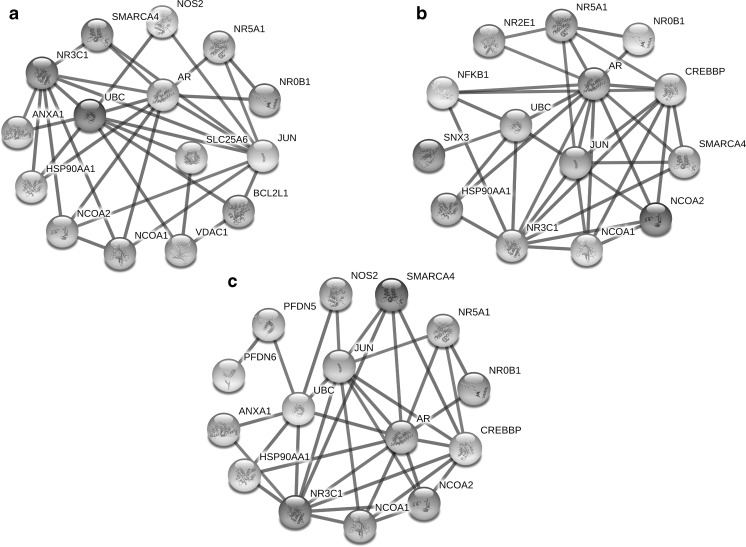
Unlike VDAC1 that its prognostic role has been shown in ALL, the proteins of SNX3 and PFDN6 were found for the first time to be associated with ALL (Admoni-Elisha et al. 2016; Jiang et al. 2011). VDAC1, as a gatekeeper in the outer mitochondrial membrane, has the pivotal functions in cancer cells through the management of anti/pro-apoptotic proteins during intrinsic apoptosis (Shoshan-Barmatz et al. 2015). Current evidence has demonstrated the participating of VDAC1 in drug resistance, carcinogenesis, cell metabolism and apoptosis (Shoshan-Barmatz et al. 2015; Wang et al. 2016). Low expression VDAC1 induces a non-apoptotic role and high expression VDAC1 occurs following apoptosis induction by chemotherapeutic agents (Arif et al. 2016). Up-regulation of VDAC1 was reported subsequent prednisolone treatment in sensitive-ALL cells but not in resistant cells (Jiang et al. 2011). Our results indicated low expression of VDAC1 after drug treatment in REH resistance cells, suggesting DEXA couldn’t induce high expression VDAC1 and following that couldn’t induce apoptosis due to resistance of cells to the drug. Furthermore, protein-protein interaction using the STRING database indicated BCL2-VDAC1-UBC-NR3C1 interaction, that is therefore indicative of interaction VDAC1 to apoptosis-regulating proteins and also dexamethasone targets (Fig. 6a). Totally, the significant relationship exists between low levels of VDAC1 expression and DEXA resistance. These findings suggest the investigation of over-expression VDAC1 as a mechanism for inducing apoptosis in DEXA resistance researches.
Fig. 6.
In silico analysis of protein interaction VDAC1 (a), SNX3 (b) and PFDN6 (c) with protein targets of dexamethasone, including NR3C1, NR0B1, ANXA1 and NOS2. Protein interactions were scanned from the STRING database (http://string-db.org/) with highest confidence (0.900) and 10 interactors
Other differentially expressed protein, namely SNX3, a member of SNX family, regulates various functions in endocytic processes and protein trafficking (Overduin et al. 2015). Sorting nexins as PI3P-binding proteins actively determine cell fate through diverse functions in cell signalling, protein-protein/lipid interaction, organelle movement, receptor downregulation and membrane trafficking (Chen et al. 2013; Nguyen et al. 2006; Danson et al. 2013; Pons et al. 2012). It is well demonstrated that abnormalities of intracellular vesicles in endosome network occur in many tumor cells (Ara et al. 2012). Also, dysfunctions of sorting proteins can alter cell surface receptors and signalling cascades in cells and can eventually cause of induction of tumorogenesis. It has been shown SNX1-EGFR interaction developed gefitinib-resistant in lung cancer cell lines by negative regulation of EGFR trafficking (Nishimura et al. 2014). In this respect, our results indicated low expression of SNX3 in ALL samples in compared with normal samples. In addition, we observed a marked decrease of SNX3 in high risk groups of patients than low risk. These findings suggested low expression of SNX3 in addition to the tumorigenesis can also cause of chemoresistance. Previous studies reported that NR2E1 is the closest gene to SNX3 and therefore they may be influenced together (Kumar et al. 2007). Protein-protein interaction SNX3 and NR2E1 indicated their correlations with NR3C1 and NR0B1 as dexamethasone targets (Fig. 6b). NR2E1, NR3C1 and NR0B1 are probably regulated by the sorting function of SNX3 and therefore this protein can be a potential candidate of inducing resistance in this pathway. Collectively, further investigations need to fully understand the functional significance of the SNX3-NR3C1-NR0B1-NR2E1 pathway in the tumorigenesis of ALL.
The last identified protein, namely PFDN6 protein, prefoldin 6, belongs to the prefoldin family and is a β-like subunit of the hetero-hexameric chaperone protein (Millan-Zambrano and Chavez 2014; Zhang et al. 2016). Prefoldin is involved in the functions such as protein folding, cytoskeletal remodelling, tubulin function in mitosis and regulation of the cell cycle (Miyoshi et al. 2010). Although, Some reports have shown the correlation of prefoldin to some cancers such as breast and colorectal cancers (Wang et al. 2015; Lipinski et al. 2016), but its significance in ALL has not been fully understood yet. A previous study reported that PFDN1 deficiency influences dysfunction of lymphocyte development included the marked reduction in pre-B cells in the bone marrow (Cao et al. 2008). Also, it has been reported PFDN6 expression level dramatically correlates with lymphocyte activation (Millan-Zambrano and Chavez 2014). Additionally, STRING analysis indicated downstream targets of PFDN6-dependent pathway, including PFDN6-PFDN5-UBC-HSP90-NR3C1, that might be involved in the development of ALL through the prefoldin dysfunction (Fig. 6c). Hence, the present study elucidated that low PFDN6 expression can be a statistically significant poor prognosis factor and this protein potentially could be involved in tumorigenesis of ALL.
In conclusion, the comparison of proteomics and real-time q-PCR results indicated that there was no significant difference in the protein and mRNA expression levels of VDAC1, SNX3 and PFDN6 after DEXA treatment of REH cells. Subsequently, we assessed the mRNA expression levels of VDAC1, SNX3 and PFDN6 using the real-time q-PCR between cancer and non-cancerous samples, and we observed statistically significant low expression of VDAC1, SNX3 and PFDN6 in ALL samples particularly in high risk cases. Overall, the present study is the first to show VDAC1, SNX3 and PFDN6 to be potentially significant predictive markers for ALL prognosis. These findings may help to improve dexamethasone treatment strategies in patients with ALL and may be useful for GC resistance research and ALL drug development.
Acknowledgments
The authors would like to thank the Shahid Beheshti University of Medical Sciences for supporting of this research and also Pasteur Institute of Iran for technical assistance.
Abbreviations
- ER
ETV6/RUNX1
- GC
Glucocorticoid
- ALL
Acute lymphoblastic leukemia
- DEXA
Dexamethasone
- VDAC1
Voltage dependent anion channel 1
- SNX3
Sorting Nexin 3
- PFDN6
Prefoldin subunit 6
- PPI
Protein-protein interaction
- 2-DE
Two-dimensional gel electrophoresis
- MS
Mass spectrometry
- PIP3
Phosphatidylinositol (3,4,5)-trisphosphate
- FCM
Flow cytometry
Compliance with ethical standards
Competing interests
The authors declare no competing financial interest.
Informed consent
Informed consent was obtained from all individual participants included in the study.
Contributor Information
Ahmad Gharehbaghian, Phone: (+98-21) 22721150, Email: gharehbaghian@sbmu.ac.ir.
Kourosh Goudarzi Pour, Phone: (+98-21) 22227029, Email: K.goudarzipour@sbmu.ac.ir.
References
- Admoni-Elisha L, Nakdimon I, Shteinfer A, Prezma T, Arif T, Arbel N, Melkov A, Zelichov O, Levi I, Shoshan-Barmatz V. Novel biomarker proteins in chronic lymphocytic leukemia: impact on diagnosis, prognosis and treatment. PLoS One. 2016;11 doi: 10.1371/journal.pone.0148500. [DOI] [PMC free article] [PubMed] [Google Scholar]
- Ara S, Kikuchi T, Matsumiya H, Kojima T, Kubo T, Ye RC, Sato A, Kon S-I, Honma T, Asakura K, et al. Sorting nexin 5 of a new diagnostic marker of papillary thyroid carcinoma regulates Caspase-2. Cancer Sci. 2012;103:1356–1362. doi: 10.1111/j.1349-7006.2012.02296.x. [DOI] [PMC free article] [PubMed] [Google Scholar]
- Arif T, Krelin Y, Shoshan-Barmatz V. Reducing VDAC1 expression induces a non-apoptotic role for pro-apoptotic proteins in cancer cell differentiation. Biochim Biophys Acta. 2016;1857:1228–1242. doi: 10.1016/j.bbabio.2016.04.005. [DOI] [PubMed] [Google Scholar]
- Cao S, Carlesso G, Osipovich AB, Llanes J, Lin Q, Hoek KL, Khan WN, Ruley HE. Subunit 1 of the prefoldin chaperone complex is required for lymphocyte development and function. J Immunol. 2008;181:476–484. doi: 10.4049/jimmunol.181.1.476. [DOI] [PubMed] [Google Scholar]
- Carroll WL, Raetz EA. Clinical and laboratory biology of childhood acute lymphoblastic leukemia. J Pediatr. 2012;160:10–18. doi: 10.1016/j.jpeds.2011.08.006. [DOI] [PubMed] [Google Scholar]
- Chen C, Garcia-Santos D, Ishikawa Y, Seguin A, Li L, Fegan KH, Hildick-Smith GJ, Shah DI, Cooney JD, Chen W, et al. Snx3 regulates recycling of the transferrin receptor and iron assimilation. Cell Metab. 2013;17:343–352. doi: 10.1016/j.cmet.2013.01.013. [DOI] [PMC free article] [PubMed] [Google Scholar]
- Cooper SL, Brown PA. Treatment of pediatric acute lymphoblastic leukemia. Pediatr Clin N Am. 2015;62:61–73. doi: 10.1016/j.pcl.2014.09.006. [DOI] [PMC free article] [PubMed] [Google Scholar]
- Danson C, Brown E, Hemmings OJ, McGough IJ, Yarwood S, Heesom KJ, Carlton JG, Martin-Serrano J, May MT, Verkade P, et al. SNX15 links clathrin endocytosis to the PtdIns3P early endosome independently of the APPL1 endosome. J Cell Sci. 2013;126:4885–4899. doi: 10.1242/jcs.125732. [DOI] [PMC free article] [PubMed] [Google Scholar]
- Delbuono E, Maekawa YH, Latorre MRDO, Seber A, Petrilli AS, Braga JAP, Lee MLM. Simplified flow cytometric assay to detect minimal residual disease in childhood with acute lymphoblastic leukemia. Rev Bras Hematol Hemoter. 2008;30:281–286. doi: 10.1590/S1516-84842008000400010. [DOI] [Google Scholar]
- Dördelmann M, Reiter A, Borkhardt A, Ludwig WD, Götz N, Viehmann S, Gadner H, Riehm H, Schrappe M. Prednisone response is the strongest predictor of treatment outcome in infant acute lymphoblastic leukemia. Blood. 1999;94:1209–1217. [PubMed] [Google Scholar]
- Inaba H, Pui C-H. Glucocorticoid use in acute lymphoblastic leukaemia. Lancet Oncol. 2010;11:1096–1106. doi: 10.1016/S1470-2045(10)70114-5. [DOI] [PMC free article] [PubMed] [Google Scholar]
- Jaso JM, Wang SA, Jorgensen JL, Lin P. Multi-color flow cytometric immunophenotyping for detection of minimal residual disease in AML: past, present and future. Bone Marrow Transplant. 2014;49:1129–1138. doi: 10.1038/bmt.2014.99. [DOI] [PubMed] [Google Scholar]
- Jiang N, Kham SKY, Koh GS, Suang Lim JY, Ariffin H, Chew FT, Yeoh AEJ. Identification of prognostic protein biomarkers in childhood acute lymphoblastic leukemia (ALL) J Proteome. 2011;74:843–857. doi: 10.1016/j.jprot.2011.02.034. [DOI] [PubMed] [Google Scholar]
- Jin Y, Wang X, Hu S, Tang J, Li B, Chai Y. Determination of ETV6-RUNX1 genomic breakpoint by next-generation sequencing. Cancer Med. 2016;5:337–351. doi: 10.1002/cam4.579. [DOI] [PMC free article] [PubMed] [Google Scholar]
- Kumar RA, Everman DB, Morgan CT, Slavotinek A, Schwartz CE, Simpson EM. Absence of mutations in NR2E1 and SNX3 in five patients with MMEP (microcephaly, microphthalmia, ectrodactyly, and prognathism) and related phenotypes. BMC Med Genet. 2007;8:48. doi: 10.1186/1471-2350-8-48. [DOI] [PMC free article] [PubMed] [Google Scholar]
- Li X-H, Li C, Xiao Z-Q. Proteomics for identifying mechanisms and biomarkers of drug resistance in cancer. J Proteome. 2011;74:2642–2649. doi: 10.1016/j.jprot.2011.09.004. [DOI] [PubMed] [Google Scholar]
- Lipinski KA, Britschgi C, Schrader K, Christinat Y, Frischknecht L, Krek W. Colorectal cancer cells display chaperone dependency for the unconventional prefoldin URI1. Oncotarget. 2016;7:29635–29647. doi: 10.18632/oncotarget.8816. [DOI] [PMC free article] [PubMed] [Google Scholar]
- Luqmani YA. Mechanisms of drug resistance in cancer chemotherapy. Med Princ Pract. 2005;14(Suppl 1):35–48. doi: 10.1159/000086183. [DOI] [PubMed] [Google Scholar]
- Millan-Zambrano G, Chavez S. Nuclear functions of prefoldin. Open Biol. 2014;4:140085. doi: 10.1098/rsob.140085. [DOI] [PMC free article] [PubMed] [Google Scholar]
- Miyoshi N, Ishii H, Mimori K, Nishida N, Tokuoka M, Akita H, Sekimoto M, Doki Y, Mori M. Abnormal expression of PFDN4 in colorectal cancer: a novel marker for prognosis. Ann Surg Oncol. 2010;17:3030–3036. doi: 10.1245/s10434-010-1138-5. [DOI] [PubMed] [Google Scholar]
- Moricke A, Lauten M, Beier R, Odenwald E, Stanulla M, Zimmermann M, Attarbaschi A, Niggli F, Schrappe M. Prediction of outcome by early response in childhood acute lymphoblastic leukemia. Klin Padiatr. 2013;225(Suppl 1):S50–S56. doi: 10.1055/s-0033-1337964. [DOI] [PubMed] [Google Scholar]
- Nguyen LN, Holdren MS, Nguyen AP, Furuya MH, Bianchini M, Levy E, Mordoh J, Liu A, Guncay GD, Campbell JS, et al. Sorting nexin 1 down-regulation promotes colon tumorigenesis. Clin Cancer Res. 2006;12:6952–6959. doi: 10.1158/1078-0432.CCR-06-0317. [DOI] [PubMed] [Google Scholar]
- Nishimura Y, Takiguchi S, Ito S, Itoh K. Evidence that depletion of the sorting nexin 1 by siRNA promotes HGF-induced MET endocytosis and MET phosphorylation in a gefitinib-resistant human lung cancer cell line. Int J Oncol. 2014;44:412–426. doi: 10.3892/ijo.2013.2194. [DOI] [PubMed] [Google Scholar]
- Overduin M, Rajesh S, Gruenberg J, Lenoir M. Secondary structure and (1)H, (13)C, (15)N resonance assignments of the endosomal sorting protein sorting nexin 3. Biomol NMR Assign. 2015;9:355–358. doi: 10.1007/s12104-015-9609-z. [DOI] [PMC free article] [PubMed] [Google Scholar]
- Pfaffl MW. A new mathematical model for relative quantification in real-time RT-PCR. Nucleic Acids Res. 2001;29 doi: 10.1093/nar/29.9.e45. [DOI] [PMC free article] [PubMed] [Google Scholar]
- Pons V, Ustunel C, Rolland C, Torti E, Parton RG, Gruenberg J. SNX12 role in endosome membrane transport. PLoS One. 2012;7 doi: 10.1371/journal.pone.0038949. [DOI] [PMC free article] [PubMed] [Google Scholar]
- Shoshan-Barmatz V, Ben-Hail D, Admoni L, Krelin Y, Tripathi SS. The mitochondrial voltage-dependent anion channel 1 in tumor cells. Biochim Biophys Acta. 2015;1848:2547–2575. doi: 10.1016/j.bbamem.2014.10.040. [DOI] [PubMed] [Google Scholar]
- Wang P, Zhao J, Yang X, Guan S, Feng H, Han D, Lu J, Ou B, Jin R, Sun J, et al. PFDN1, an indicator for colorectal cancer prognosis, enhances tumor cell proliferation and motility through cytoskeletal reorganization. Med Oncol. 2015;32:264. doi: 10.1007/s12032-015-0710-z. [DOI] [PubMed] [Google Scholar]
- Wang F, Qiang Y, Zhu L, Jiang Y, Wang Y, Shao X, Yin L, Chen J, Chen Z. MicroRNA-7 downregulates the oncogene VDAC1 to influence hepatocellular carcinoma proliferation and metastasis. Tumour Biol. 2016;37:10235–10246. doi: 10.1007/s13277-016-4836-1. [DOI] [PubMed] [Google Scholar]
- Zhang Y, Rai M, Wang C, Gonzalez C, Wang H. Prefoldin and Pins synergistically regulate asymmetric division and suppress dedifferentiation. Sci Rep. 2016;6:23735. doi: 10.1038/srep23735. [DOI] [PMC free article] [PubMed] [Google Scholar]
- Zhou Y, You MJ, Young KH, Lin P, Lu G, Medeiros LJ, Bueso-Ramos CE. Advances in the molecular pathobiology of B-lymphoblastic leukemia. Hum Pathol. 2012;43:1347–1362. doi: 10.1016/j.humpath.2012.02.004. [DOI] [PubMed] [Google Scholar]


