

ABSTRACT
The mRNA-destabilizing factor tristetraprolin (TTP) binds in a sequence-specific manner to the 3′ untranslated regions of many proinflammatory mRNAs and recruits complexes of nucleases to promote rapid mRNA turnover. Mice lacking TTP develop a severe, spontaneous inflammatory syndrome characterized by the overexpression of tumor necrosis factor and other inflammatory mediators. However, TTP also employs the same mechanism to inhibit the expression of the potent anti-inflammatory cytokine interleukin 10 (IL-10). Perturbation of TTP function may therefore have mixed effects on inflammatory responses, either increasing or decreasing the expression of proinflammatory factors via direct or indirect mechanisms. We recently described a knock-in mouse strain in which the substitution of 2 amino acids of the endogenous TTP protein renders it constitutively active as an mRNA-destabilizing factor. Here we investigate the impact on the IL-10-mediated anti-inflammatory response. It is shown that the gain-of-function mutation of TTP impairs IL-10-mediated negative feedback control of macrophage function in vitro. However, the in vivo effects of TTP mutation are uniformly anti-inflammatory despite the decreased expression of IL-10.
KEYWORDS: dual-specificity phosphatase 1, inflammation, macrophages, posttranscriptional RNA-binding proteins, tristetraprolin
INTRODUCTION
Macrophages are at the forefront of innate immune-mediated defenses against infectious pathogens. They are equipped with several pattern recognition receptors (PRRs) with which they detect pathogen-associated molecular patterns (PAMPs) common to different classes of microbes, for example, lipopolysaccharide (LPS), a component of the cell wall of Gram-negative bacteria (1, 2). The engagement of macrophage PRRs initiates very rapid changes of gene expression in order to mobilize antimicrobial effectors, recruit and/or activate other cells of the innate and acquired immune systems, amplify danger signals, and coordinate effective cellular responses. Excessive responses of macrophages to the engagement of PRRs is potentially harmful, in the worst case leading to systemic organ failure and death. It is therefore unsurprising that macrophage activation by PAMPs is regulated by complex networks of positive and negative feedback mechanisms that together ensure rapid but proportional and temporally limited proinflammatory responses (3–7).
One important feedback mechanism involves the secretion of the anti-inflammatory cytokine interleukin 10 (IL-10). Particularly in tissues like those of the gut, which are continuously exposed to PAMPs, IL-10 is essential for restraining inflammatory responses to commensal microorganisms (8, 9). One critical function of IL-10 is the suppression of the Il12b gene, which codes for the shared p40 subunit of the cytokines IL-12 and IL-23. The constraint of IL-12 and IL-23 expression is required to prevent excessive Th1- and Th17-mediated intestinal inflammation (10–13). Macrophage-specific knockout of the IL-10 receptor (IL-10R) results in severe spontaneous gut inflammation (14, 15). Similarly, polymorphisms in the human IL-10–IL-10R axis are associated with susceptibility to inflammatory bowel disease (16). The anti-inflammatory actions of IL-10 are mediated by the transcription factor STAT3 (signal transducer and activator of transcription 3), which is phosphorylated and activated by the tyrosine kinases JAK1 and TYK2 upon the engagement of the IL-10 receptor. A number of STAT3-regulated target genes have been implicated as mediators of anti-inflammatory functions of IL-10 (6, 17–19). The other side of the coin is that increased expression of IL-10 may contribute to pathogenesis, for example, by impairing antitumor immunity (20). Several viruses express IL-10 orthologues, apparently as a means of evasion of the innate immune system (21). The expression of endogenous IL-10 is tightly regulated by different mechanisms in several cell types that can express this anti-inflammatory cytokine (22, 23).
Much is known about how transcription factors regulate the complex programs of gene expression in activated macrophages (3, 24–27). It is often overlooked that the dynamic regulation of mRNA stability also plays an important role (28, 29). Many inflammatory mediator mRNAs have adenosine/uridine-rich elements (AREs) in their 3′ untranslated regions, which act as binding sites for various RNA-destabilizing factors, the best characterized of which is tristetraprolin (TTP) (30, 31). TTP promotes the rapid turnover of its substrate transcripts by recruiting a number of nuclease complexes, notably the CCR4/NOT complex, which mediates poly(A) tail shortening, the rate-limiting step in the degradation of most mRNA species. In resting macrophages, TTP is expressed at very low levels. Its upregulation in response to proinflammatory stimuli constitutes a negative feedback mechanism to limit the duration and strength of inflammatory gene expression (30–32). Myeloid cell-specific disruption of the TTP gene (formally known as Zfp36) causes extreme sensitivity to lethal endotoxic shock, although there is no evident phenotype in the absence of inflammatory challenge (33, 34). In contrast, global disruption of the Zfp36 gene causes a spontaneous and severe inflammatory syndrome with some features of rheumatoid arthritis (35). Tnf was the first mRNA shown to be posttranscriptionally regulated by TTP, and dysregulation of tumor necrosis factor (TNF) expression plays an important role in both myeloid cell-specific and global Zfp36 knockout phenotypes (33–36). Nevertheless, it is clear that very many additional targets exist and are dysregulated in cells lacking TTP (30, 37, 38). Puzzlingly, IL-10 was identified as a target of posttranscriptional regulation by TTP, which was overexpressed by Zfp36−/− macrophages (38–41). Enhanced IL-10-mediated negative feedback in Zfp36−/− cells resulted in the paradoxical underexpression of IL-6, IL-12, and IL-23 (39, 41).
The mitogen-activated protein kinase (MAPK) p38 signaling pathway controls the expression of inflammatory mediators via the phosphorylation and inactivation of TTP (42, 43). Hence, MAPK p38 inhibitors decrease the expression levels of several proinflammatory mediators and destabilize the corresponding mRNAs in Zfp36+/+ but not Zfp36−/− macrophages (41, 44). The critical phosphorylations, at serine 52 and serine 178 of murine TTP, are carried out by MAPK-activated protein kinase 2 (MK2), which is downstream of the MAPK p38 itself (43, 45–47). They result in the recruitment of 14-3-3 proteins, the disruption of the interaction between TTP and the CCR4/NOT complex, and the consequent protection of the target transcript's poly(A) tail (46, 48–50). The coupling between MAPK p38 signaling and TTP activity contributes to the precise timing of gene expression in activated macrophages (33, 38). Prolonged MAPK p38 activation in macrophages lacking the MAPK phosphatase dual-specificity phosphatase 1 (DUSP1) promotes the overexpression of several inflammatory mediators in vitro and in vivo, causing exaggerated responses to experimental challenges such as LPS injection (5, 51). To a large extent, this dysregulated inflammatory response is caused by the increased phosphorylation and inactivation of TTP, the increased stability of proinflammatory mRNAs, and a delay to the off phase of gene expression (52).
We recently used homologous recombination to generate a knock-in mouse strain in which Ser52 and Ser178 of the endogenous TTP protein are replaced with nonphosphorylatable alanine residues (53). The mutated Zfp36 locus is known as Zfp36aa, and its protein product is known as TTPaa. Since it cannot be inactivated by the MAPK p38 pathway, TTPaa is a constitutive, dominant mRNA-destabilizing protein. Its expression protects mice from harmful consequences of systemic LPS injection (53), experimental inflammatory arthritis (54), and inflammatory lung pathologies (43). Differential gene expression was assessed by microarray analysis of Zfp36aa/aa macrophages, which express the alanine-substituted mutant form of TTP from the endogenous Zfp36 locus (52, 53). Several known TTP target mRNAs, such as F3, Tnf, Cxcl1, Cxcl2, Ier3, and Il10, were underexpressed by Zfp36aa/aa macrophages, and some putative novel TTP targets were identified.
We and others have discussed the possibility of therapeutic targeting of TTP in order to exert anti-inflammatory effects (31, 43). A proof of principle was generated by the treatment of experimental arthritis using two compounds that promote PP2A-mediated dephosphorylation and activation of TTP (54). A significant concern is that altering TTP function could give rise to unwanted proinflammatory effects by disrupting endogenous negative feedback mechanisms, for example, those involving IL-10 (37, 39–41). Here we investigated in vitro and in vivo consequences of the impaired expression of IL-10 caused by a gain-of-function mutation of TTP.
RESULTS
Anomalous expression of certain TTP targets by Zfp36aa/aa macrophages.
Microarray analysis was performed to identify transcripts differentially expressed by Zfp36aa/aa macrophage colony-stimulating factor (M-CSF)-differentiated bone marrow-derived macrophages (M-BMMs) after stimulation with LPS. The microarray data were deposited at the Gene Expression Omnibus, and some aspects of their analysis were previously reported (52, 53). Figure 1 illustrates the analysis of LPS-induced transcripts (>2-fold increase of expression in response to LPS; P < 0.05). The data are presented in the form of volcano plots, in which transcripts with a >1.5-fold difference of expression between Zfp36+/+ and Zfp36aa/aa M-BMMs and a corrected P value of <0.05 are shaded black. Differential expression data are summarized in Table S1 in the supplemental material. As expected for a dominant negative regulator of gene expression, many transcripts were underexpressed by Zfp36aa/aa M-BMMs. Several of the changes of expression at 1 h were previously reported, including the underexpression of Tnf, Il10, and Cxcl1 mRNAs (53). By 4 h after the addition of LPS, the levels of both Tnf and Cxcl1 mRNAs had almost returned to basal levels, and differences between Zfp36+/+ and Zfp36aa/aa M-BMMs were no longer statistically significant (also see Fig. 4A). Il10 mRNA was significantly underexpressed by Zfp36aa/aa M-BMMs at both the 1-h and 4-h time points. Contrary to expectation, Il6, which was previously characterized as a TTP target (38, 41, 55, 56), was not significantly underexpressed by Zfp36aa/aa M-BMMs (Fig. 1). Several other transcripts were significantly overexpressed by Zfp36aa/aa M-BMMs. One example, Il12b, is highlighted in Fig. 1.
FIG 1.

Differentially expressed transcripts in Zfp36aa/aa M-BMMs. M-BMMs were generated from 3 Zfp36+/+ and 3 Zfp36aa/aa mice and treated with 10 ng/ml LPS for 1 h (A) or 4 h (B). RNA was isolated, and transcript abundance was analyzed by using Agilent microarrays and Partek Genomics Suite. Transcripts expressed above an arbitrary threshold of 200 RMA in at least two replicates and demonstrating upregulation by LPS (>2 times; P < 0.05) were selected for display. Data are illustrated in the form of volcano plots, in which transcripts with a >1.5-fold difference in expression levels between Zfp36+/+ and Zfp36aa/aa M-BMMs and a corrected P value of <0.05 are shaded black. Underexpressed transcripts are to the left of the origin. Several transcripts are highlighted.
FIG 4.

TTP mutation affects gene expression at different levels. Zfp36+/+ and Zfp36aa/aa M-BMMs were treated with LPS for the times indicated, supernatants were collected, and RNA was isolated. (A) Steady-state mRNA abundance was measured by quantitative PCR. (B) Levels of primary transcripts were measured by quantitative PCR. (C) Actinomycin D (AmD) chase experiments were performed at the peak of gene expression (1 h in the case of Tnf and 4 h in the cases of Il10, Il6, and Il12b). (D) Levels of secreted proteins were measured by an ELISA or a multiplex bead assay. Graphs represent means ± standard errors of the means of data from three independent M-BMM cultures in each case. Pairwise comparisons that showed no statistical significance are not indicated. *, P < 0.05; **, P < 0.01; ***, P < 0.005 (by a Mann-Whitney test).
Gene ontology (GO) analysis was performed on transcripts differentially expressed by Zfp36aa/aa M-BMMs (see Table S2 in the supplemental material). At both 1 h and 4 h, underexpressed transcripts were highly enriched in several GO terms relating to response to stimulus, defense response, or inflammatory response. The enrichment of these terms was a consequence of the differential expression levels of transcripts including Tnf, Cxcl1, Cxcl2, Clcf1, Ier3, S100a8, Zfp36, Mefv, Ltf, and Il10, most of which were previously described as TTP targets (30). These results are arguably trivial, given that LPS-induced transcripts were selected prior to the analysis of differential gene expression. GO analysis of the overexpressed transcripts was more informative. At 1 h, several GO terms related to cell migration were very significantly enriched (P < 10−10). All of these enrichments arose from the increased expression levels of four transcripts, namely, Cited2, Cxcl10, Sdc4, and Trib1. At 4 h, the most significantly enriched GO terms were related to the phosphorylation of the transcription factor STAT5 (signal transducer and activator of transcription 5) or the regulation of the extrinsic apoptosis pathway (Table S2). The corresponding lists of differentially expressed transcripts were dominated by Il12b, Csf2, Cx3cl1, Kdr, and Rasip1. These findings suggest that the genes overexpressed by Zfp36aa/aa M-BMMs are functionally distinct.
TTP can negatively regulate gene expression by inhibiting translation rather than destabilizing mRNA (37, 57, 58). The LPS-induced expression levels of the TNF, IL-6, IL-10, and IL-12p40 proteins between Zfp36+/+ and Zfp36aa/aa M-BMMs were therefore compared. Multiple experiments were performed by using different numbers and densities of M-BMMs, depending on whether the primary aim was to harvest RNA for microarrays, RNA for quantitative PCR (qPCR), secreted protein for enzyme-linked immunosorbent assays (ELISAs) and multiplex assays, or intracellular protein for Western blotting. Regardless of the experimental conditions, the expression levels of both the TNF and IL-10 proteins were consistently diminished in Zfp36aa/aa M-BMMs (by approximately 5-fold and 3-fold, respectively) (Fig. 2A and B). In contrast, the pattern of expression of IL-6 was inconsistent, with unchanged expression by Zfp36aa/aa M-BMMs in most cases but both overexpression and underexpression in some experiments. Overall, there was no statistically significant difference in the expression levels of IL-6 between Zfp36+/+ and Zfp36aa/aa M-BMMs. (Fig. 2C). The expression level of the IL-12p40 protein was invariably higher in Zfp36aa/aa than in matched Zfp36+/+ M-BMMs, although the extent of overexpression was quite variable (Fig. 2D).
FIG 2.

Expression of TNF, IL-10, IL-6, and IL-12p40 proteins by Zfp36+/+ and Zfp36aa/aa M-BMMs. Matched Zfp36+/+ and Zfp36aa/aa M-BMMs were cultured in 24-, 12-, or 6-well dishes and stimulated with 10 ng/ml LPS for 4 h. ELISAs or multiplex bead assays were used to measure TNF (A), IL-10 (B), IL-6 (C), and IL-12p40 (D) levels. In the cases of TNF and IL-6, 5 of 14 experiments employed matched Zfp36+/+ and Zfp36aa/aa littermates. All other experiments employed at least three mice of each genotype, with mean cytokine concentrations being plotted. Cytokine quantities expressed by matched Zfp36+/+ and Zfp36aa/aa M-BMMs or sets of M-BMMs are connected by lines. The graphs on the right show mean cytokine expression levels in Zfp36aa/aa M-BMMs relative to those in matched Zfp36+/+ controls. n.s., not statistically significant; ***, P < 0.005; **, P < 0.01 (by a Wilcoxon matched-pair test).
Anomalous expression of certain TTP targets by Dusp1−/− macrophages.
In Dusp1−/− macrophages, enhanced and prolonged MAPK p38 activation in response to LPS promotes the overexpression of several cytokines and chemokines via increased phosphorylation and inactivation of TTP (52). The defining characteristic of genes that are regulated by the DUSP1-TTP axis is that the overexpression caused by the disruption of the Dusp1 gene can be prevented by combining this with the Zfp36aa/aa genotype. Dysregulated MAPK p38 signaling fails to promote the overexpression of target genes if TTP cannot be phosphorylated and inactivated. At the protein and mRNA levels, the expression levels of both TNF and the anti-inflammatory cytokine IL-10 conformed to the pattern described above, being elevated in Dusp1−/− but not Dusp1−/−-Zfp36aa/aa M-BMMs (Fig. 3). Il6 mRNA levels were decreased in M-BMMs of all three genetically modified genotypes, but there were no significant differences in protein expression levels (Fig. 3). At 4 h, the expression level of Il12b mRNA was actually decreased rather than increased in Dusp1−/− M-BMMs and was increased rather than decreased in Zfp36aa/aa M-BMMs, whereas in Dusp1−/−-Zfp36aa/aa M-BMMs, the expression level of Il12b mRNA was not significantly different from that in wild-type controls (Fig. 3). The pattern of expression of the IL-12p40 protein was similar.
FIG 3.

Regulation of inflammatory mediators by DUSP1 and TTP. Wild-type, Dusp1−/−, Zfp36aa/aa, and Dusp1−/−-Zfp36aa/aa M-BMMs were stimulated with 10 ng/ml LPS for 1 h or 4 h. Expression levels of selected mRNAs were determined by microarray analysis (A), and the levels of the corresponding proteins were measured by an ELISA or a multiplex bead assay (B). Graphs represent means ± standard errors of the means of data from 3 independent M-BMM cultures. n.s., not statistically significant; *, P < 0.05; **, P < 0.01; ***, P < 0.005 (by one-way ANOVA). The microarray experiment used to generate the data in panel A was previously described (52).
Targeted mutation of TTP paradoxically increases transcription of the Il6 and Il12b genes.
Tnf, Il6, Il10, and Il12b mRNAs can all be physically recognized by TTP (38) yet show very different responses to mutations that influence TTP phosphorylation and activity. To make sense of these disparate patterns, we monitored gene expression at the levels of steady-state mRNA, primary transcripts (as a surrogate for the transcription rate), mRNA stability, and protein secretion in LPS-treated Zfp36+/+ and Zfp36aa/aa M-BMMs (Fig. 4).
The abundances of both Tnf and Il10 steady-state mRNAs were decreased in Zfp36aa/aa M-BMMs (Fig. 4A). The expression levels of the corresponding proteins were diminished (Fig. 4D), as previously shown (53) (Fig. 2). There were no significant differences in Tnf or Il10 primary transcript levels (Fig. 4B), but the stabilities of Tnf and Il10 mRNAs were decreased in Zfp36aa/aa M-BMMs (Fig. 4C), as previously reported (53). The behavior of both the Tnf and Il10 genes is therefore consistent with direct regulation by TTP at the level of mRNA stability. Since the Zfp36 gene mutation had a greater effect on the TNF and IL-10 proteins than on Tnf and Il10 mRNAs, the phosphorylation of TTP may also have some impact at the translational level, as was previously suggested (37, 57, 58).
Only a minor difference in the steady-state Il6 mRNA abundance was detected at 4 h (Fig. 4A), and IL-6 secretion did not differ between Zfp36+/+ and Zfp36aa/aa M-BMMs (Fig. 4D). There appeared to be an almost perfect balance between the increase in the rate of Il6 transcription (Fig. 4B) and the increase in the rate of Il6 mRNA degradation (Fig. 4C). Il12b mRNA was highly stable in both Zfp36+/+ and Zfp36aa/aa M-BMMs (Fig. 4C). The increased expression levels of Il12b mRNA (Fig. 4A) and IL-12p40 protein (Fig. 4D) by Zfp36aa/aa M-BMMs appeared to be driven by an enhanced transcriptional response to LPS (Fig. 4B).
Disruption of IL-10-mediated negative feedback contributes to the anomalous expression of IL-6 and IL-12p40 by Zfp36aa/aa macrophages.
IL-10 is a well-characterized target of TTP (38–41), which is underexpressed by Zfp36aa/aa M-BMMs (Fig. 5) and known to negatively regulate the expression of TNF, IL-12p40, and IL-6 (7, 19). Noticeably, the expression of IL-12p40 in macrophages of differing genetic backgrounds was an almost perfect mirror image of IL-10 expression (Fig. 3). It was therefore speculated that a disruption of IL-10-mediated autocrine negative feedback mechanisms contributed to differences in IL-6 and IL-12p40 expression in vitro.
FIG 5.

Dose-dependent inhibition of proinflammatory gene expression by IL-10. Il10−/− M-BMMs were stimulated with 10 ng/ml LPS for 4 h in the presence of different concentrations of recombinant IL-10. TNF, IL-6, and IL-12p40 levels were quantified by an ELISA. Cytokine levels were normalized against those in the absence of IL-10. The graph shows means ± standard errors of the means of data from at least 8 independent M-BMM cultures.
It is not known whether proinflammatory genes display the same dose response to inhibition by IL-10. Differential sensitivity to IL-10 could influence the outcomes of dysregulated IL-10 biosynthesis in macrophages. Therefore, Il10−/− M-BMMs were used to investigate the relative sensitivity of TNF, IL-12p40, and IL-6 expression to exogenous IL-10 in the absence of interference from endogenous IL-10 (Fig. 5). The three proinflammatory cytokines displayed quite distinct dose responses. IL-12p40 was the most sensitive in terms of both the 50% effective concentration (EC50) (estimated to be 0.15 ng/ml) and maximal inhibition (93%). TNF was inhibited by a maximum of 76% and with an EC50 of approximately 0.29 ng/ml. IL-6 biosynthesis was insensitive to low concentrations of IL-10. Maximal inhibition was 81%, and the estimated EC50 was 1.52 ng/ml.
Differentiation of BMMs in the presence of granulocyte-macrophage colony-stimulating factor (GM-CSF) rather than M-CSF has been reported to generate a cell population (GM-BMMs) that expresses relatively little IL-10 but larger amounts of TNF, IL-6, and IL-12p40 in response to LPS (59, 60). It was confirmed that wild-type GM-BMMs expressed 5-fold less IL-10 than did M-BMMs generated in parallel from the same donor mice (Fig. 6). The expression levels of the proinflammatory cytokines TNF, IL-6, and IL-12p40 were elevated 2.5-fold, 5.4-fold, and 56.3-fold, respectively, in GM-BMMs compared to M-BMMs generated in parallel. Zfp36+/+ and Zfp36aa/aa GM-BMMs did not differ in their expression of IL-10 after stimulation with LPS. Therefore, in GM-BMMs, the targeted mutation of TTP cannot indirectly influence gene expression by perturbing IL-10-mediated autocrine/paracrine feedback mechanisms. Targeted mutation of the Zfp36 locus decreased the expression of TNF in both M-BMMs and GM-BMMs. The Zfp36 mutation did not affect IL-6 expression in M-BMMs, whereas in GM-BMMs, the mutation significantly decreased the expression of IL-6. The expression of IL-12p40 was elevated as a consequence of the Zfp36 mutation in M-BMMs. In contrast, in GM-BMMs, the Zfp36 mutation had no significant effect on IL-12p40 expression.
FIG 6.
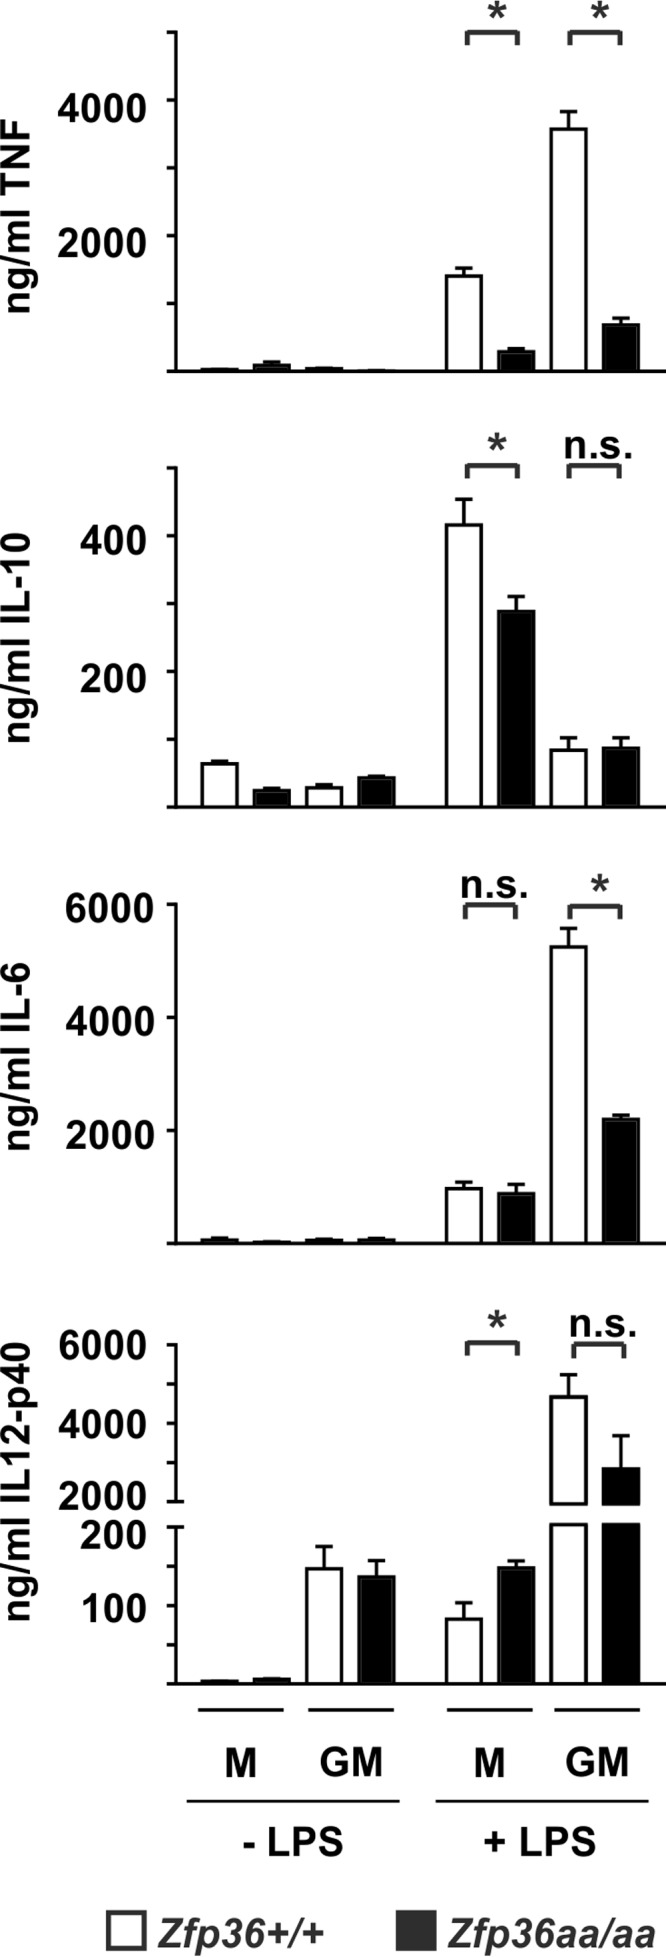
Differential gene expression in Zfp36+/+ and Zfp36aa/aa M-BMMs and GM-BMMs. Macrophages were differentiated from bone marrow of Zfp36+/+ and Zfp36aa/aa mice in the presence of either M-CSF of GM-CSF and treated with 10 ng/ml LPS for 4 h. Cytokine levels were measured by an ELISA or a multiplex bead assay. Graphs represent means ± standard errors of the means from 4 independent cultures (TNF, IL-10, and IL-12p40) or 7 independent cultures (IL-6). n.s., not statistically significant; *, P < 0.05 (by a Mann-Whitney test).
The observations described above support the hypothesis that changes in the expression of IL-10 influence the phenotype caused by the substitution of two TTP phosphorylation sites. To test this hypothesis more rigorously, Zfp36+/+ and Zfp36aa/aa M-BMMs were stimulated with LPS in the presence of an IL-10-neutralizing antibody or an isotype control (Fig. 7). In the presence of the neutralizing antibody, IL-6 was underexpressed by Zfp36aa/aa M-BMMs. IL-10 neutralization increased the expression of IL-12p40 in Zfp36+/+ M-BMMs but had relatively little effect on Zfp36aa/aa M-BMMs. As a consequence, the degree of overexpression of IL-12p40 by Zfp36aa/aa M-BMMs was diminished. Together, these data indicate that the aberrant patterns of expression of IL-6 (unaltered in Zfp36aa/aa M-BMMs) and IL-12p40 (elevated in Zfp36aa/aa M-BMMs) are at least partly due to alterations in IL-10-mediated negative feedback. The expression of TNF appears minimally sensitive to this phenomenon.
FIG 7.
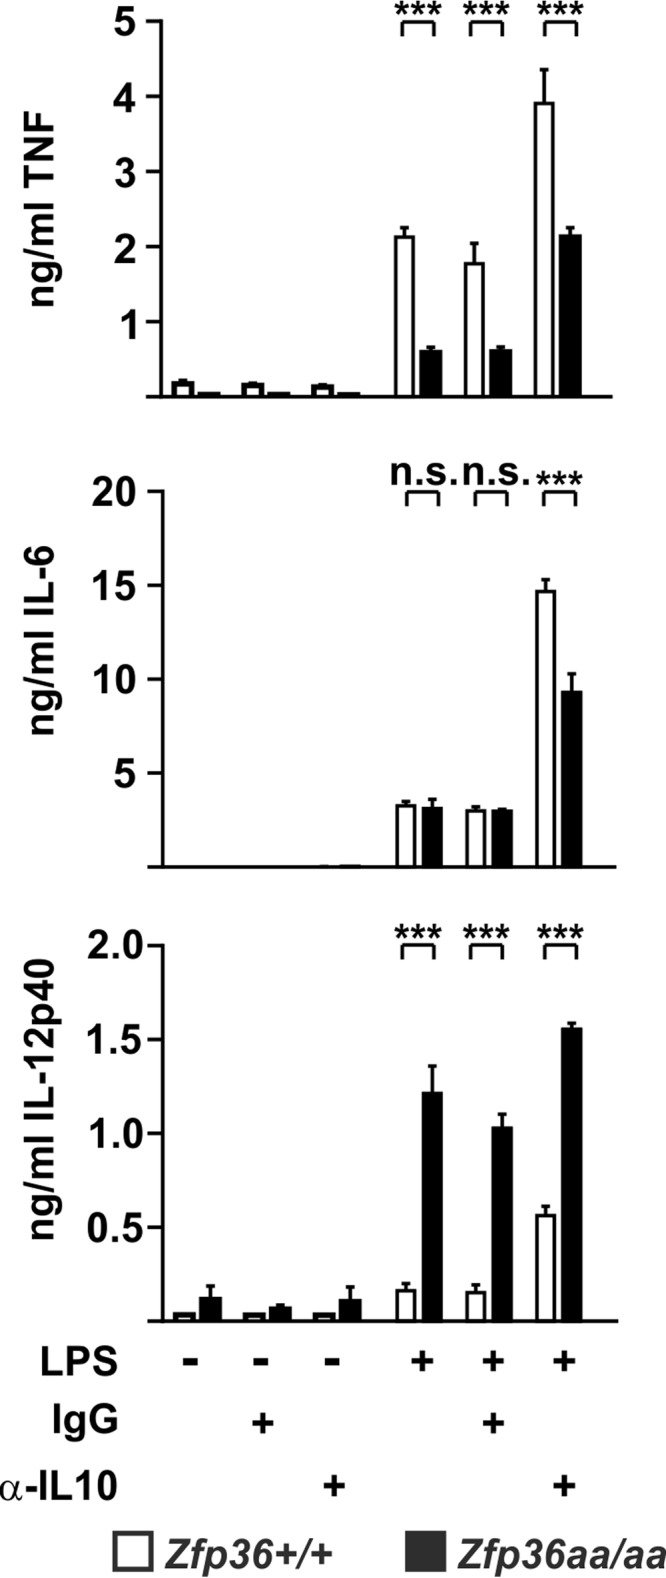
Endogenous IL-10 differentially affects the expression of proinflammatory cytokines. Zfp36+/+ and Zfp36aa/aa M-BMMs were treated with 10 ng/ml LPS for 4 h (TNF and IL-6) or 8 h (IL-12p40) in the presence of 10 μg/ml IL-10-neutralizing antibody or an isotype control. Cytokine levels were measured by a multiplex bead assay or an ELISA. Graphs represent means ± standard errors of the means from 4 independent M-BMM cultures. n.s., not statistically significant; ***, P < 0.005 (by a Mann-Whitney test).
Targeted mutation of TTP has overwhelmingly anti-inflammatory consequences in vivo.
Next, Zfp36+/+ and Zfp36aa/aa mice were injected intraperitoneally (i.p.) with LPS, and serum cytokine and chemokine levels were measured after 3 and 12 h (Fig. 8). Decreased expression levels of TNF and IL-10 in Zfp36aa/aa mice were previously reported (53) (indicated by † in Fig. 8). CCL3, CCL4, CCL11, CSF2, gamma interferon (IFN-γ), IL-1α, IL-5, and IL-13 were also significantly underexpressed by Zfp36aa/aa mice. Most notably, the expression level of IL-6 was decreased by almost 4-fold at 3 h and by more than 200-fold at 12 h in Zfp36aa/aa mice. The elevated expression of IL-12p40 in LPS-treated Zfp36aa/aa M-BMMs was not recapitulated in vivo. Serum concentrations of IL-12p40 were not significantly different between LPS-treated Zfp36+/+ and Zfp36aa/aa mice at 3 h but were significantly lower in Zfp36aa/aa mice at 12 h.
FIG 8.

In vivo responses to LPS are broadly impaired in Zfp36aa/aa mice. Zfp36+/+ and Zfp36aa/aa mice were injected intraperitoneally with 5 mg/kg LPS and humanely sacrificed after 3 or 12 h. Serum cytokine levels were measured by a multiplex bead assay or an ELISA. Graphs represent means ± standard errors of the means for 5 untreated mice and 10 LPS-injected mice at each time point. *, P < 0.05; **, P < 0.01; ***, P < 0.005 (by a Mann-Whitney test). The IL-10 and TNF measurements (indicated by †) were previously reported (53).
Finally, to test whether cytokine expression in vivo was regulated by DUSP1 via alterations in TTP phosphorylation, wild-type, Dusp1−/−, Zfp36aa/aa, and Dusp1−/−-Zfp36aa/aa mice were injected intraperitoneally with LPS and culled after 3 h, and the expression levels of Tnf, Il10, Il6, and IL12b mRNAs were measured in spleens (Fig. 9). Levels of Tnf and Il10 mRNAs were elevated in spleens of LPS-treated Dusp1−/− mice and decreased in those of Zfp36aa/aa mice. When Dusp1−/− and Zfp36aa/aa genetic modifications were combined, the Zfp36aa/aa phenotype was dominant, and the expression levels of both mRNAs remained low. These patterns of gene expression are very similar to those previously described in vitro (Fig. 3A) and in serum of LPS-treated mice (52), consistent with DUSP1 regulating gene expression via modulation of the phosphorylation state of TTP in both contexts. Strikingly, the pattern of expression of Il6 mRNA was the same: it was increased in Dusp1−/− spleens but decreased in both Zfp36aa/aa and Dusp1−/−-Zfp36aa/aa spleens, indicating a similar mechanism of regulation. The level of the IL-6 protein was also very strongly elevated in sera of LPS-treated Dusp1−/− mice but decreased in sera of both Zfp36aa/aa and Dusp1−/−-Zfp36aa/aa mice (data not shown). Differences in the expression levels of Il12b mRNA among the four genotypes of mice were not significant. The dysregulation of Il12b gene expression in isolated Zfp36aa/aa M-BMMs was therefore not recapitulated in vivo in Zfp36aa/aa mice (Fig. 8).
FIG 9.

Regulation of cytokine expression by the DUSP1-TTP axis in vivo. Dusp1+/+-Zfp36+/+, Dusp1−/−-Zfp36+/+, Dusp1+/+-Zfp36aa/aa, or Dusp1−/−-Zfp36aa/aa mice were injected intraperitoneally with 5 mg/kg LPS and humanely sacrificed after 3 h. Spleens were excised, RNA was prepared, and the levels of the indicated transcripts were quantified by qPCR, with normalization against B2m mRNA levels and then against the untreated wild-type (Dusp1+/+-Zfp36+/+) control. Graphs represent means ± standard errors of the means for 2 untreated and 4 LPS-treated mice of each genotype. n.s., not statistically significant; **, P < 0.01; ***, P < 0.005 (by ANOVA).
DISCUSSION
The phosphorylation and dephosphorylation of TTP constitute a molecular switch for turning gene expression on and off during responses to inflammatory stimuli (43). In Dusp1−/− cells, the dysregulation of MAPK p38 signaling pushes the switch in the “on” direction, promoting the phosphorylation and inactivation of TTP and enhancing and sustaining the expression of TTP target genes by increasing mRNA stability. In Zfp36aa/aa cells, the switch is locked in the “off” position, and the expression of TTP target genes is diminished as a consequence of enhanced mRNA decay. This locked switch prevents the overexpression of TTP target genes in cells in which the two genetic modifications are combined (43, 52). Here and in previous reports (52, 53), the expression of both TNF and IL-10 conformed exactly to the pattern described above, whether investigated in vitro or in vivo. The behavior of these genes can be understood simply in terms of our working model of TTP function. However, it remains puzzling at first sight that the same molecular mechanism is used to regulate the expressions of a powerful proinflammatory cytokine and a powerful anti-inflammatory cytokine. It is likely that this shared regulation contributes to the resolution of inflammation. Any stimulus that provokes the strong expression of TNF via the activation of the MAPK p38 and the phosphorylation of TTP will also provoke the strong expression of IL-10, with a built-in delay owing to the slower transcriptional activation of the latter. IL-10 then acts as an autocrine or paracrine negative feedback regulator of the inflammatory response.
When gene expression was initially studied in Zfp36aa/aa M-BMMs, we were puzzled that IL-6 did not behave as expected. IL-6 has been well characterized as a target of TTP (30, 55, 56), yet its expression was not consistently diminished in Zfp36aa/aa M-BMMs and in many experiments was actually increased (Fig. 2). Microarray analysis also revealed the surprising overexpression of several transcripts by Zfp36aa/aa M-BMMs (Fig. 1), among which Il12b was prominent. We hypothesized that an impairment of IL-10-mediated negative feedback control contributed to these anomalies. Being a secondary response gene, the peak of expression of Il6 occurred at a time when the endogenous IL-10 protein had already accumulated in tissue culture supernatants (Fig. 4). IL-6 expression was sensitive to inhibition by IL-10, with a very steep dose response at concentrations of between 1 and 3 ng/ml (Fig. 5), similar to the range of IL-10 concentrations produced by Zfp36+/+ and Zfp36aa/aa M-BMMs (Fig. 4). As predicted, IL-6 was underexpressed by Zfp36aa/aa GM-BMMs (Fig. 6) and by Zfp36aa/aa peritoneal macrophages (data not shown), both of which produce very low levels of IL-10. Neutralization of IL-10 also restored the expected gene expression pattern, in which IL-6 was underexpressed by Zfp36aa/aa M-BMMs (Fig. 7). It therefore appears that differences in the levels of IL-10 in tissue culture have a profound effect on the expression of the Il6 gene, resulting in variable under- or overexpression by Zfp36aa/aa M-BMMs. Although Tnf gene expression is also negatively regulated by IL-10 (Fig. 5) (19, 61), its immediate early pattern of expression (61, 62) (Fig. 4) presumably allows it to escape the influence of such fluctuations in the efficacy of negative feedback control. By the time that levels of endogenous IL-10 accumulate significantly, the transcriptional activity of the Tnf gene is already declining.
The production of the IL-12p40 protein was profoundly sensitive to IL-10-mediated inhibition (Fig. 5). The paradoxical overexpression of IL-12p40 by Zfp36aa/aa M-BMMs was caused by an increase in transcription (Fig. 4). Like others (63, 64), we found no evidence that TTP regulated Il12b mRNA stability (Fig. 4). This increase of expression was not observed in Zfp36aa/aa GM-BMMs, which express little IL-10 (Fig. 6). IL-10 has been reported to inhibit Il12b transcription via the induction of the transcriptional repressor NFIL3 (nuclear factor, IL-3 regulated) (13). Four hours after the addition of LPS, the expression level of Nfil3 mRNA was significantly lower in Zfp36aa/aa than in Zfp36+/+ M-BMMs (2,135 ± 35 versus 4,940 ± 497 robust microarray analysis units [RMA]; P < 0.005). It is therefore possible that impaired negative feedback via NFIL3 contributes to the enhanced transcriptional induction of the Il12b gene in Zfp36aa/aa M-BMMs (Fig. 4). However, neutralization of IL-10 only partially reversed the overexpression of IL-12p40 by Zfp36aa/aa M-BMMs, suggesting that additional mechanisms may be involved. TTP has been reported to inhibit Il12b gene expression by modulating the function of the transcription factor NF-κB (nuclear factor kappa light chain enhancer of activated B cells) (65). However, we were unable to detect any differences in NF-κB function in Zfp36aa/aa M-BMMs (53). Additionally, it is difficult to explain the increases in the expression levels of only a few genes by the increased activity of a transcription factor that regulates much of the macrophage response to LPS. Therefore, the aberrant expression of IL-12p40 by Zfp36aa/aa M-BMMs has been only partially accounted for.
Previous reports identified IL-10 as a target of TTP (39, 41), describing the increased expression of IL-10 and the consequent underexpression of both IL-6 and IL-12 by Zfp36−/− macrophages. The phenomenon described here is a mirror image, in which a gain of function of TTP impairs IL-10-mediated negative feedback control in vitro and promotes the increased expressions of these two cytokines. As we and others are interested in the concept of therapeutic targeting of TTP (31, 43, 53), the impairment of negative feedback control was a source of concern, prompting us to test the in vivo effects of the gain-of-function mutation. Despite the fact that LPS-induced IL-10 expression was diminished in Zfp36aa/aa mice, we detected no corresponding increase in the expression of either IL-6 or IL-12p40 (Fig. 8 and 9). In fact, IL-6 was consistently expressed at very low levels by Zfp36aa/aa mice following systemic LPS challenge (Fig. 8), the injection of zymosan into dorsal air pouches, or the induction of experimental arthritis (53). Increased circulating levels of either IL-12 or IL-23, which share the common IL-12p40 subunit, would be expected to promote Th1 and Th17 responses, characterized by elevated expression levels of IFN-γ and IL-17. In fact, both of these effector cytokines were present at lower levels in sera of LPS-injected Zfp36aa/aa mice (49) (Fig. 8).These findings suggest that agonists that activate TTP may exert anti-inflammatory effects without incurring immune activation via the increased expression of IL-6, IL-12, or IL-23. It will be important to test this further in experimental settings such as inflammatory bowel disease, where impaired expression of IL-10 may have profound consequences (8, 12).
A remaining question is why the behaviors of the Il6 and Il12b genes are so different when studied in vitro and in vivo. Although in vitro experiments are invaluable for gaining insight into molecular mechanisms of gene regulation, it is easy to forget how poorly they model inflammatory responses in vivo. In many senses, the in vitro assay system is artificial. The population of cells is homogeneous, their exposure to stimulus is synchronous, and they remain thereafter in a static milieu, in which local concentrations of cytokines and other effectors may become high and autocrine or paracrine effects may be amplified. In vivo, the population of cells responding to LPS is heterogeneous, their time of exposure to the agonist will vary somewhat, and the local accumulation of cytokines and other immune effectors will be limited by circulation. Whatever the explanation for the divergent behaviors of IL-6 and IL-12p40 in vitro and in vivo, our principal conclusion remains the same. A gain of function of TTP causes the dysregulation of IL-6 and IL-12p40, at least in part indirectly, via changes in IL-10 expression. However, aberrant overexpression of IL-6 and IL-12p40 does not occur in Zfp36aa/aa mice.
MATERIALS AND METHODS
Materials.
LPS (Escherichia coli serotype EH100) was purchased from Enzo Life Sciences. Other biochemicals were purchased from Sigma-Aldrich unless otherwise stated. All media and sera were routinely tested for endotoxin by using the Limulus amebocyte lysate test (Lonza) and were rejected if the endotoxin concentration exceeded 0.1 U/ml.
Generation of mouse strains.
The generation of the Zfp36aa/aa mouse strain in the C57BL/6 background was described previously (49). The Dusp1−/− strain was a generous gift from Bristol-Myers Squibb and was backcrossed to the C57BL/6 strain for 10 generations prior to performing the experiments described here. The double-targeted Dusp1−/−-Zfp36aa/aa line was generated by three generations of crossing, with genotyping being performed by PCR of genomic DNA, and thereafter was maintained as a pure-breeding line. Bone marrow from Il10−/− mice was generously provided by Fiona Powrie (Oxford).
In vivo experiments and cell isolation.
All animal experiments were approved by local ethical committees and performed under UK Home Office project licenses. C57BL/6 mice were purchased from Harlan Laboratories. All mice used were between 6 and 12 weeks of age. To assess the systemic response to LPS, mice were injected i.p. with 5 mg/kg of body weight of purified LPS in 200 μl sterile phosphate-buffered saline (PBS). Mice were humanely culled 3 h or 12 h after challenge, and peripheral blood was collected by cardiac puncture for serum isolation. Spleens were excised and snap-frozen in liquid nitrogen for later isolation of RNA.
Bone marrow was isolated from humanely culled mice, and BMMs (bone marrow-derived macrophages) were obtained by differentiation in vitro with either 100 ng/ml M-CSF (Peprotech), or 50 ng/ml GM-CSF in RPMI 1640 containing 10% heat-inactivated fetal calf serum (FCS) and penicillin-streptomycin for 7 days. BMMs were plated at a density of 1 × 10⁶ macrophages/ml in the appropriate cell culture plate at least 1 day prior to stimulation.
Neutralization of endogenous secreted IL-10 was achieved by in vitro incubation with an IL-10-neutralizing antibody (catalogue number 501407; BioLegend) at 10 μg/ml for the duration of the assays. Controls were treated with an equal concentration of isotype-matched antibody.
Measurements of mRNA levels.
RNA was extracted from BMMs by using QIAshredder columns and an RNeasy minikit (Qiagen). cDNA was generated by using the iScript cDNA synthesis kit (Bio-Rad). Gene expression was quantified by reverse transcription-quantitative PCR (qRT-PCR) on a LightCycler 480 II instrument (Roche) using the Superscript III platinum RT-PCR kit and custom-synthesized oligonucleotide primers (Eurofins MWG) with SYBR Premix Ex Taq (Lonza). The relative gene expression level was calculated by using the ΔΔCT method with Gapdh or B2m mRNA for the normalization of RNA levels. Primary transcript PCR was performed by using primer pairs that crossed exon-intron boundaries, with an additional DNase I step to remove contaminating genomic DNA from RNA samples (Qiagen). Control PCRs were carried out in the absence of RT in order to monitor genomic DNA contamination, which in all cases was negligible. Sequences of oligonucleotides designed to detect primary or mature transcripts are available from the authors upon request.
The half-life of mRNA was estimated by using the transcription inhibitor actinomycin D (Sigma) at 5 μg/ml, followed by measurement of mRNA levels by quantitative real-time PCR.
Microarray analyses were performed by using SurePrint G3 Mouse GE 8x60K slides (Agilent) and Partek Genomics Suite version 6.6, build 6.13.0315 (Partek), as previously described (49). For the generation of volcano plots, transcripts were first filtered for significant upregulation in response to LPS (>2-fold increase; adjusted P value of <0.05), and weakly expressed transcripts were removed by the application of an arbitrary filter of 200 RMA. Plots (log2 fold difference of expression versus −log10 analysis of variance [ANOVA] P value) were constructed by using ggplot2s in the R statistical package, with subset cutoffs at a P value of <0.05 and a fold difference of expression of >1.5.
Assessment of protein expression.
Secreted factors in tissue culture supernatants and sera were quantified by an ELISA according to the manufacturer's instructions (eBioscience) or by using Bio-Plex bead capture assays and a Bio-Plex 200 analyzer (Bio-Rad).
Statistical analysis.
GraphPad Prism software (version 5.03) was used for statistical analysis. A Mann-Whitney U test was used for comparisons of two groups. For analysis of multiple groups, ANOVA with Bonferroni correction for multiple comparisons was used.
Accession number.
Microarray data discussed in this paper were deposited at the Gene Expression Omnibus (http://www.ncbi.nlm.nih.gov/geo/) with accession number GSE68449.
Supplementary Material
ACKNOWLEDGMENTS
This work was supported by program grant 19614 from Arthritis Research UK. We are grateful to Fiona Powrie and Claire Pearson (Oxford) for provision of Il10−/− bone marrow.
We have no conflicts of interest with regard to the subjects of this paper.
J.D.O., E.A.R., T.S., Q.D., T.T., and D.M. performed experiments. M.L.R. analyzed microarray data. D.R.S. and T.C. interpreted data. J.L.D., C.D.B., and A.R.C. devised and interpreted experiments. A.R.C. wrote the manuscript, with input from all coauthors.
Footnotes
Supplemental material for this article may be found at https://doi.org/10.1128/MCB.00536-16.
REFERENCES
- 1.Takeuchi O, Akira S. 2010. Pattern recognition receptors and inflammation. Cell 140:805–820. doi: 10.1016/j.cell.2010.01.022. [DOI] [PubMed] [Google Scholar]
- 2.Brubaker SW, Bonham KS, Zanoni I, Kagan JC. 2015. Innate immune pattern recognition: a cell biological perspective. Annu Rev Immunol 33:257–290. doi: 10.1146/annurev-immunol-032414-112240. [DOI] [PMC free article] [PubMed] [Google Scholar]
- 3.Zak DE, Tam VC, Aderem A. 2014. Systems-level analysis of innate immunity. Annu Rev Immunol 32:547–577. doi: 10.1146/annurev-immunol-032713-120254. [DOI] [PMC free article] [PubMed] [Google Scholar]
- 4.Hu X, Chakravarty SD, Ivashkiv LB. 2008. Regulation of interferon and Toll-like receptor signaling during macrophage activation by opposing feedforward and feedback inhibition mechanisms. Immunol Rev 226:41–56. doi: 10.1111/j.1600-065X.2008.00707.x. [DOI] [PMC free article] [PubMed] [Google Scholar]
- 5.Abraham SM, Clark AR. 2006. Dual-specificity phosphatase 1: a critical regulator of innate immune responses. Biochem Soc Trans 34:1018–1023. doi: 10.1042/BST0341018. [DOI] [PubMed] [Google Scholar]
- 6.Bode JG, Ehlting C, Haussinger D. 2012. The macrophage response towards LPS and its control through the p38(MAPK)-STAT3 axis. Cell Signal 24:1185–1194. doi: 10.1016/j.cellsig.2012.01.018. [DOI] [PubMed] [Google Scholar]
- 7.Murray PJ, Smale ST. 2012. Restraint of inflammatory signaling by interdependent strata of negative regulatory pathways. Nat Immunol 13:916–924. doi: 10.1038/ni.2391. [DOI] [PMC free article] [PubMed] [Google Scholar]
- 8.Kole A, Maloy KJ. 2014. Control of intestinal inflammation by interleukin-10. Curr Top Microbiol Immunol 380:19–38. doi: 10.1007/978-3-662-43492-5_2. [DOI] [PubMed] [Google Scholar]
- 9.Mantovani A, Marchesi F. 2014. IL-10 and macrophages orchestrate gut homeostasis. Immunity 40:637–639. doi: 10.1016/j.immuni.2014.04.015. [DOI] [PubMed] [Google Scholar]
- 10.Kobayashi M, Kweon MN, Kuwata H, Schreiber RD, Kiyono H, Takeda K, Akira S. 2003. Toll-like receptor-dependent production of IL-12p40 causes chronic enterocolitis in myeloid cell-specific Stat3-deficient mice. J Clin Invest 111:1297–1308. doi: 10.1172/JCI17085. [DOI] [PMC free article] [PubMed] [Google Scholar]
- 11.Kamada N, Hisamatsu T, Okamoto S, Sato T, Matsuoka K, Arai K, Nakai T, Hasegawa A, Inoue N, Watanabe N, Akagawa KS, Hibi T. 2005. Abnormally differentiated subsets of intestinal macrophage play a key role in Th1-dominant chronic colitis through excess production of IL-12 and IL-23 in response to bacteria. J Immunol 175:6900–6908. doi: 10.4049/jimmunol.175.10.6900. [DOI] [PubMed] [Google Scholar]
- 12.Shouval DS, Ouahed J, Biswas A, Goettel JA, Horwitz BH, Klein C, Muise AM, Snapper SB. 2014. Interleukin 10 receptor signaling: master regulator of intestinal mucosal homeostasis in mice and humans. Adv Immunol 122:177–210. doi: 10.1016/B978-0-12-800267-4.00005-5. [DOI] [PMC free article] [PubMed] [Google Scholar]
- 13.Smith AM, Qualls JE, O'Brien K, Balouzian L, Johnson PF, Schultz-Cherry S, Smale ST, Murray PJ. 2011. A distal enhancer in Il12b is the target of transcriptional repression by the STAT3 pathway and requires the basic leucine zipper (B-ZIP) protein NFIL3. J Biol Chem 286:23582–23590. doi: 10.1074/jbc.M111.249235. [DOI] [PMC free article] [PubMed] [Google Scholar]
- 14.Shouval DS, Biswas A, Goettel JA, McCann K, Conaway E, Redhu NS, Mascanfroni ID, Al Adham Z, Lavoie S, Ibourk M, Nguyen DD, Samsom JN, Escher JC, Somech R, Weiss B, Beier R, Conklin LS, Ebens CL, Santos FG, Ferreira AR, Sherlock M, Bhan AK, Muller W, Mora JR, Quintana FJ, Klein C, Muise AM, Horwitz BH, Snapper SB. 2014. Interleukin-10 receptor signaling in innate immune cells regulates mucosal immune tolerance and anti-inflammatory macrophage function. Immunity 40:706–719. doi: 10.1016/j.immuni.2014.03.011. [DOI] [PMC free article] [PubMed] [Google Scholar]
- 15.Zigmond E, Bernshtein B, Friedlander G, Walker CR, Yona S, Kim KW, Brenner O, Krauthgamer R, Varol C, Muller W, Jung S. 2014. Macrophage-restricted interleukin-10 receptor deficiency, but not IL-10 deficiency, causes severe spontaneous colitis. Immunity 40:720–733. doi: 10.1016/j.immuni.2014.03.012. [DOI] [PubMed] [Google Scholar]
- 16.Engelhardt KR, Grimbacher B. 2014. IL-10 in humans: lessons from the gut, IL-10/IL-10 receptor deficiencies, and IL-10 polymorphisms. Curr Top Microbiol Immunol 380:1–18. doi: 10.1007/978-3-662-43492-5_1. [DOI] [PubMed] [Google Scholar]
- 17.Hutchins AP, Diez D, Miranda-Saavedra D. 2013. The IL-10/STAT3-mediated anti-inflammatory response: recent developments and future challenges. Brief Funct Genomics 12:489–498. doi: 10.1093/bfgp/elt028. [DOI] [PMC free article] [PubMed] [Google Scholar]
- 18.Murray PJ. 2006. Understanding and exploiting the endogenous interleukin-10/STAT3-mediated anti-inflammatory response. Curr Opin Pharmacol 6:379–386. doi: 10.1016/j.coph.2006.01.010. [DOI] [PubMed] [Google Scholar]
- 19.Williams LM, Ricchetti G, Sarma U, Smallie T, Foxwell BM. 2004. Interleukin-10 suppression of myeloid cell activation—a continuing puzzle. Immunology 113:281–292. doi: 10.1111/j.1365-2567.2004.01988.x. [DOI] [PMC free article] [PubMed] [Google Scholar]
- 20.Hao NB, Lu MH, Fan YH, Cao YL, Zhang ZR, Yang SM. 2012. Macrophages in tumor microenvironments and the progression of tumors. Clin Dev Immunol 2012:948098. doi: 10.1155/2012/948098. [DOI] [PMC free article] [PubMed] [Google Scholar]
- 21.Ouyang P, Rakus K, van Beurden SJ, Westphal AH, Davison AJ, Gatherer D, Vanderplasschen AF. 2014. IL-10 encoded by viruses: a remarkable example of independent acquisition of a cellular gene by viruses and its subsequent evolution in the viral genome. J Gen Virol 95:245–262. doi: 10.1099/vir.0.058966-0. [DOI] [PubMed] [Google Scholar]
- 22.Gabrysova L, Howes A, Saraiva M, O'Garra A. 2014. The regulation of IL-10 expression. Curr Top Microbiol Immunol 380:157–190. doi: 10.1007/978-3-662-43492-5_8. [DOI] [PubMed] [Google Scholar]
- 23.MacKenzie KF, Pattison MJ, Arthur JS. 2014. Transcriptional regulation of IL-10 and its cell-specific role in vivo. Crit Rev Immunol 34:315–345. doi: 10.1615/CritRevImmunol.2014010694. [DOI] [PubMed] [Google Scholar]
- 24.Glass CK. 2015. Genetic and genomic approaches to understanding macrophage identity and function. Arterioscler Thromb Vasc Biol 35:755–762. doi: 10.1161/ATVBAHA.114.304051. [DOI] [PMC free article] [PubMed] [Google Scholar]
- 25.Medzhitov R, Horng T. 2009. Transcriptional control of the inflammatory response. Nat Rev Immunol 9:692–703. doi: 10.1038/nri2634. [DOI] [PubMed] [Google Scholar]
- 26.Schultze JL, Freeman T, Hume DA, Latz E. 2015. A transcriptional perspective on human macrophage biology. Semin Immunol 27:44–50. doi: 10.1016/j.smim.2015.02.001. [DOI] [PubMed] [Google Scholar]
- 27.Smale ST, Natoli G. 2014. Transcriptional control of inflammatory responses. Cold Spring Harb Perspect Biol 6:a016261. doi: 10.1101/cshperspect.a016261. [DOI] [PMC free article] [PubMed] [Google Scholar]
- 28.Carpenter S, Ricci EP, Mercier BC, Moore MJ, Fitzgerald KA. 2014. Post-transcriptional regulation of gene expression in innate immunity. Nat Rev Immunol 14:361–376. doi: 10.1038/nri3682. [DOI] [PubMed] [Google Scholar]
- 29.Khabar KS. 2010. Post-transcriptional control during chronic inflammation and cancer: a focus on AU-rich elements. Cell Mol Life Sci 67:2937–2955. doi: 10.1007/s00018-010-0383-x. [DOI] [PMC free article] [PubMed] [Google Scholar]
- 30.Brooks SA, Blackshear PJ. 2013. Tristetraprolin (TTP): interactions with mRNA and proteins, and current thoughts on mechanisms of action. Biochim Biophys Acta 1829:666–679. doi: 10.1016/j.bbagrm.2013.02.003. [DOI] [PMC free article] [PubMed] [Google Scholar]
- 31.Patial S, Blackshear PJ. 2016. Tristetraprolin as a therapeutic target in inflammatory disease. Trends Pharmacol Sci 37:811–821. doi: 10.1016/j.tips.2016.07.002. [DOI] [PMC free article] [PubMed] [Google Scholar]
- 32.Carballo E, Lai WS, Blackshear PJ. 1998. Feedback inhibition of macrophage tumor necrosis factor-alpha production by tristetraprolin. Science 281:1001–1005. doi: 10.1126/science.281.5379.1001. [DOI] [PubMed] [Google Scholar]
- 33.Kratochvill F, Machacek C, Vogl C, Ebner F, Sedlyarov V, Gruber AR, Hartweger H, Vielnascher R, Karaghiosoff M, Rulicke T, Muller M, Hofacker I, Lang R, Kovarik P. 2011. Tristetraprolin-driven regulatory circuit controls quality and timing of mRNA decay in inflammation. Mol Syst Biol 7:560. doi: 10.1038/msb.2011.93. [DOI] [PMC free article] [PubMed] [Google Scholar]
- 34.Qiu LQ, Stumpo DJ, Blackshear PJ. 2012. Myeloid-specific tristetraprolin deficiency in mice results in extreme lipopolysaccharide sensitivity in an otherwise minimal phenotype. J Immunol 188:5150–5159. doi: 10.4049/jimmunol.1103700. [DOI] [PMC free article] [PubMed] [Google Scholar]
- 35.Taylor GA, Carballo E, Lee DM, Lai WS, Thompson MJ, Patel DD, Schenkman DI, Gilkeson GS, Broxmeyer HE, Haynes BF, Blackshear PJ. 1996. A pathogenetic role for TNF alpha in the syndrome of cachexia, arthritis, and autoimmunity resulting from tristetraprolin (TTP) deficiency. Immunity 4:445–454. doi: 10.1016/S1074-7613(00)80411-2. [DOI] [PubMed] [Google Scholar]
- 36.Carballo E, Blackshear PJ. 2001. Roles of tumor necrosis factor-alpha receptor subtypes in the pathogenesis of the tristetraprolin-deficiency syndrome. Blood 98:2389–2395. doi: 10.1182/blood.V98.8.2389. [DOI] [PubMed] [Google Scholar]
- 37.Tiedje C, Diaz-Munoz MD, Trulley P, Ahlfors H, Laass K, Blackshear PJ, Turner M, Gaestel M. 2016. The RNA-binding protein TTP is a global post-transcriptional regulator of feedback control in inflammation. Nucleic Acids Res 44:7418–7440. doi: 10.1093/nar/gkw474. [DOI] [PMC free article] [PubMed] [Google Scholar]
- 38.Sedlyarov V, Fallmann J, Ebner F, Huemer J, Sneezum L, Ivin M, Kreiner K, Tanzer A, Vogl C, Hofacker I, Kovarik P. 2016. Tristetraprolin binding site atlas in the macrophage transcriptome reveals a switch for inflammation resolution. Mol Syst Biol 12:868. doi: 10.15252/msb.20156628. [DOI] [PMC free article] [PubMed] [Google Scholar]
- 39.Gaba A, Grivennikov SI, Do MV, Stumpo DJ, Blackshear PJ, Karin M. 2012. Cutting edge: IL-10-mediated tristetraprolin induction is part of a feedback loop that controls macrophage STAT3 activation and cytokine production. J Immunol 189:2089–2093. doi: 10.4049/jimmunol.1201126. [DOI] [PMC free article] [PubMed] [Google Scholar]
- 40.Stoecklin G, Tenenbaum SA, Mayo T, Chittur SV, George AD, Baroni TE, Blackshear PJ, Anderson P. 2008. Genome-wide analysis identifies interleukin-10 mRNA as target of tristetraprolin. J Biol Chem 283:11689–11699. doi: 10.1074/jbc.M709657200. [DOI] [PMC free article] [PubMed] [Google Scholar]
- 41.Tudor C, Marchese FP, Hitti E, Aubareda A, Rawlinson L, Gaestel M, Blackshear PJ, Clark AR, Saklatvala J, Dean JL. 2009. The p38 MAPK pathway inhibits tristetraprolin-directed decay of interleukin-10 and pro-inflammatory mediator mRNAs in murine macrophages. FEBS Lett 583:1933–1938. doi: 10.1016/j.febslet.2009.04.039. [DOI] [PMC free article] [PubMed] [Google Scholar]
- 42.Dean JL, Sully G, Clark AR, Saklatvala J. 2004. The involvement of AU-rich element-binding proteins in p38 mitogen-activated protein kinase pathway-mediated mRNA stabilisation. Cell Signal 16:1113–1121. doi: 10.1016/j.cellsig.2004.04.006. [DOI] [PubMed] [Google Scholar]
- 43.Clark AR, Dean JL. 2016. The control of inflammation via the phosphorylation and dephosphorylation of tristetraprolin: a tale of two phosphatases. Biochem Soc Trans 44:1321–1337. doi: 10.1042/BST20160166. [DOI] [PMC free article] [PubMed] [Google Scholar]
- 44.Carballo E, Cao H, Lai WS, Kennington EA, Campbell D, Blackshear PJ. 2001. Decreased sensitivity of tristetraprolin-deficient cells to p38 inhibitors suggests the involvement of tristetraprolin in the p38 signaling pathway. J Biol Chem 276:42580–42587. doi: 10.1074/jbc.M104953200. [DOI] [PMC free article] [PubMed] [Google Scholar]
- 45.Chrestensen CA, Schroeder MJ, Shabanowitz J, Hunt DF, Pelo JW, Worthington MT, Sturgill TW. 2004. MAPKAP kinase 2 phosphorylates tristetraprolin on in vivo sites including Ser178, a site required for 14-3-3 binding. J Biol Chem 279:10176–10184. doi: 10.1074/jbc.M310486200. [DOI] [PubMed] [Google Scholar]
- 46.Stoecklin G, Stubbs T, Kedersha N, Wax S, Rigby WF, Blackwell TK, Anderson P. 2004. MK2-induced tristetraprolin:14-3-3 complexes prevent stress granule association and ARE-mRNA decay. EMBO J 23:1313–1324. doi: 10.1038/sj.emboj.7600163. [DOI] [PMC free article] [PubMed] [Google Scholar]
- 47.Gaestel M. 2013. What goes up must come down: molecular basis of MAPKAP kinase 2/3-dependent regulation of the inflammatory response and its inhibition. Biol Chem 394:1301–1315. doi: 10.1515/hsz-2013-0197. [DOI] [PubMed] [Google Scholar]
- 48.Fabian MR, Frank F, Rouya C, Siddiqui N, Lai WS, Karetnikov A, Blackshear PJ, Nagar B, Sonenberg N. 2013. Structural basis for the recruitment of the human CCR4-NOT deadenylase complex by tristetraprolin. Nat Struct Mol Biol 20:735–739. doi: 10.1038/nsmb.2572. [DOI] [PMC free article] [PubMed] [Google Scholar]
- 49.Marchese FP, Aubareda A, Tudor C, Saklatvala J, Clark AR, Dean JL. 2010. MAPKAP kinase 2 blocks tristetraprolin-directed mRNA decay by inhibiting CAF1 deadenylase recruitment. J Biol Chem 285:27590–27600. doi: 10.1074/jbc.M110.136473. [DOI] [PMC free article] [PubMed] [Google Scholar]
- 50.Sandler H, Kreth J, Timmers HT, Stoecklin G. 2011. Not1 mediates recruitment of the deadenylase Caf1 to mRNAs targeted for degradation by tristetraprolin. Nucleic Acids Res 39:4373–4386. doi: 10.1093/nar/gkr011. [DOI] [PMC free article] [PubMed] [Google Scholar]
- 51.Wang X, Liu Y. 2007. Regulation of innate immune response by MAP kinase phosphatase-1. Cell Signal 19:1372–1382. doi: 10.1016/j.cellsig.2007.03.013. [DOI] [PMC free article] [PubMed] [Google Scholar]
- 52.Smallie T, Ross EA, Ammit AJ, Cunliffe HE, Tang T, Rosner DR, Ridley ML, Buckley CD, Saklatvala J, Dean JL, Clark AR. 2015. Dual-specificity phosphatase 1 and tristetraprolin cooperate to regulate macrophage responses to lipopolysaccharide. J Immunol 195:277–288. doi: 10.4049/jimmunol.1402830. [DOI] [PMC free article] [PubMed] [Google Scholar]
- 53.Ross EA, Smallie T, Ding Q, O'Neil JD, Cunliffe HE, Tang T, Rosner DR, Klevernic I, Morrice NA, Monaco C, Cunningham AF, Buckley CD, Saklatvala J, Dean JL, Clark AR. 2015. Dominant suppression of inflammation via targeted mutation of the mRNA destabilizing protein tristetraprolin. J Immunol 195:265–276. doi: 10.4049/jimmunol.1402826. [DOI] [PMC free article] [PubMed] [Google Scholar]
- 54.Ross EA, Naylor AJ, O'Neil JD, Crowley T, Ridley ML, Crowe J, Smallie T, Tang TJ, Turner JD, Norling LV, Dominguez S, Perlman H, Verrills NM, Kollias G, Vitek MP, Filer A, Buckley CD, Dean JL, Clark AR. 5 September 2016 Treatment of inflammatory arthritis via targeting of tristetraprolin, a master regulator of pro-inflammatory gene expression. Ann Rheum Dis doi: 10.1136/annrheumdis-2016-209424. [DOI] [PMC free article] [PubMed] [Google Scholar]
- 55.Van Tubergen E, Vander Broek R, Lee J, Wolf G, Carey T, Bradford C, Prince M, Kirkwood KL, D'Silva NJ. 2011. Tristetraprolin regulates interleukin-6, which is correlated with tumor progression in patients with head and neck squamous cell carcinoma. Cancer 117:2677–2689. doi: 10.1002/cncr.25859. [DOI] [PMC free article] [PubMed] [Google Scholar]
- 56.Zhao W, Liu M, D'Silva NJ, Kirkwood KL. 2011. Tristetraprolin regulates interleukin-6 expression through p38 MAPK-dependent affinity changes with mRNA 3′ untranslated region. J Interferon Cytokine Res 31:629–637. doi: 10.1089/jir.2010.0154. [DOI] [PMC free article] [PubMed] [Google Scholar]
- 57.Kratochvill F, Gratz N, Qualls JE, Van De Velde LA, Chi H, Kovarik P, Murray PJ. 2015. Tristetraprolin limits inflammatory cytokine production in tumor-associated macrophages in an mRNA decay-independent manner. Cancer Res 75:3054–3064. doi: 10.1158/0008-5472.CAN-15-0205. [DOI] [PMC free article] [PubMed] [Google Scholar]
- 58.Tao X, Gao G. 2015. Tristetraprolin recruits eukaryotic initiation factor 4E2 to repress translation of AU-rich element-containing mRNAs. Mol Cell Biol 35:3921–3932. doi: 10.1128/MCB.00845-15. [DOI] [PMC free article] [PubMed] [Google Scholar]
- 59.Lacey DC, Achuthan A, Fleetwood AJ, Dinh H, Roiniotis J, Scholz GM, Chang MW, Beckman SK, Cook AD, Hamilton JA. 2012. Defining GM-CSF- and macrophage-CSF-dependent macrophage responses by in vitro models. J Immunol 188:5752–5765. doi: 10.4049/jimmunol.1103426. [DOI] [PubMed] [Google Scholar]
- 60.Krausgruber T, Blazek K, Smallie T, Alzabin S, Lockstone H, Sahgal N, Hussell T, Feldmann M, Udalova IA. 2011. IRF5 promotes inflammatory macrophage polarization and TH1-TH17 responses. Nat Immunol 12:231–238. doi: 10.1038/ni.1990. [DOI] [PubMed] [Google Scholar]
- 61.Smallie T, Ricchetti G, Horwood NJ, Feldmann M, Clark AR, Williams LM. 2010. IL-10 inhibits transcription elongation of the human TNF gene in primary macrophages. J Exp Med 207:2081–2088. doi: 10.1084/jem.20100414. [DOI] [PMC free article] [PubMed] [Google Scholar]
- 62.Adelman K, Kennedy MA, Nechaev S, Gilchrist DA, Muse GW, Chinenov Y, Rogatsky I. 2009. Immediate mediators of the inflammatory response are poised for gene activation through RNA polymerase II stalling. Proc Natl Acad Sci U S A 106:18207–18212. doi: 10.1073/pnas.0910177106. [DOI] [PMC free article] [PubMed] [Google Scholar]
- 63.Jalonen U, Nieminen R, Vuolteenaho K, Kankaanranta H, Moilanen E. 2006. Down-regulation of tristetraprolin expression results in enhanced IL-12 and MIP-2 production and reduced MIP-3alpha synthesis in activated macrophages. Mediators Inflamm 2006:40691. doi: 10.1155/MI/2006/40691. [DOI] [PMC free article] [PubMed] [Google Scholar]
- 64.Molle C, Zhang T, Ysebrant de Lendonck L, Gueydan C, Andrianne M, Sherer F, Van Simaeys G, Blackshear PJ, Leo O, Goriely S. 2013. Tristetraprolin regulation of interleukin 23 mRNA stability prevents a spontaneous inflammatory disease. J Exp Med 210:1675–1684. doi: 10.1084/jem.20120707. [DOI] [PMC free article] [PubMed] [Google Scholar]
- 65.Gu L, Ning H, Qian X, Huang Q, Hou R, Almourani R, Fu M, Blackshear PJ, Liu J. 2013. Suppression of IL-12 production by tristetraprolin through blocking NF-kcyB nuclear translocation. J Immunol 191:3922–3930. doi: 10.4049/jimmunol.1300126. [DOI] [PMC free article] [PubMed] [Google Scholar]
Associated Data
This section collects any data citations, data availability statements, or supplementary materials included in this article.