

Abstract
The neuroimaging literature on cerebral palsy (CP) has predominantly focused on identifying structural aberrations within the white matter (e.g., fiber track integrity), with very few studies examining neural activity within the key networks that serve the production of motor actions. The current investigation used high-density magnetoencephalography to begin to fill this knowledge gap by quantifying the temporal dynamics of the alpha and beta cortical oscillations in children with CP (age = 15.5 ± 3 years; GMFCS levels II–III) and typically developing (TD) children (age = 14.1 ± 3 years) during a goal-directed isometric target-matching task using the knee joint. Advanced beamforming methods were used to image the cortical oscillations during the movement planning and execution stages. Compared with the TD children, our results showed that the children with CP had stronger alpha and beta event-related desynchronization (ERD) within the primary motor cortices, premotor area, inferior parietal lobule, and inferior frontal gyrus during the motor planning stage. Differences in beta ERD amplitude extended through the motor execution stage within the supplementary motor area and premotor cortices, and a stronger alpha ERD was detected in the anterior cingulate. Interestingly, our results also indicated that alpha and beta oscillations were weaker in the children with CP within the occipital cortices and visual MT area during movement execution. These altered alpha and beta oscillations were accompanied by slower reaction times and substantial target matching errors in the children with CP. We also identified that the strength of the alpha and beta ERDs during the motor planning and execution stages were correlated with the motor performance. Lastly, our regression analyses suggested that the beta ERD within visual areas during motor execution primarily predicted the amount of motor errors. Overall, these data suggest that uncharacteristic alpha and beta oscillations within visuomotor cortical networks play a prominent role in the atypical motor actions exhibited by children with CP.
Keywords: Isometric, Lower extremity, Magnetoencephalography, Vision
Highlights
-
•
Children with CP performed an isometric task with the knee joint.
-
•
Children with CP had stronger alpha and beta ERD during motor planning.
-
•
These ERD differences extended through the motor execution period.
-
•
Occipital cortices and visual MT area alpha and beta ERD were weaker.
-
•
Altered alpha and beta ERD were accompanied by impaired motor actions.
1. Introduction
Cerebral palsy (CP) is the most prevalent pediatric neurologic impairment diagnosed in the United States (Christensen et al., 2014). Damage to the periventricular white matter areas during birth, or shortly after, is the most common cause (Bax et al., 2005). This damage reduces the fidelity of information that is transmitted along the thalamocortical and corticospinal tracts (Hoon et al., 2009), which of course results in a wide variation of sensorimotor impairments. Such variability in the nature and severity of impairments is an inherent characteristic of patients diagnosed with the CP umbrella term. Over 90% of these children have musculoskeletal impairments that result in slower and less coordinated motor actions (Abel and Damiano, 1996, Johnson et al., 1997, Norlin and Odenrick, 1986). These observations have fueled the original belief that the motor aberrations seen in children with CP primarily originated in the musculoskeletal machinery (Pin et al., 2006, Moreau et al., 2012, Blumetti et al., 2012, Dreher et al., 2012, Taylor et al., 2013). However, this hypothesis has been significantly challenged in recent years, as it is becoming widely recognized that the white matter damage seen in these children likely impacts activity within the key brain networks that are involved in processing sensory information and the production of motor actions (cf. Cramer et al., 2011, Graham et al., 2016). Understanding how the perinatal brain injuries found in children with CP may affect brain function in these key networks is crucial for advancing our understanding of the basic neurophysiology that underlies CP.
Data from electroencephalography (EEG), magnetoencephalography (MEG) and invasive electrocorticography (ECoG) experiments have shown that the cortical oscillatory activity in the beta range (15–30 Hz) decreases prior to the onset of movement, and that this decrease is largely sustained throughout the movement (Jurkiewicz et al., 2006, Miller et al., 2007, Wilson et al., 2010, Tzagarakis et al., 2010, Wilson et al., 2011, Wilson et al., 2014, Tzagarakis et al., 2015, Grent-'t-Jong et al., 2014, Heinrichs-Graham et al., 2014, Kurz et al., 2016). This response is typically referred to as the beta event-related desynchronization (ERD) and it involves bilateral neural activity across sensorimotor cortices, with the strongest maxima contralateral to the effector producing the motor action, which is consistent with the somatotopic/motortopic organization of the pre/post-central gyri. Additional areas of concurrent beta ERD activity often include the premotor area, supplementary motor area (SMA), parietal cortices and mid-cingulate. While these previous studies have advanced our understanding of how the healthy brain produces motor actions, we still have a limited understanding of the nature of these cortical oscillations in children with CP.
Neuroimaging studies of children with CP have historically focused on identifying structural aberrations within the white matter, with very limited attention toward understanding the altered neurophysiology of brain networks serving the production of motor actions (Carr et al., 1993, Maegaki et al., 1999, Staudt et al., 2002, Vandermeeren et al., 2003a, Vandermeeren et al., 2003b, Hoon et al., 2009, Holstrom et al., 2010). However, we have recently begun to address this substantial knowledge gap through the use of MEG imaging in children with CP. This work has shown that the beta ERD response is significantly stronger in the sensorimotor cortices of children with CP during the planning of knee extension movements (Kurz et al., 2014). These findings imply that the impaired leg motor actions seen in children with CP may be partially related to the inability to formulate a motor plan that predicts the ideal muscle synergies for achieving a motor goal. In the current investigation, we further interrogate the neurophysiology of motor control in children with CP by quantifying the strength of the cortical oscillations during a goal-directed, visuomotor, target-matching task that was performed with the knee joint. We chose a task requiring visuomotor transformations because visual feedback is critical to constructing an accurate motor plan, yet the role of visuomotor processing in CP-related movement abnormalities is completely unknown. Prior experimental work has shown that visual information processed in the occipital cortices is not only used for stimulus discrimination, but is also critical to online motor performance and may actually modulate the strength of the neural activity in motor areas during visuomotor tasks (Ledberg et al., 2007, Strigaro et al., 2015). Our primary hypothesis was that children with CP would have uncharacteristic beta oscillations relative to typically developing (TD) children in sensorimotor and occipital cortices during the planning and motor execution stages of the visuomotor target-matching task. Furthermore, we hypothesized that these altered beta oscillations would be correlated with reductions in movement accuracy in children with CP.
2. Materials and methods
2.1. Subjects
The Institutional Review Board at the University of Nebraska Medical Center reviewed and approved the protocol for this investigation. Thirteen children with CP that had a spastic diplegic presentation (age = 15.5 ± 3 years; 8 males; GMFCS levels II–III) and 15 typically developing children (age = 14.1 ± 3 years; 8 males) with no neurological or musculoskeletal impairments participated in this investigation. The children with CP were excluded if they had an orthopedic surgery or anti-spasticity treatments within the last 6-months or if the child had too low of cognition to follow directions. All of the parents provided written consent that their child could participate in the investigation and the children assented. None of the participating children had visible white or grey matter lesions that would have affected the integrity of the cortical surface in neural areas of interest (i.e., motor system, occipital, and inferior frontal gyrus). In addition, the participating children were not on any medication and did not have visual processing impairments.
2.2. MEG data acquisition and experimental paradigm
Neuromagnetic responses were sampled continuously at 1 kHz with an acquisition bandwidth of 0.1–330 Hz using an Elekta MEG system (Helsinki, Finland) with 306 magnetic sensors, including 204 planar gradiometers and 102 magnetometers. All recordings were conducted in a one-layer magnetically-shielded room with active shielding engaged for advanced environmental noise compensation. During data acquisition, the children were monitored via real-time audio-video feeds from inside the shielded room. A custom built head stabilization device that consisted of a series of inflatable airbags that surrounded the sides of the head and filled the void between the head and MEG dewar was worn for all data collections. This system stabilized the head and reduced the probability of any large head movements occurring during the data collections.
The children were seated upright in a magnetically silent chair during the experiment. A custom-built magnetically silent force transducer was developed for this investigation to measure the isometric knee extension forces generated by the children (Fig. 1A). This device consisted of a 20 × 10 cm airbladder that was inflated to 317 kPa, and fixed to the anterior portion of the lower leg just proximal to the lateral malleoli. A thermoplastic shell encased the outer portion of the airbladder and was secured to the chair with ridged strappings. Changes in the pressure of the airbag as the child generated an isometric contraction were quantified by an air pressure sensor (Phidgets Inc., Calgary, Alberta, CA) and were subsequently converted into units of force.
Fig. 1.
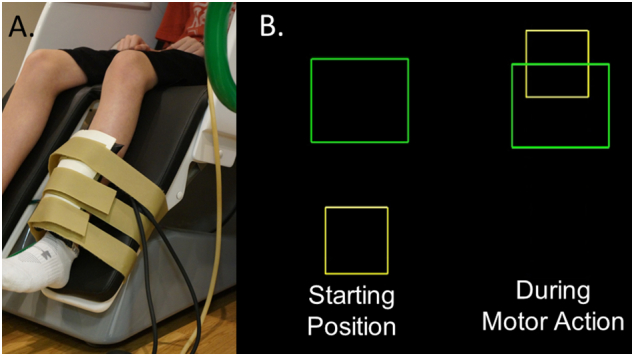
A) Depiction of the custom-built pneumatic force transducer that is positioned just proximal to the lateral malleolus of the child. B) The isometric knee extension force generated by the child animates the yellow box to ascend vertically to match the green target box. (For interpretation of the references to color in this figure legend, the reader is referred to the web version of this article.)
The experimental paradigm involved the child generating an isometric knee extension force that matched target forces that varied between 5 and 30% of the child's maximum isometric knee extension force across trials. The step size between the respective targets was one unit of force. The target force was visually displayed as a box and the force generated by the child was shown as a smaller box that was animated vertically, based on the isometric force generated (Fig. 1B). The children were instructed to match the presented targets as fast and as accurately as possible. The distinct target forces were presented in a random order, and a successful match occurred when the box that represented the child's isometric force was inside the target box for 0.3 s. A fixation cross was displayed on the screen after the child matched the target. The stimuli were shown on a back-projected screen that was approximately ~ 1 m in front of the child and at eye-level. The epochs of each trial were 10 s in duration (− 5.0 s to + 5.0 s), with the onset of the isometric force defined as 0.0 s. Hence, the child had 5 s to match the target and there was a minimum of 5 s of rest between targets. For the experiment, each child completed 120 target-matching trials in order to optimize the MEG signal-to-noise ratio.
2.3. MEG coregistration & structural MRI processing
Structural MRI data were acquired using a Philips Achieva 3 T scanner. High-resolution T1-weighted sagittal images were obtained with an eight-channel head coil using a 3D fast field echo sequence with the following parameters: FOV: 24 cm, 1 mm slice thickness, no gap, in-plane resolution of 1.0 × 1.0 mm and sense factor of 2.0.
Four coils were affixed to the head of the child and were used for continuous head localization during the MEG experiment. Prior to the experiment, the location of these coils, three fiducial points and the scalp surface were digitized to determine their three-dimensional position (Fastrak 3SF0002, Polhemus Navigator Sciences, Colchester, VT, USA). Once the child was positioned for the MEG recording, an electric current with a unique frequency label (e.g., 322 Hz) was fed to each of the four coils. This induced a measurable magnetic field and allowed each coil to be localized in reference to the sensors throughout the recording session. Since the coil locations were also known in head coordinates, all MEG measurements could be transformed into a common coordinate system. With this coordinate system (including the scalp surface points), each child's MEG data were coregistered with native space neuroanatomical MRI data using the three external landmarks (i.e., fiducials) and the digitized scalp surface points prior to source space analyses. The neuroanatomical MRI data were aligned parallel to the anterior and posterior commissures and transformed into standardized space using BESA MRI (Version 2.0; BESA GmbH, Gräfelfing, Germany).
2.4. MEG pre-processing, time-frequency transformation, & statistics
Using the MaxFilter software (Elekta), each MEG data set was individually corrected for head motion that may have occurred during task performance, and were subjected to noise reduction using the signal space separation method with a temporal extension (Taulu and Simola, 2006). Artifact rejection was based on a fixed threshold method, supplemented with visual inspection. The continuous magnetic time series was divided into epochs of 10.0 s in duration. For all time windows, 0.0 s was defined as the onset of the isometric force and the baseline was defined as − 3.6 to − 3.1 s. Artifact-free epochs for each sensor were transformed into the time-frequency domain using complex demodulation (resolution: 2.0 Hz, 0.025 s) and averaged over the respective trials. These sensor-level data were normalized by dividing the power value of each time-frequency bin by the respective bin's baseline power, which was calculated as the mean power during the baseline (− 3.6 to − 3.1 s). This baseline time window was selected based on our inspection of the sensor level absolute power data, which showed that this time window was quiet and temporally distant from the peri-movement oscillatory activity. The specific time-frequency windows used for imaging were determined by statistical analysis of the sensor-level spectrograms across the entire array of gradiometers. Each data point in the spectrogram was initially evaluated using a mass univariate approach based on the general linear model. To reduce the risk of false positive results while maintaining reasonable sensitivity, a two stage procedure was followed to control for Type 1 error. In the first stage, one-sample t-tests were conducted on each data point and the output spectrogram of t-values was thresholded at P < 0.05 to define time-frequency bins containing potentially significant oscillatory deviations across all participants and conditions. In stage two, time-frequency bins that survived the threshold were clustered with temporally and/or spectrally neighboring bins that were also above the (P < 0.05) threshold, and a cluster value was derived by summing all of the t-values of all data points in the cluster. Nonparametric permutation testing was then used to derive a distribution of cluster-values and the significance level of the observed clusters (from stage one) were tested directly using this distribution (Ernst, 2004, Maris and Oostenveld, 2007). For each comparison, at least 10,000 permutations were computed to build a distribution of cluster values.
2.5. MEG source imaging & statistics
A minimum variance vector beamforming algorithm was employed to calculate the source power across the entire brain volume (Gross et al., 2001). The single images were derived from the cross spectral densities of all combinations of MEG sensors, and the solution of the forward problem for each location on a grid specified by input voxel space. Following convention, the source power in these images were normalized per subject using a separately averaged pre-stimulus noise period of equal duration and bandwidth (van Veen et al., 1997, Hillebrand et al., 2005). Thus, the normalized power per voxel was computed over the entire brain volume per participant at 4.0 × 4.0 × 4.0 mm resolution. Each child's functional images, which were co-registered to anatomical images prior to beamforming, were transformed into standardized space using the transform previously applied to the structural MRI volume and spatially resampled. MEG pre-processing and imaging used the BESA software (BESA v6.0; Grafelfing, Germany).
Two-sample t-tests were used to calculate statistical parametric maps (SPM) showing regions with significant group differences in oscillatory activity. All images were thresholded at (P < 0.01) and a cluster-based correction method (i.e., 200 contiguous voxels), based on the theory of Gaussian random fields, was applied to the supra-threshold voxels to reduce the risk of false positive findings resulting from the multiple comparisons (Worsley et al., 1996, Worsley et al., 1999; cf. Wilson et al., 2015). Thus, we imaged these responses using beamforming, and statistically evaluated the resulting 3D maps of functional brain activity using a mass univariate approach based on the general linear model.
2.6. Motor behavioral data
The output of the force transducer was simultaneously collected at 1 kHz along with the MEG data, and was used to quantify the child's motor performance. The formulation of the motor plan was assumed to be represented by the child's reaction time, which was calculated based on the time from when the target was presented to when force production was initiated. The amount of error in the feedforward execution of the motor plan was behaviorally quantified based on the percent overshoot of the target. Finally, the time to match the target was used to quantify the online corrections that were made after the initial motor plan was executed. The online corrections were calculated based on the time difference between the reaction time and the time to reach the target.
Separate independent-samples t-tests were used to determine if there were differences in the behavioral performance of the TD children and children with CP. In addition, ERD peak amplitudes within clusters of significant oscillatory cortical activity during the motor planning and executions stages were extracted and correlated with the motor behavioral outcomes using Spearman rho rank order correlations. Stepwise regression models were also implemented as a follow-up to the correlational analyses. Essentially, when multiple ERD peaks were correlated with the respective behavioral variables during the motor planning and execution stages, stepwise regressions were used to determine the specific alpha and beta ERD peaks (i.e., regions) that best explained the variance seen within the motor behavioral variables. All of the statistical analyses involving the behavioral metrics were performed with SPSS statistical software (IBM, Armonk, NY) using a 0.05 alpha level. The false discovery rate algorithm was also used to adjust the alpha level of the t-tests and correlational analyses in order to control for the potential increase in familywise error rate that may have occurred due to the multiple statistical tests (Benjamin and Hochberg, 1995).
3. Results
3.1. Motor behavioral results
There were significant differences in the goal directed isometric forces generated by the children with CP and their TD peers. The children with CP had slower reaction times (CP = 0.67 ± 0.07 s; TD = 0.43 ± 0.02 s; P = 0.004), larger overshoot errors (CP = 75.7 ± 15%; TD = 42.6 ± 7%; P = 0.01), and took a longer time to match the targets (CP = 3.4 ± 0.2 s; TD = 2.8 ± 0.1 s; P = 0.006).
3.2. Sensor-level results
There were significant alpha (8–14 Hz) and beta (16–24 Hz) ERDs that were present in a large number of sensors near the sensorimotor cortex (Fig. 2; P < 0.0001, corrected). Collectively, these responses started about 0.5 s before movement onset and were sustained for 0.5 s afterward. Compared with the alpha ERD, the beta ERD continued throughout the duration of the target matching task. We independently imaged the alpha and beta ERD seen within the − 0.5 to 0 s and 0 to 0.5 s time windows using a baseline period of − 3.6 to − 3.1 s to identify the brain regions generating these oscillatory responses.
Fig. 2.

(A) Time-frequency spectrogram for a representative typically-developing participant. Frequency (Hz) is shown on the y-axis and time (s) is denoted on the x-axis, with 0.0 s defined as the onset of the isometric force. The event-related spectral changes during the isometric knee task are expressed as the percent difference from baseline (− 3.6 to − 3.1 s), with the scale shown to the far right. The MEG sensor with the greatest response amplitude is shown, which was located near the sensorimotor cortices and contralateral to the leg generating the force. As can be discerned, there was a strong decrease in the alpha (8–14 Hz) and beta (16–24 Hz) bands that started about 0.5 s prior to the initiation of the isometric force. The alpha band decrease (desynchronization) ceased at about 0.8 s, while the beta band activity was sustained while the participant attempted to match the prescribed targets. (B) A 2D map of the sensor array is shown to illustrate the gradiometer sensors where significant alpha (8–14 Hz) and beta (16–24 Hz) responses were detected, with a color legend to the far right. As shown, significant beta and alpha responses clustered around the sensorimotor cortices, and stretched toward the occipital cortices, with the beta-only sensors clustering anteriorly (near motor regions) and alpha-only sensors clustering posteriorly (near occipital cortex). Between these two extremes, many sensors contained both significant alpha and beta responses. Note that the black sensor-chip was not included in the sensor-level statistical analyses, as it was bad in several participants.
3.3. Alpha cortical oscillations
Performance of the target matching task elicited significant (P < 0.01, corrected) alpha oscillations bilaterally across fronto-parietal cortical areas during the motor planning period (− 0.5 to 0.0 s), with separate maxima within the leg region of the primary motor and pre-motor cortices of the left hemisphere, and the inferior parietal lobule and premotor cortices of the right hemisphere. During the motor execution stage (0 to 0.5 s), there were notable alpha oscillations present in the occipital cortices and anterior cingulate gyrus (P < 0.01, corrected). In regard to group effects, the children with CP had significantly stronger alpha ERD during the motor planning period (− 0.5 to 0.0 s) in bilateral primary motor cortices, left pre-motor cortices, right inferior parietal lobule, and right premotor cortices compared with the TD children (P < 0.01, corrected; Fig. 3A). During the motor execution period (0.0 to 0.5 s), the children with CP had weaker alpha ERD responses bilaterally within the occipital cortices, and a stronger alpha ERD in the anterior cingulate compared with the TD children (P < 0.01, corrected; Fig. 3B).
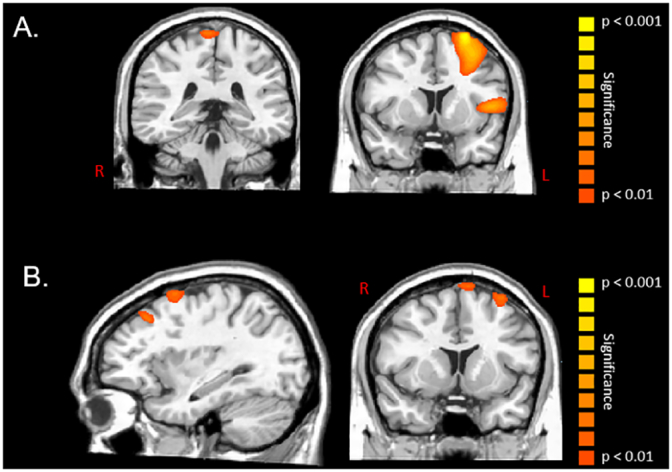
Fig. 3.

Statistical parametric maps (SPMs) of the group effect for alpha activity (8–14 Hz) during the motor planning stage (− 0.5 to 0 s) and motor execution stage (0 to 0.5 s) of the isometric knee target force matching task. The images have been thresholded at (P < 0.01, corrected) and are displayed following the radiological convention (R = L). As shown in panel A, there were wide spread significant differences in alpha event-related desynchronization (ERD) responses between the children with cerebral palsy and the typically-developing children within the bilateral primary motor cortices, left pre-motor cortices, right inferior parietal lobule and right premotor cortices during the planning of a motor action. All of these results indicated that the children with cerebral palsy had a stronger alpha ERD within the respective cortical areas during the motor planning stage. As shown in panel B, there were significant alpha differences in the occipital cortices bilaterally between the children with cerebral palsy and the typically developing children during movement execution. These results indicated that the children with cerebral palsy had a weaker alpha ERD within the occipital cortices during the motor execution stage.
The peak Talairach coordinates for each cluster in the group difference images are listed in Table 1. The amplitude of alpha oscillatory activity at each of these peaks, during both the motor planning and executions stages, were subsequently extracted for each participant and correlated with the motor behavioral variables. Our analysis of the data from all participants revealed that there was a negative rank order relationship between the reaction time and the strength of the alpha ERD within the right primary motor cortices during the motor planning stage (ρ = − 0.46, P = 0.014). This implies that a stronger alpha ERD within the motor cortices was associated with a slower reaction time. Additionally, there was a negative rank order correlation between the amount of error in matching the target and the strength of the alpha ERD in the primary motor cortices (ρ = − 0.45, P = 0.016) and right inferior parietal cortices (ρ = − 0.52; P = 0.005) during the motor planning stage. This indicated that a stronger alpha ERD within these cortical areas was associated with larger target matching errors. We also identified that there was a positive rank order correlation between the strength of the alpha ERD in the occipital cortices during the motor execution stage and the amount of error in matching the target (ρ = 0.66; P = 0.0001). This suggests that a weaker alpha ERD within the occipital cortices was related to greater errors in matching the targets. Lastly, we detected a positive rank order correlation between the time it took the children to match the target and the alpha ERD in the occipital cortices during the motor execution stage (ρ = 0.66; P = 0.0001). This suggests that a weaker alpha ERD in the occipital cortices during motor execution was associated with taking a longer time to accurately match the prescribed targets.
Table 1.
Peak Talairach coordinates for group difference clusters separated by frequency (alpha/beta) and movement stage (planning/execution).
| Frequency/stage | X | Y | Z | Area |
|---|---|---|---|---|
| Alpha (8–14 Hz) | ||||
| Motor planning | 18 | − 23 | 51 | Primary motor cortices |
| 52 | − 19 | 28 | Inferior parietal cortices | |
| − 23 | − 18 | 58 | Premotor cortices | |
| Motor execution | 10 | − 99 | − 2 | Occipital cortices |
| 2 | 9 | 38 | Cingulate gyrus | |
| Beta (16–24 Hz) | ||||
| Motor planning | 4 | − 34 | 68 | Primary motor cortices |
| − 25 | 4 | 64 | Premotor cortices | |
| − 47 | 4 | 8 | Inferior frontal gyrus | |
| Motor execution | − 31 | 6 | 60 | Premotor cortices |
| − 5 | − 3 | 68 | Supplementary motor area | |
| 9 | − 99 | 1 | Occipital cortices | |
| 61 | − 40 | − 11 | Visual MT |
In regard to the TD children specifically, there was a strong negative rank order correlation between the strength of the alpha ERD within the inferior parietal cortices during the motor planning period and the reaction time (ρ = − 0.79; P = 0.001). This implied that a stronger alpha ERD within the inferior parietal cortices was associated with a slower reaction time. For the children with CP, there was a strong positive correlation between the strength of the alpha ERD within the occipital cortices and the time it took them to match the target (ρ = 0.89; P = 0.0001). This indicated that a stronger alpha ERD was associated with the child needing less time to match the target. None of the other correlations were significant, although it should be noted that the group-specific correlations were less sensitive due to the decreased power associated with smaller samples.
3.4. Beta cortical oscillations
The target-matching motor task elicited significant (P < 0.01, corrected) beta oscillations bilaterally across the fronto-parietal cortical areas during the motor planning period (− 0.5 to 0.0 s), with separate maxima residing in the pre/postcentral gyri, SMA, and inferior/superior parietal cortices. In regard to group effects, the children with CP had a stronger beta ERD during the motor planning period (− 0.5 to 0.0 s) within the leg area of the primary motor cortices, as well as left premotor cortices and the left inferior frontal gyrus compared with the TD children (P < 0.01, corrected; Fig. 4A). During the motor execution period (0.0 to 0.5 s), this beta ERD activity continued to be statistically stronger for the children with CP in the left premotor cortices and also emerged in the SMA (P < 0.01, corrected; Fig. 4B). Finally, the children with CP had significantly weaker beta ERD bilaterally within the occipital cortices and visual MT area during motor execution (0.0 to 0.5 s) compared with the TD children (P < 0.01, corrected; Fig. 5).
Fig. 4.
Statistical parametric maps (SPMs) of the group effect for beta oscillations (16–24 Hz) during the motor planning (− 0.5 to 0 s) and execution stages (0 to 0.5 s) of the isometric knee target force matching task. The images have been thresholded at (P < 0.01, corrected) and are displayed following the radiological convention (R = L). As shown in panel A, there were significant differences in beta event-related desynchronization (ERD) responses between the children with cerebral palsy and the typically developing children within the leg area of the primary motor cortices, left inferior frontal gyrus, and left premotor cortex while planning the movements. These results indicated that the children with cerebral palsy had a stronger beta ERD within the respective cortical areas during the motor planning stage. As shown in panel B, there were significant beta differences between the children with cerebral palsy and the typically developing children within the supplementary motor area and left premotor cortices while executing the movement. These results indicated that the children with cerebral palsy had a stronger beta ERD within the respective cortical areas during the motor execution stage.
Fig. 5.
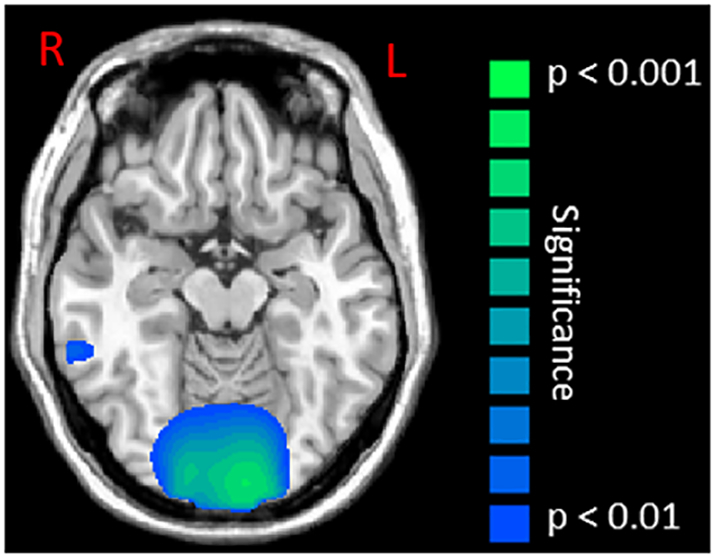
Statistical parametric maps (SPMs) of the group effect for beta oscillatory activity (16–24 Hz) in the occipital cortices during the motor execution stage (0 to 0.5 s). This image has been thresholded at (P < 0.01, corrected) and is displayed following the radiological convention (R = L). As shown, children with cerebral palsy had a weaker beta event-related desynchronization relative to typically developing children within the occipital cortices and visual MT area.
The peak Talairach coordinates for each cluster in the group difference images for beta activity are listed in Table 1. As with the alpha analyses, the amplitude of beta activity at each of these peaks during the motor planning and executions stages were extracted for each participant, and these data were correlated with the motor behavioral outcomes. Based on the data from all of the participants, this analysis revealed that there was a positive rank order correlation between the amount of error in matching the target and the strength of the beta ERD within the occipital cortices (ρ = 0.61, P = 0.0001) and visual MT area (ρ = 0.47, P = 0.006) during the motor execution stage. This implies that a weaker beta ERD within these cortical areas was associated with greater errors in matching the targets. We also found a positive rank order correlation between the time to match the target and the strength of the beta ERD within the occipital cortices (ρ = 0.45, P = 0.008) and visual MT area (ρ = 0.65, P = 0.0001) during the motor execution stage. This implies that a weaker beta ERD within these cortical areas was associated with the children taking a longer time to match the prescribed targets. After correcting the significance level for multiple comparisons, none of the beta ERD peaks were related to the reaction times seen in the participants (P > 0.01).
In the TD children specifically, there was a positive rank order correlation between the strength of the beta ERD within the occipital cortices during the motor execution period and the amount of error in matching the target (ρ = 0.62; P = 0.007). This implied that a stronger beta ERD within the occipital cortices was associated with smaller errors in matching the targets. We also found a positive correlation between the strength of the beta ERD within the visual MT area and the time it took the TD children to match the target (ρ = 0.65; P = 0.004). This suggested that a stronger beta ERD within the visual MT area was associated with the TD children taking less time to match the targets. After statistically correcting the significance level for multiple comparisons, none of the beta ERD findings were correlated with the behavioral performance seen in the children with CP (P > 0.004).
3.5. Regression analyses
Stepwise regression models were implemented to further evaluate which alpha and beta ERDs identified in the correlation analysis best explained the variance seen within the respective motor performance variables. These follow-up analyses were only performed with the results from all of the participants since none of individual group results had more than one ERD variable that was correlated with the respective motor behavioral results. Our regression analyses revealed that the strength of the beta ERD within the visual MT area during motor execution was the primary variable, as it significantly explained 56% of the variance seen in the time to match the target (F = 26.8; P = 0.0001; ΔR2 = 0.56). This regression model for motor execution was further improved when the beta ERD in the occipital cortices was added to the model (F = 3.88; P = 0.0001; ΔR2 = 0.11), as it explained an additional 11% of the variance seen in the time to match the target. Thus, together, the beta ERD within visual MT and occipital cortical areas explained 67% of the variance in the participants' time to match the targets. Lastly, the strength of the beta ERD in the occipital area during motor execution alone significantly explained 21% of the variance seen in the amount of error that occurred when the participants tried to match the targets (F = 5.5; P = 0.02; ΔR2 = 0.21).
4. Discussion
We currently have a substantial knowledge gap in our understanding of how CP affects neural activity within the key cortical networks that are involved in the production of motor actions. This investigation used high-density MEG to begin to fill this knowledge gap by quantifying the dynamics of cortical oscillations in a cohort of children with CP as they performed a goal-directed, isometric, target-matching task with the knee joint. At the onset of this investigation we were primarily driven to explore the potential differences in the beta cortical oscillations. This premise was based on our prior investigation that identified that alterations in these cortical oscillations might be the neurophysiological nexus of the motor aberrations seen in children with CP (Kurz et al., 2014). However, the data driven approach employed in this investigation revealed that there were prominent differences in both alpha and beta oscillatory activity throughout the distributed cortical motor network during the planning and execution of isometric force. In addition, our results are the first to show that alpha and beta oscillations within visual processing areas were also different in the children with CP during the motor execution stage. Altogether these results suggest that abnormal alpha and beta cortical oscillations likely play a central role in the impaired motor actions of children with CP.
One of our key findings was that children with CP exhibited stronger alpha and beta ERD within the primary motor cortices, inferior parietal cortices and left premotor area during the motor planning stage. These results complement the outcomes from our prior investigation where children with CP performed a cued knee-extension motor task (Kurz et al., 2014). Taken together, the results of these studies imply that the altered alpha and beta ERD seen within these key cortical networks might reflect difficulty in the formulation of an effective motor plan that will accurately achieve the desired goal. This notion was supported by the behavioral outcomes of this study, where we observed that the children with CP took longer to generate a muscular force, and selected a muscular force that overshot the presented targets by 70%.
The children with CP also exhibited a stronger beta ERD within the left inferior frontal gyrus during the motor planning stage. A recent EEG investigation has identified that the beta oscillations seen in this area are associated with tasks that require sustained vigilance (Kim et al., 2017). Based on this finding, it is possible that the stronger beta ERD may indicate that the children with CP had greater difficulty sustaining their attention on the motor task demands. However, this interpretation is speculative since attention was not measured directly in this investigation. Alternatively, it is conceivable that the inferior frontal gyrus was recruited to compensate for the executive planning that was necessary for matching the prescribed target forces.
Stronger beta ERD activity in the children with CP continued during the motor execution stage in the SMA and left premotor area. Previous brain imaging studies have established that these neural areas are part of a distributed network that serves the production of motor actions (Jurkiewicz et al., 2006, Miller et al., 2007, Wilson et al., 2010, Wilson et al., 2011, Wilson et al., 2013, Wilson et al., 2014, Tzagarakis et al., 2010, Heinrichs-Graham et al., 2014, Grent-'t-Jong et al., 2014, Tzagarakis et al., 2015, Kurz et al., 2016). Given this, the atypical beta oscillations likely reflect disturbances in the distributed motor network as the children with CP attempt to successfully perform the knee target matching motor task. This inference is supported by our behavioral results, which showed that the children with CP had greater motor execution errors, and spent more time correcting their ongoing motor actions in order to match the target force.
Our results also revealed that the children with CP had stronger alpha ERD within the dorsal region of the anterior cingulate cortex. Prior MEG and PET studies have suggested that this cortical area is involved in the unconscious monitoring of the consequences of a selected motor action (Cheyne et al., 2012, Paus, 2001, Paus et al., 1993). Hence, we suspect that the stronger alpha ERD (i.e., hyperactivity) seen in the children with CP may indicate that they have greater difficulty in monitoring the consequence of their ongoing motor actions. Alternatively, we suggest that this stronger activation may represent a heightened need to monitor if the intended motor action should be further accelerated or suppressed to match the target force because there is greater uncertainty in the motor plan.
Remarkably, our results showed that the children with CP had abnormally weak alpha and beta ERD activity within the occipital cortices and visual MT areas during the motor execution stage. It is well known that neurons in the visual MT area are sensitive to the motion and speed of visual stimuli (Ilg, 2008). In addition, prior experimental work has suggested that visual processing within occipital cortices can modulate the strength of activity within the cortical motor network during the performance of a visuomotor task (Ledberg et al., 2007, Strigaro et al., 2015). Thus, the reduced oscillations seen in visual areas of the children with CP might indicate greater difficulty in performing the visuomotor transformations, which were necessary to accurately follow and place the animated box within the target. These results were not completely unexpected, as our appreciation of visual processing impairments in children with CP has become more prominent in the recent clinical literature (Denver et al., 2016, Salavati et al., 2014, De Costa et al., 2004, De Costa and Pereira, 2014). However, the majority of clinical assessments in this domain are primarily based on visual acuity tests, rather than tests that access the visual processing of movement relevant stimuli. Interestingly, none of our participants had visually-discernable damage within occipital regions on their high-resolution structural MRI. This implies that the perinatal brain damage that occurred in the participating children with CP might have had cascading effects that indirectly impacted visual processing areas of the brain and/or their interrelationship with motor areas. These findings and their implications highlight the need for further studies focusing on how CP affects activity within visuomotor networks. Addressing this knowledge gap may provide a new framework for understanding and treating the aberrant motor actions seen in children with CP.
Our correlational results implied that a stronger ERD within the primary motor cortices and the inferior parietal cortices were associated with a slower reaction time and a greater amount of error in matching the targets. Moreover, these correlation analyses also showed that a weaker alpha and beta ERD within the occipital and visual MT cortical areas were associated with greater errors in matching the targets and a longer time to match the targets. Together, these correlations provide further support for the notion that the altered alpha and beta ERDs seen in children with CP during the motor planning and execution stages are likely indicative of their deficient motor performance. Furthermore, these findings highlight that the cortical computations that are necessary for planning a motor action and making visuomotor transformations are likely central to the error prone motor actions seen in children with CP. Our correlational findings also implied that the connection between the alpha ERD and motor performance mainly occurred during the motor planning stage, whereas the connection between beta ERD and motor performance occurred primarily during the motor execution stage. These preliminary observations might imply that changes in the alpha ERD primarily represent the certainty of the selected motor plan, while changes in the beta ERD are more related to the execution of the motor plan.
Finally, our follow-up regression analyses indicated that the beta ERD responses within the visual MT and occipital cortical areas during motor execution were the primary variables contributing to the target matching motor performance across all participants. These results further support that the neural activity in these cortical areas likely played a role in the visuomotor transformations that were necessary to perform the task. Additionally, these preliminary analyses raise questions about the contribution of the abnormal activity seen in other brain areas of children with CP. Future investigations of the activity seen within visual MT and occipital cortices are warranted to fully understand the neurophysiology of CP.
This study represents one of the few investigations that has sought to identify how the perinatal brain injuries seen in children with CP affects functional brain activity in the key brain networks that serve the production of a motor action. However, these results bring forth new questions about the observed differences in the alpha and beta cortical oscillations that underlie the impaired motor actions seen in children with CP. Based on our results, we cannot discern if the altered alpha and beta cortical oscillations represent a basic mechanism that is associated with the neurophysiology of CP, or whether the perinatal brain injuries experienced by these children alters spontaneous (resting) beta and alpha responses such that the ERD threshold for a motor action might be affected (Heinrichs-Graham and Wilson, 2016, Wilson et al., 2014). If this were the case, we would suspect that comparable differences in the beta and alpha ERD would be detectable during upper extremity motor actions. Further assessment of these alternative explanations are needed to fully understand the neurophysiology of children with CP.
5. Conclusion
In this study, we demonstrated altered alpha and beta oscillatory activity in children with CP across a distributed network of cortical motor regions during the planning and execution of a knee-joint isometric motor force task. Moreover, this investigation is the first to show that these same children have altered activity within visual processing areas and frontal regions involved in executive control. Collectively, this atypical cortical activity likely plays a prominent role in the error prone motor actions seen in the children with CP. We suggest that the alpha and beta ERD measures used in this investigation may provide a new metric for understanding the motor performance deficits seen in children with CP, and may provide a way to gauge the success of the evolving task-orientated physical therapy approaches that are being used to teach these children new motor skills.
Acknowledgements
This work was partially supported by grants from the National Institutes of Health (5R21-HD077532, 1R01-HD086245) and the National Science Foundation (NSF 1539067).
References
- Abel M.F., Damiano D.L. Strategies for increasing walking speed in diplegic cerebral palsy. J. Pediatr. Orthop. 1996;16:753–758. doi: 10.1097/00004694-199611000-00010. [DOI] [PubMed] [Google Scholar]
- Bax M., Goldstein M., Rosenbaum P., Leviton A., Paneth N., Dan B., Jacobsson B., Damiano D. Proposed definition and classification of cerebral palsy. Dev. Med. Child Neurol. 2005;47:571–576. doi: 10.1017/s001216220500112x. [DOI] [PubMed] [Google Scholar]
- Benjamin Y., Hochberg Y. Controlling the false discovery rate: a practical and powerful approach to multiple testing. J. R. Stat. Soc. Ser. B. 1995;57(1):289–300. [Google Scholar]
- Blumetti F.C., Wu J.C.N., Bau K.V., Martin B., Hobson S.A., Axt M.W., Selber P. Orthopedic surgery and mobility goals for children with cerebral palsy GMFCS level IV: what are we setting out to achieve? J. Child. Orthop. 2012;6:485–490. doi: 10.1007/s11832-012-0454-7. [DOI] [PMC free article] [PubMed] [Google Scholar]
- Carr L.J., Harrison L.M., Evans A.L., Stephens J.A. Patterns of central motor reorganization in hemiplegic cerebral palsy. Brain. 1993;116:1223–1247. doi: 10.1093/brain/116.5.1223. [DOI] [PubMed] [Google Scholar]
- Cheyne D.O., Ferrari P., Cheyne J.A. Intended actions and unexpected outcomes: automatic and controlled processing in a rapid motor task. Front. Hum. Neurosci. 2012;6(237):1–15. doi: 10.3389/fnhum.2012.00237. [DOI] [PMC free article] [PubMed] [Google Scholar]
- Christensen D., Van Naarden B.K., Doernberg N.S., Maenner M.J., Arneson C.L., Durkin M.S., Benedict R.E., Kirby R.S., Wingate M.S., Fitzgerald R., Yeargin-Allsopp M. Prevalence of cerebral palsy, co-occurring autism spectrum disorders, and motor functioning – autism and developmental disabilities monitoring network, USA. Dev. Med. Child Neurol. 2014;56(59–65):2014. doi: 10.1111/dmcn.12268. [DOI] [PMC free article] [PubMed] [Google Scholar]
- Cramer S.C., Sur M., Dobkin B.H., O'Brien C., Sanger T.D., Trojanowski J.Q., Rumsey J.M., Hicks R., Cameron J., Chen D., Chen W.G., Cohen L.G., deCharms C., Duffy C.J., Eden G.F., Fetz E.E., Filart R., Freund M., Grant S.J., Haber S., Kalivas P.W., Kolb B., Kramer A.F., Lynch M., Mayberg H.S., McQuillen P.S., Nitkin R., Pascual-Leone A., Reuter-Lorenz P., Schiff N., Sharma A., Shekim L., Stryker M., Sullivan E.V., Vinogradov S. Harnessing neuroplasticity for clinical applications. Brain. 2011;134(6):1591–1609. doi: 10.1093/brain/awr039. [DOI] [PMC free article] [PubMed] [Google Scholar]
- De Costa M.F., Pereira J.C. Correlations between color perception and motor function impairment in children with spastic cerebral palsy. Behav. Brain Funct. 2014;10:22. doi: 10.1186/1744-9081-10-22. [DOI] [PMC free article] [PubMed] [Google Scholar]
- De Costa M., Salomao S.R., Berezovsky A., Haro F.M., Ventura D.F. Relationship between vision and motor impairment in children with spastic cerebral palsy: new evidence from electrophysiology. Behav. Brain Res. 2004;149:145–150. doi: 10.1016/s0166-4328(03)00223-7. [DOI] [PubMed] [Google Scholar]
- Denver B.D., Froude E., Rosenbaum P., Wilkes-Gillan S., Imms C. Measurement of visual ability in children with cerebral palsy: a systematic review. Dev. Med. Child Neurol. 2016;58(10):1016–1029. doi: 10.1111/dmcn.13139. [DOI] [PubMed] [Google Scholar]
- Dreher T., Wolf S.I., Maier M., Hagmann S., Vegvari D., Gantz S., Heitzmann D., Wenz W., Braatz F. Long-term results after distal rectus femoris transfer as part of multilevel surgery for the correction of stiff-knee gait in spastic diplegic cerebral palsy. J. Bone Joint Surg. 2012;94:1–10. doi: 10.2106/JBJS.K.01300. [DOI] [PubMed] [Google Scholar]
- Ernst M.D. Permutation methods: a basis for exact inference. Stat. Sci. 2004;19(4):676–685. [Google Scholar]
- Graham H.K., Rosenbaum P., Paneth N., Lin J.P., Damiano D.L., Becher J.G., Gaebler-Spira D., Colver A., Reddigough D.S., Crompton K.E., Lieber R.L. Cerebral palsy. Nat. Rev. Dis. Prim. 2016;2:15082. doi: 10.1038/nrdp.2015.82. [DOI] [PMC free article] [PubMed] [Google Scholar]
- Grent-'t-Jong T., Oostenveld R., Jensen O., Medendorp W.P., Praamstra P. Competitive interactions in sensorimotor cortex: oscillations express separation between alternative movement targets. J. Neurophysiol. 2014;112(2):224–232. doi: 10.1152/jn.00127.2014. [DOI] [PMC free article] [PubMed] [Google Scholar]
- Gross J., Kujala J., Hamalainen M., Timmermann L., Schnitzler A., Salmelin R. Dynamic imaging of coherent sources: studying neural interactions in the human brain. Proc. Natl. Acad. Sci. 2001;98:694–699. doi: 10.1073/pnas.98.2.694. [DOI] [PMC free article] [PubMed] [Google Scholar]
- Heinrichs-Graham E., Wilson T.W. Is an absolute level of cortical beta suppression required for proper movement? Magnetoencephalographic evidence for healthy aging. NeuroImage. 2016;134:514–521. doi: 10.1016/j.neuroimage.2016.04.032. [DOI] [PMC free article] [PubMed] [Google Scholar]
- Heinrichs-Graham E., Wilson T.W., Santamaria P.M., Heithoff S.K., Torres-Russotto D., Hutter-Saunders J.A., Estes K.A., Meza J.L., Mosley R.L., Gendelman H.E. Neuromagnetic evidence of abnormal movement-related beta desynchronization in Parkinson's disease. Cereb. Cortex. 2014;24(10):2669–2678. doi: 10.1093/cercor/bht121. [DOI] [PMC free article] [PubMed] [Google Scholar]
- Hillebrand A., Singh K.D., Holliday I.E., Furlong P.L., Barnes G.R. A new approach to neuroimaging with magnetoencephalography. Hum. Brain Mapp. 2005;25:199–211. doi: 10.1002/hbm.20102. [DOI] [PMC free article] [PubMed] [Google Scholar]
- Holstrom L., Vollmer B., Tedroff K., Islam M., Persson J.K., Kits A., Forssberg H., Eliasson A.C. Hand function in relation to brain lesions and corticomotor-projection pattern in children with unilateral cerebral palsy. Dev. Med. Child Neurol. 2010;52:145–152. doi: 10.1111/j.1469-8749.2009.03496.x. [DOI] [PubMed] [Google Scholar]
- Hoon A.H., Stashinko E.E., Nagae L.M., Lin D.D., Keller J., Bastian A., Campbell M., Levey E., Mori S., Johnston M.V. Sensory and motor deficits in children with cerebral palsy born preterm correlate with diffusion tensor imaging abnormalities in thalamocortical pathways. Dev. Med. Child Neurol. 2009;51(9):697–704. doi: 10.1111/j.1469-8749.2009.03306.x. [DOI] [PMC free article] [PubMed] [Google Scholar]
- Ilg U.G. The role of areas MT and MST in coding visual motion underlying the execution of smooth pursuit. Vis. Res. 2008;48:2062–2069. doi: 10.1016/j.visres.2008.04.015. [DOI] [PubMed] [Google Scholar]
- Johnson D.C., Damiano D.L., Abel M.F. The evolution of gait in childhood and adolescent cerebral palsy. J. Pediatr. Orthop. 1997;17:392–396. [PubMed] [Google Scholar]
- Jurkiewicz M.T., Gaetz W.C., Bostan A.C., Cheyne D. Post-movement beta rebound is generated in the motor cortex: evidence from neuromagnetic recordings. NeuroImage. 2006;32:1281–1289. doi: 10.1016/j.neuroimage.2006.06.005. [DOI] [PubMed] [Google Scholar]
- Kim J., Kim D., Im C. Brain areas responsible for vigilance: an EEG source imaging study. Brain Topogr. 2017;30(3):343–351. doi: 10.1007/s10548-016-0540-0. [DOI] [PubMed] [Google Scholar]
- Kurz M.J., Becker K.M., Heinrichs-Graham E., Wilson T.W. Neurophysiological abnormalities in the sensorimotor cortices during the motor planning and movement execution stages of children with cerebral palsy. Dev. Med. Child Neurol. 2014;56(11):1072–1077. doi: 10.1111/dmcn.12513. [DOI] [PMC free article] [PubMed] [Google Scholar]
- Kurz M.J., Proskovec A.L., Gehringer J.E., Becker K.M., Arpin D.J., Heinrichs-Graham E., Wilson T.W. Developmental trajectory of beta cortical oscillatory activity during a knee motor task. Brain Topogr. 2016;29(6):824–833. doi: 10.1007/s10548-016-0500-8. [DOI] [PMC free article] [PubMed] [Google Scholar]
- Ledberg A., Bressler S.L., Ding M., Coppola R., Nakamura R. Large-scale visuomotor integration in the cerebral cortex. Cereb. Cortex. 2007;17:44–62. doi: 10.1093/cercor/bhj123. [DOI] [PubMed] [Google Scholar]
- Maegaki Y., Maeoka Y., Ishii S., Eda I., Ohtagaki A., Kitahara T., Suzuki N., Yoshino K., Ieshima A., Koeda T., Taakeshita K. Central motor reorganization in cerebral palsy patients with bilateral cerebral lesions. Pediatr. Res. 1999;45:559–567. doi: 10.1203/00006450-199904010-00016. [DOI] [PubMed] [Google Scholar]
- Maris E., Oostenveld R. Nonparametric statistical testing of EEG- and MEG-data. J. Neurosci. Methods. 2007;164(1):177–190. doi: 10.1016/j.jneumeth.2007.03.024. [DOI] [PubMed] [Google Scholar]
- Miller K.J., Leuthardt E.C., Schalk G., Rao R.P.N., Anderson N.R., Moran D.W., Miller J.W., Ojemann J.G. Spectral changes in cortical surface potentials during motor movement. J. Neurosci. 2007;27(9):2424–2432. doi: 10.1523/JNEUROSCI.3886-06.2007. [DOI] [PMC free article] [PubMed] [Google Scholar]
- Moreau N.G., Falvo M., Damiano D.L. Rapid force generation is impaired in cerebral palsy and is related to decreased muscle size and functional mobility. Gait Posture. 2012;35:154–158. doi: 10.1016/j.gaitpost.2011.08.027. [DOI] [PMC free article] [PubMed] [Google Scholar]
- Norlin R., Odenrick P. Development of gait in spastic children with cerebral palsy. J. Pediatr. Orthop. 1986;6:674–680. doi: 10.1097/01241398-198611000-00006. [DOI] [PubMed] [Google Scholar]
- Paus T. Primate anterior cingulate cortex: where motor control, drive and cognition interface. Nat. Rev. Neurosci. 2001;2:417–424. doi: 10.1038/35077500. [DOI] [PubMed] [Google Scholar]
- Paus T., Petrides M., Evans A.C., Meyer E. Role of the human anterior cingulate cortex in the control of oculomotor, manual, and speech responses: a positron emission tomography study. J. Neuro-Oncol. 1993;70:453–469. doi: 10.1152/jn.1993.70.2.453. [DOI] [PubMed] [Google Scholar]
- Pin T., Dyke P., Chan M. The effectiveness of passive stretching in children with cerebral palsy. Dev. Med. Child Neurol. 2006;48:855–862. doi: 10.1017/S0012162206001836. [DOI] [PubMed] [Google Scholar]
- Salavati M., Rameckers E.A.A., Steenbergen B., Van Der Schans C. Gross motor function, functional skills and caregiver assistance in children with spastic cerebral palsy (CP) with and without cerebral visual impairment (CVI) Eur. J. Phys. 2014;16:159–167. [Google Scholar]
- Staudt M., Grodd W., Gerloff C., Erb M., Stitz J., Krageloh-Mann I. Two types of ipsilateral reorganization in congenital hemiparesis a TMS and fMRI study. Brain. 2002;125:2222–2237. doi: 10.1093/brain/awf227. [DOI] [PubMed] [Google Scholar]
- Strigaro G., Ruge D., Chen J., Marshall L., Desikan M., Cantello R., Rothwell J.C. Interaction between visual and motor cortex: a transcranial magnetic stimulation study. J. Physiol. 2015;593(10):2365–2377. doi: 10.1113/JP270135. [DOI] [PMC free article] [PubMed] [Google Scholar]
- Taulu S., Simola J. Spatiotemporal signal space separation method for rejecting nearby interference in MEG measurements. Phys. Med. Biol. 2006;51(7):1759–1768. doi: 10.1088/0031-9155/51/7/008. [DOI] [PubMed] [Google Scholar]
- Taylor N.R., Dodd K.J., Baker R.J., Willoughby K., Thomason P., Graham H.K. Progressive resistance training and mobility-related function in young people with cerebral palsy: a randomized controlled trial. Dev. Med. Child Neurol. 2013;55:806–812. doi: 10.1111/dmcn.12190. [DOI] [PubMed] [Google Scholar]
- Tzagarakis C., Ince N.F., Leuthold A.C., Pellizzer G.P. Beta-band activity during motor planning reflects response uncertainty. J. Neurosci. 2010;30(4):11270–11277. doi: 10.1523/JNEUROSCI.6026-09.2010. [DOI] [PMC free article] [PubMed] [Google Scholar]
- Tzagarakis C., West S., Pellizzer G. Brain oscillatory activity during motor preparation: effect of directional uncertainty on beta, but not alpha, frequency band. Front. Neurosci. 2015;9:1–13. doi: 10.3389/fnins.2015.00246. [DOI] [PMC free article] [PubMed] [Google Scholar]
- Vandermeeren Y., Bastings E., Fadiga L., Olivier E. Long-latency motor evoked potentials in congenital hemiplegia. Clin. Neurophysiol. 2003;114:1808–1818. doi: 10.1016/s1388-2457(03)00161-5. [DOI] [PubMed] [Google Scholar]
- Vandermeeren Y., Sebire G., Grandin C.B., Thonnard J.L., Schlogel X., De Volder A.G. Functional reorganization of brain in children affected with congenital hemiplegia: fMRI study. NeuroImage. 2003;20(1):289–301. doi: 10.1016/s1053-8119(03)00262-3. [DOI] [PubMed] [Google Scholar]
- van Veen B.D., van Drongelen W., Yuchtman M., Suzuki A. Localization of brain electrical activity via linearly constrained minimum variance spatial filtering. IEEE Trans. Biomed. Eng. 1997;44:867–880. doi: 10.1109/10.623056. [DOI] [PubMed] [Google Scholar]
- Wilson T.W., Slason E., Asherin R., Kronberg E., Teale P.D., Reite M.L., Rojas D.C. An extended motor network generates beta and gamma oscillatory perturbations during development. Brain Cogn. 2010;73(2):75–84. doi: 10.1016/j.bandc.2010.03.001. [DOI] [PMC free article] [PubMed] [Google Scholar]
- Wilson T.W., Slason E., Asherin R., Kronberg E., Teale P.D., Reite M.L., Rojas D.C. Abnormal gamma and beta MEG activity during finger movements in early-onset psychosis. Dev. Neuropsychol. 2011;36(5):596–613. doi: 10.1080/87565641.2011.555573. [DOI] [PMC free article] [PubMed] [Google Scholar]
- Wilson T.W., Heinrichs-Graham E., Robertson K.R., Sandkovsky U., O'Neill J., Knott N.L., Fox H.S., Swindells S. Functional brain abnormalities during finger-tapping in HIV-infected older adults: a magnetoencephalography study. J. Neuroimmune Pharmacol. 2013;8(4):965–974. doi: 10.1007/s11481-013-9477-1. [DOI] [PMC free article] [PubMed] [Google Scholar]
- Wilson T.W., Heinrichs-Graham E., Becker K.M. Circadian modulation of motor-related beta oscillatory responses. NeuroImage. 2014;102:531–539. doi: 10.1016/j.neuroimage.2014.08.013. [DOI] [PMC free article] [PubMed] [Google Scholar]
- Wilson T.W., Heinrichs-Graham E., Becker K.M., Aloi J., Robertson K.R., Sandkovsky U., O'Neill J., Fox N.L., Knott N.L., Swidells S. Multimodal neuroimaging evidence of alterations in cortical structure and function in HIV-infected older adults. Hum. Brain Mapp. 2015;36(3):897–910. doi: 10.1002/hbm.22674. [DOI] [PMC free article] [PubMed] [Google Scholar]
- Worsley K.J., Marrett S., Neelin P., Vandal A.C., Friston K.J., Evans A.C. A unified statistical approach for determining significant signals in images of cerebral activation. Hum. Brain Mapp. 1996;4:58–73. doi: 10.1002/(SICI)1097-0193(1996)4:1<58::AID-HBM4>3.0.CO;2-O. [DOI] [PubMed] [Google Scholar]
- Worsley K.J., Andermann M., Koulis T., MacDoald D., Evans A.C. Detecting changes in nonisotropic images. Hum. Brain Mapp. 1999;8:98–101. doi: 10.1002/(SICI)1097-0193(1999)8:2/3<98::AID-HBM5>3.0.CO;2-F. [DOI] [PMC free article] [PubMed] [Google Scholar]