

Abstract
Background
Although structural neuroimaging methods have been widely used to study brain morphology in schizophrenia, synthesizing this literature has been difficult. With the increasing popularity of voxel-based morphometric (VBM) methods where group differences are reported in standardized coordinates, it is possible to apply powerful meta-analytic techniques initially designed for functional neuroimaging. In the present manuscript, we perform a voxel-wise, coordinate-based meta-analysis to better conceptualize the neuroanatomic correlates of schizophrenia.
Methods
Thirty-one peer-reviewed articles, with a total of 1,195 patients with schizophrenia contrasted with 1,262 healthy volunteers, were included in the meta-analysis. Coordinates from each article were used to create a statistical map that estimated the likelihood of between group gray matter density differences at every brain voxel. These results were subsequently entered into a network analysis.
Results
Patients had reduced gray matter density relative to controls in a distributed network of regions, including bilateral insular cortex, anterior cingulate, left parahippocampal gyrus, left middle frontal gyrus, postcentral gyrus, and thalamus. Network analysis grouped these regions into four distinct networks that potentially represent different pathological processes. Patients had increased gray matter density in striatal regions.
Conclusions
The current study expands on previous meta-analyses of the neruoanatomy of schizophrenia by elucidating a series of brain networks disrupted by the illness. As it is possible that these networks are influenced by independent etiological factors, this work should foster more detailed neural models of the illness and focus research designed to discover the mechanisms of gray matter reduction in schizophrenia.
Keywords: schizophrenia, gray matter density, voxel-based morphometry, meta-analysis, network analysis
Introduction
Structural neuroimaging methods have been widely used to study brain morphology in schizophrenia, providing important information about possible pathophysiological mechanisms of this debilitating illness. Since Johnstone and colleagues (1) seminal findings of increased lateral ventricular size in patients with schizophrenia, over 300 peer-reviewed articles have delineated the subtle neuroanatomic abnormalities in the illness. However, synthesizing this literature has been difficult given the variability of the patient populations studied, significant changes in imaging technologies, and inconsistencies in the image analysis methods employed between studies. Recently, a number of meta-analyses have attempted to overcome these limitations and quantify the neuroanatomic changes found in schizophrenia (e.g. (2-5)). Although these reviews address issues of sample selection (e.g. focusing on first episode patients; (2, 6)) or variation in critical imaging parameters (e.g. CT vs. MRI, slice thickness; (7)), the inferences that can be drawn from these reviews are restricted by differences in the image analysis procedures applied in individual manuscripts.
The vast majority of brain morphology studies in schizophrenia utilize a region of interest (ROI) approach where specific brain regions are either manually or automatically delineated based upon a set of operationalized procedures (e.g. (8)). While ROI-based image analysis procedures are often robust, internally consistent, and advisable in some situations, they are less than optimal when attempting to systematically review a large neuroanatomic literature. Specifically, the procedures used to define particular brain regions differ dramatically between laboratories, making direct comparisons of reported results difficult. This issue is compounded when authors use dissimilar labels to describe the same brain area (9). Moreover, many manuscripts applying ROI methods to study brain changes in schizophrenia focus on a relatively small number of hypothesized brain regions, potentially biasing results in favor of studied regions and obscuring structural differences in non-hypothesized brain regions. Together these issues significantly reduce the benefit of conducting meta-analytic reviews of ROI-based neuroanatomic studies of schizophrenia.
The past decade has seen the emergence of several new computational approaches to image analysis designed specifically to overcome the difficulties with ROI-based methods (10). Spurred by advances in differential geometry, Bayesian statistics, and by improved imaging acquisition methodology, these computational neuroanatomic methods are revolutionizing our ability to study brain morphology in vivo in clinical and healthy populations (11). The most popular of these novel tools is voxel-based morphometry (VBM), a procedure that involves spatially normalizing high-resolution neuroanatomic images into a common stereotactic space, conduct a voxel-wise comparison of the local concentration (probability) of gray or white matter, and determines group differences based on these measures (12, 13). Most investigators who employ VBM methods report between group gray or white matter density differences in standardized 3D coordinates.
The practice of reporting brain locations as coordinates in stereotactic space is common in the functional neuroimaging literature (14), improving the generalizability of individual experiments and fueling the development of novel meta-analytic procedures (15). One such development, activation likelihood estimation (ALE), capitalizes on the nature of voxel-wise studies by pooling 3D coordinates in stereotactic space from like studies, models each coordinate as a Gaussian distribution and provides the probability of an event occurring at each and every brain voxel. Probability maps are then thresholded using common imaging methodologies like permutation tests and false discovery rate. Unlike traditional meta-analyses that merge results from multiple studies to test for significance in pooled data (16), coordinate-based ALE meta-analyses search for locations of agreement among statistically significant effects (9, 17). Another significant advantage of voxel-based methods is that since every location in the brain is included in the meta-analysis, it is possible to conduct innovative network analyses that dissociate large spatially distributed networks of brain regions into smaller, more homogeneous systems or subnets (18). In the context of functional neuroimaging, these subnets represent brain regions that are putatively engaged by similar cognitive demands. In anatomic studies, subnets may represent regions that are influenced by common etiological or environmental factors.
In the present manuscript, we conducted a voxel-wise, coordinate-based meta-analysis of neuroanatomic data in order to describe the gray matter density changes found in schizophrenia. The current study expands upon Honea and colleague's (2005) tabular meta-analysis of schizophrenia VBM studies by 1) applying a fully automated coordinate-based meta-analysis method; 2) performing a network analysis, to further subdivide and characterize the findings; and 3) expanding the number of included studies from 15 to 31.
Methods
Literature Search and Selection
A comprehensive search for voxel-based morphometry (VBM) studies investigating patients with schizophrenia was carried out with PubMed. Studies were included if they: 1) reported whole-brain results in stereotactic (x, y, z) coordinates, 2) included patients with schizophrenia and healthy comparison subjects, and 3) followed, in general, the VBM protocols described by Ashburner and Friston (2000) or Good and colleagues (2001). Studies were excluded if they only reported brain changes over time (e.g. (19, 20)) or included only individuals at high risk for, but not actually diagnosed with, schizophrenia (21). In addition, a paper investigating the effects of antipsychotic treatment on the brain morphometry in schizophrenia was excluded (22), while another was excluded because all patients with schizophrenia had comorbid substance use disorders (23). To minimize the possibility of non-independent observations, when manuscripts with overlapping samples were considered, only the article with the largest sample was included. Thus our meta-analysis included 31 peer-reviewed articles with a total of 1,195 patients with schizophrenia contrasted with 1,262 healthy volunteers (Table 1).
Table 1. 31 Published VBM Studies Including 1,195 Patients With Schizophrenia Contrasted With 1,262 Healthy Volunteers.
| Published Study | Patients With Schizophrenia | Healthy Subjects | Healthy > Patients | Patients > Healthy |
|---|---|---|---|---|
| Ananth et al., 2002 | 20 | 20 | X | |
| Antonova et al., 2005 | 45 | 45 | X | X |
| Bassitt et al., 2007 | 50 | 30 | X | |
| Chua et al., 2007 | 26 | 38 | X | |
| García-Martí et al., 2007 | 18 | 19 | X | |
| Giuliani et al., 2005 | 41 | 34 | X | X |
| Ha et al., 2004 | 35 | 35 | X | X |
| Honea et al., 2007 | 169 | 212 | X | X |
| Hulshoff Pol et al., 2001 | 159 | 158 | X | X |
| Jayakumar et al., 2005 | 18 | 18 | X | |
| Job et al., 2002 | 34 | 36 | X | |
| Kasparek et al., 2007 | 22 | 18 | X | |
| Kawasaki et al., 2004 | 25 | 50 | X | X |
| Kawasaki et al., 2007 | 30 | 30 | X | |
| Kubicki et al., 2002 | 16 | 18 | X | |
| Marcelis et al., 2003 | 31 | 27 | X | X |
| McIntosh et al., 2004 | 26 | 49 | X | |
| Moorhead et al., 2004 | 25 | 29 | X | |
| Neckelmann et al., 2006 | 12 | 12 | X | |
| Ohnishi et al., 2006 | 47 | 76 | X | |
| Paillere-Martinot et al., 2001 | 20 | 20 | X | X |
| Salgado-Pineda et al., 2003 | 13 | 13 | X | |
| Salgado-Pineda et al., 2004 | 14 | 14 | X | |
| Shapleske et al., 2002 | 72 | 32 | X | X |
| Sigmundsson et al., 2001 | 27 | 27 | X | X |
| Suzuki et al. 2002 | 45 | 42 | X | X |
| Whitford et al., 2005 | 31 | 30 | X | |
| Whitford et al., 2006 | 41 | 47 | X | X |
| Wilke et al., 2001 | 48 | 48 | X | X |
| Wright et al., 1999 | 15 | 15 | X | |
| Yamada et al., 2007 | 20 | 20 | X | |
| Total | 1,195 | 1,262 | 29 | 15 |
In total, these papers included 379 foci of which 315 were included in the meta-analysis statistically comparing regions where healthy subjects had significantly higher gray matter density than patients. The remaining 64 foci were included in meta-analytic procedures examining the reverse contrast (patients > healthy subjects).
Anatomical Likelihood Estimation Meta-Analysis Procedures
In order to meta analyze VBM studies, the results from each individual experiment, represented as a set of coordinates in a standard stereotatic space, were combined with Anatomic Likelihood Estimation methods in order to identify areas of anatomy that were consistently implicated across studies. More specifically, coordinates of VBM foci were pooled to search for convergence in location via the implementation of GingerALE within the BrainMap database system (http://brainmap.org; (17, 24)). Upon entry into the database, the spatial normalization template (e.g. MNI305 or ICBM152) of each paper was noted and the coordinates were automatically transformed to allow analysis using Talairach coordinates (25). Coordinates published in Montreal Neurological Institute (MNI) space were transformed to the Talairach coordinates using the icbm2tal algorithm (26), which has shown to provide improved fit over the mni2tal transform. Furthermore, coordinates from articles that employed the mni2tal transform were transformed back into MNI space, and then transformed into Talairach space via the icbm2tal algorithm. Included foci were blurred with a FWHM of 12mm, and the ALE statistic was computed for every voxel in the brain. Separate ALE maps were created for coordinates where healthy subjects had greater gray matter density than individuals with schizophrenia and where patients with schizophrenia had greater gray matter density than comparison subjects. Statistical significance was determined using a permutation test of randomly generated foci that was corrected for multiple comparisons. Five thousand permutations were computed using the same FWHM value (i.e., 12mm) and the same number of foci (i.e., 315 or 64) used in computing the ALE values. The final ALE maps were thresholded at p < 0.01 (false discovery rate (FDR)-corrected) and clusters of less than 400 mm3 were excluded. Although this study was restricted to gray matter, thresholded ALE maps are displayed on a reference image in Talairach space (27) to facilitate interpretation.
Fractional Similarity Network Analysis (FSNA)
Neumann and colleagues (28) developed a replicator dynamics based method for modeling inter-regional connectivity in order to isolate cortical networks commonly engaged together across studies. However, the replicator dynamics method is limited in that only the dominant subset of nodes in a network can be identified. In order to model every node in a complex network, Lancaster and colleagues (18) extended Neumann's technique with a binary pattern matching algorithm, creating fractional similarity network analysis (FSNA). FSNA identifies subordinate networks within a larger network by creating a cooccurrence matrix, in which each element indicates how often a given pair of regions is co-activated in a given study (28, 29).
To expand upon the basic meta-analysis in the present study, FSNA was performed on ALE maps. The occurrence of each of the ALE nodes in the included studies was noted, and the co-occurrence matrix was computed for all nodes, in all studies. FSNA was used to determine which nodes (brain regions) in the network formed sub-networks (subsets), using the simple S1 similarity coefficient to assess pattern similarity (18). The purpose of the FSNA analysis is to provide groups of regions or subnets that show comparable patterns across studies and may be influenced by similar factors of interest, such as an etiological mechanism or sensitivity to medication effects.
Results
Healthy Comparison Subjects > Patients With Schizophrenia
Meta-analysis results are presented in Figures 1 & 2 and Table 2. Across studies, patients with schizophrenia had reduced gray matter density compared with healthy subjects in a network of nine brain regions. The largest cluster was centered on the left insular cortex (-40, 14, 0; Brodmann area (BA) 13). This region also included the left inferior frontal gyrus (BA 47), superior temporal gyrus (BA 22 & 38), and the precentral gyrus (BA 6 & 44).
Figure 1.
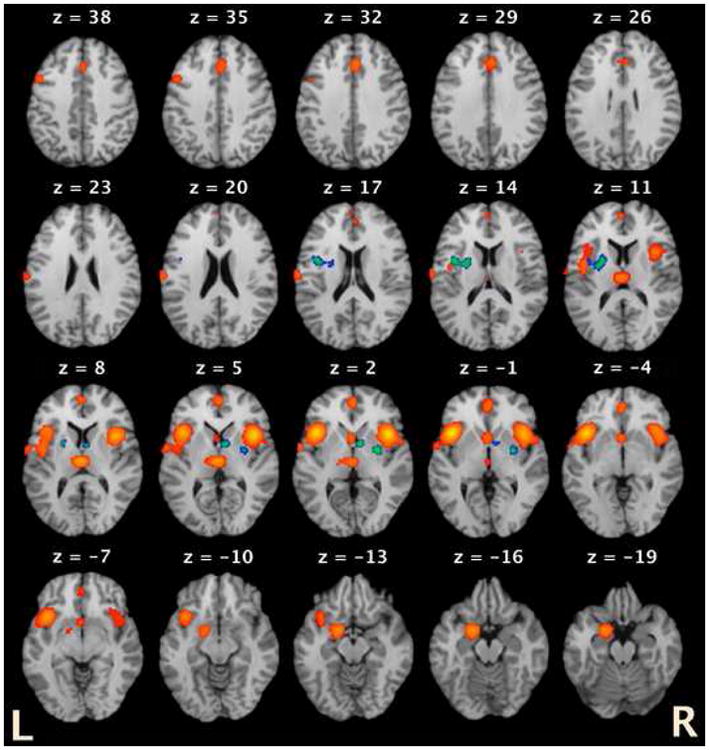
Results from an ALE meta analysis of 31 VBM studies investigating gray matter density changes in schizophrenia. Hot colors represent areas of gray matter density decrease in patients with schizophrenia relative to healthy comparison subjects. Cold or blue colors represent areas of increased gray matter density in patients with schizophrenia relative to comparison subjects.
Figure 2.
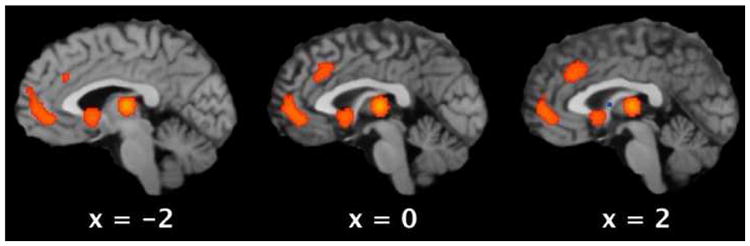
Three regions of anterior cingulate gyrus were found to have lower gray matter density in schizophrenia: dorsal, ventral and subgenual. These regions include both the cognitive and affective regions of cingulate (33).
Table 2. Gray Matter Reductions in Schizophrenia Patients Relative to Healthy Comparison Subjects.
| Brain Region | Volume (mm3) | Brodmann Area | Talairach Coordinate1 | Maximum ALE Value |
|---|---|---|---|---|
| Left Insular Cortex | 9336 | 13 | -40, 14, 0 | 0.026 |
| Right Insular Cortex | 6968 | 13 | 40, 10, 4 | 0.026 |
| Left Parahippocampal Gyrus | 2504 | 34 | -18, -2, -16 | 0.018 |
| Thalamus | 2296 | -- | 0, -20, 6 | 0.020 |
| Ventral Anterior Cingulate | 1680 | 32 | 0, 48, 4 | 0.013 |
| Dorsal Anterior Cingulate | 1400 | 32 | 4, 26, 32 | 0.013 |
| Subgenual Anterior Cingulate | 968 | 25 | 0, 6, -2 | 0.012 |
| Left Postcentral Gyrus | 608 | 43 | -62, -16, 18 | 0.012 |
| Left Middle Frontal Gyrus | 432 | 9 | -46, 10, 36 | 0.011 |
Talairach coordinate for the maximum ALE value
A homologous, though more punctate, region was identified in right insular cortex (40, 10, 4; BA 13). This region included the inferior frontal gyrus (BA 47), but did not extend into the temporal lobe or the precentral gyrus. The third largest cluster was centered in the left parahippocampal gyrus (-18, -2, -16; BA 34) and extended to include the amygdala. Three midline regions were centered on the anterior cingulate gyrus (Figure 2): one dorsal (0, 48, 4; BA 32 & 10), one ventral (4, 26, 32; BA 32 & 6), and one subgenual (0, 6, -2). A midline thalamic (0, -20, 6) region was also identified, which presumably indicates bilateral thalamic alterations in schizophrenia. Additionally, an area of left postcentral gyrus (-62, -16, 18; BA 43) was also designated as being distinctly different between groups. Finally, patients with schizophrenia showed consistent gray matter density reductions in left middle frontal gyrus (-46, 10, 36; BA 9), an area putatively linked to executive functioning (30, 31).
Patients With Schizophrenia > Healthy Comparison Subjects
Of the 31 papers included in this review, 15 reported gray matter density increases in patients with schizophrenia relative to healthy comparison subjects (Table 1). Regions of increased gray matter density in schizophrenia were more discrete and smaller than areas of relative decrease. Across manuscripts, three subcortical regions were consistently identified: left (volume 1248 mm3; -38, 0, 16) and right (464 mm3; 28, -6, 2) putamen (lentiform nucleus) and the right head of the caudate (424 mm3; 8, 0, 4). The left putamen cluster extended into a portion of the insula (BA 13) that is just superior to areas of relative gray matter density decrease.
Fractional Similarity Network Analysis
Given that only 3 regions were identified where patients with schizophrenia had greater gray matter density than comparison subjects, this contrast was not included in network analyses. For the ALE results identifying regions of reduced gray matter density in patients compared with healthy subjects, a binary co-occurrence matrix was computed with 29 columns (input studies) and 9 rows (ALE nodes). FSNA identified four subnets that indicate that regions of gray matter density reduction in schizophrenia commonly co-occur across studies (see Figure 3). The largest subnet included bilateral insular regions, the left parahippocampal area, and the left post central gyrus. The left middle frontal gyrus and ventral anterior cingulate were grouped into the second subnet. The third included the thalamic region and the dorsal anterior cingulate. The final subnet included only the subgenual cingulate.
Figure 3.
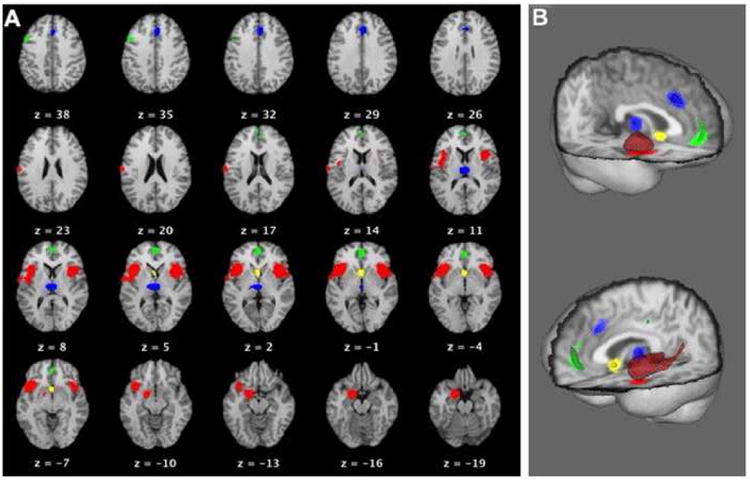
Fractional similarity network analysis parsed regions of gray matter density reduction in schizophrenia into four distinct subnets: bilateral insular cortex, left parahippocampal and left post central gyri (red); left middle frontal gyrus and ventral anterior cingulate (green); thalamus and dorsal anterior cingulate (blue); and subgenual cingulate (yellow). Part (A) represents two-dimensional views of these subnets while (B) displays a three-dimensional rendering of these network components.
Discussion
We performed a voxel-wide, coordinate-based meta-analytic method on results from 31 VBM studies that contrasted the gray matter density of 1,195 patients with schizophrenia with 1,262 healthy comparison subjects. The results indicate that patients have reduced gray matter density relative to controls in a distributed network of regions, including bilateral insular cortex, anterior cingulate, left parahippocampal gyrus, middle frontal gyrus, postcentral gyrus, and thalamus. These regions were grouped into four distinct systems or subnets, each of which could reflect different aspects of the pathophysiology of schizophrenia, specific environmental influences, or factors that vary across studies. For example, grouping of gray matter density reductions in BA 9 and & 32 may be associated with the cognitive control deficits that are putatively central to the manifestation of schizophrenia (32).
Three separate areas of the anterior cingulate gyrus were implicated in the current analysis (Figure 2). These regions include both “affective” and “cognitive” portions of the anterior cingulate (33) and strengthen arguments for the importance of this gyrus in the pathology of schizophrenia (34). The network analysis placed each sub-region of the anterior cingulate into separate subnets, suggesting that these regions may be influenced by different aspects of the etiology of schizophrenia or by differences in the implementations of VBM experiments (e.g. sample selection, sample size, imaging methods). Of these three regions, the subgenual finding has been reported least often. Upon closer inspection, we determined that this cluster was composed of coordinates from four separate studies and that these authors defined this location as subgenual cingulate (35), subcallosal gyrus (36, 37), or left caudate (38). While both the maximum value (0, 6, -2) and centroid (-1, 10, -6) of this cluster are within the subgenual cingulate, the actual resolution of the current analysis does not allow for the level of parcellation needed to definitively exclude other proximal structures within the basal forebrain. The subgenual cingulate has been linked to mood disorders (39) and may be associated with the affective blunting commonly observed in schizophrenia (40-42).
Individuals with schizophrenia had higher gray mater density compared to controls in the striatum, specifically in the left and right putamen and in the right caudate. Increased striatal gray matter density may be associated with typical (3, 43) or atypical (44, 45) antipsychotic usage, with at least one manuscript reporting enlarged caudate volume occurring in patients on Olanzapine treatment (46). While it is tempting to argue that findings of increased striatal gray matter density may be secondary antipsychotic usage, several investigators have not found this association (22, 47). Only large scale randomized controlled trials with longitudinal imaging can address this issue.
Although VBM is surprisingly well adapted for coordinate-based meta-analyses, the method does have limitations that should be considered when interpreting results. While VBM analyses capture similar information as traditional region of interest methods (36, 48-50), they may over represent group differences in areas of high anatomic variability (50, 51). Furthermore, they may be biased towards detecting highly localized group differences and biased against detecting group differences when these differences are spatially complex (52). The number of subjects included in analyses could significantly influence VBM results (53). Although in the current meta analysis we did not weight studies by the number of subjects included, we did not observe an obvious relationship between the sample size and the number of anatomic regions implicated in schizophrenia, with the exception that the study with the largest sample (54) was the only experiment to nominate all of the regions identified in the meta analysis. Finally, variation in the exact image analysis methods applied in individual manuscripts (e.g. the size of the smoothing kernel, significance-level or thresholding scheme, method for correcting for multiple comparisons, or the application of Jacobian modulations) likely influences findings. Since there is no standard VBM method, and few studies directly compare analytic approaches when investigating schizophrenia, it is difficult to determine how specific choices impact results. Such variation significantly increases the need for replication across studies and, subsequently, the need for meta-analyses.
As with any meta-analytic method, the ALE technique is limited by the detail of the primary research articles. This is most apparent in situations where investigators report a single midline coordinate for a cluster that includes both left and right regions. For example, although the thalamic cluster reported in the current analysis is represented as a single midline region, inspection of the source manuscripts indicates that reduced gray matter density was observed in both the left and right thalamus and that authors tended to report a single coordinate for these overlapping regions. An additional aspect of this meta-analytic technique is that, like functional neuroimaging methods, the procedure through which an ALE map is thresholded is somewhat arbitrary. In the current manuscript, we choose a conservative threshold of p < 0.01 after correcting for multiple comparisons. However, if we had chosen the more liberal threshold of p < 0.05, our results would have been similar to those reported with the exception of two additional brain areas: a right parahippocampal gyrus region (including amygdala) and a right middle frontal gyrus region (BA 9 & 8). Both of these regions are similar to, but smaller, than left hemisphere clusters that survived the more stringent thresholding. Thus, although our findings could support a left hemisphere model of schizophrenia, this interpretation may simply be due to our choice of threshold rather than a true biological effect.
While the application of brain function-location meta-analysis to anatomic rather than functional neuroimaging data is novel, the procedures are identical and conceptualization of results is straightforward. The use of voxel-wise ALE methods in the current study succinctly described gray matter density changes in schizophrenia and may foster more detailed neural models of illness. While it is unknown if reduced gray matter density across the implicated regions leads to the cognitive fractionation and psychotic symptoms that characterize schizophrenia, the current review should help to focus neuroanatomic models of the illness.
Supplementary Material
Acknowledgments
This work was supported by the Human Brain Project of the NIMH (R01-MH074457-01A1).
Footnotes
Financial Disclosures: Dr. Bullmore is head of the GSK Clinical Unit at Cambridge. None of the other authors reported any biomedical financial interests or potential conflicts of interest.
Publisher's Disclaimer: This is a PDF file of an unedited manuscript that has been accepted for publication. As a service to our customers we are providing this early version of the manuscript. The manuscript will undergo copyediting, typesetting, and review of the resulting proof before it is published in its final citable form. Please note that during the production process errors may be discovered which could affect the content, and all legal disclaimers that apply to the journal pertain.
References
- 1.Johnstone EC, Crow TJ, Frith CD, Husband J, Kreel L. Cerebral ventricular size and cognitive impairment in chronic schizophrenia. Lancet. 1976;2:924–926. doi: 10.1016/s0140-6736(76)90890-4. [DOI] [PubMed] [Google Scholar]
- 2.Steen RG, Mull C, McClure R, Hamer RM, Lieberman JA. Brain volume in first-episode schizophrenia: systematic review and meta-analysis of magnetic resonance imaging studies. Br J Psychiatry. 2006;188:510–518. doi: 10.1192/bjp.188.6.510. [DOI] [PubMed] [Google Scholar]
- 3.Wright IC, Rabe-Hesketh S, Woodruff PW, David AS, Murray RM, Bullmore ET. Meta-analysis of regional brain volumes in schizophrenia. Am J Psychiatry. 2000;157:16–25. doi: 10.1176/ajp.157.1.16. [DOI] [PubMed] [Google Scholar]
- 4.Nelson MD, Saykin AJ, Flashman LA, Riordan HJ. Hippocampal volume reduction in schizophrenia as assessed by magnetic resonance imaging: a meta-analytic study. Arch Gen Psychiatry. 1998;55:433–440. doi: 10.1001/archpsyc.55.5.433. [DOI] [PubMed] [Google Scholar]
- 5.Honea R, Crow TJ, Passingham D, Mackay CE. Regional deficits in brain volume in schizophrenia: a meta-analysis of voxel-based morphometry studies. Am J Psychiatry. 2005;162:2233–2245. doi: 10.1176/appi.ajp.162.12.2233. [DOI] [PubMed] [Google Scholar]
- 6.Vita A, De Peri L, Silenzi C, Dieci M. Brain morphology in first-episode schizophrenia: a meta-analysis of quantitative magnetic resonance imaging studies. Schizophr Res. 2006;82:75–88. doi: 10.1016/j.schres.2005.11.004. [DOI] [PubMed] [Google Scholar]
- 7.Davidson LL, Heinrichs RW. Quantification of frontal and temporal lobe brain-imaging findings in schizophrenia: a meta-analysis. Psychiatry Res. 2003;122:69–87. doi: 10.1016/s0925-4927(02)00118-x. [DOI] [PubMed] [Google Scholar]
- 8.Baare WF, van Oel CJ, Hulshoff Pol HE, Schnack HG, Durston S, Sitskoorn MM, et al. Volumes of brain structures in twins discordant for schizophrenia. Arch Gen Psychiatry. 2001;58:33–40. doi: 10.1001/archpsyc.58.1.33. [DOI] [PubMed] [Google Scholar]
- 9.Laird AR, McMillan KM, Lancaster JL, Kochunov P, Turkeltaub PE, Pardo JV, et al. A comparison of label-based review and ALE meta-analysis in the Stroop task. Hum Brain Mapp. 2005;25:6–21. doi: 10.1002/hbm.20129. [DOI] [PMC free article] [PubMed] [Google Scholar]
- 10.Ashburner J, Csernansky JG, Davatzikos C, Fox NC, Frisoni GB, Thompson PM. Computer-assisted imaging to assess brain structure in healthy and diseased brains. Lancet Neurol. 2003;2:79–88. doi: 10.1016/s1474-4422(03)00304-1. [DOI] [PubMed] [Google Scholar]
- 11.Toga AW, Thompson PM, Mori S, Amunts K, Zilles K. Towards multimodal atlases of the human brain. Nat Rev Neurosci. 2006;7:952–966. doi: 10.1038/nrn2012. [DOI] [PMC free article] [PubMed] [Google Scholar]
- 12.Ashburner J, Friston KJ. Voxel-based morphometry--the methods. Neuroimage. 2000;11:805–821. doi: 10.1006/nimg.2000.0582. [DOI] [PubMed] [Google Scholar]
- 13.Good CD, Johnsrude IS, Ashburner J, Henson RN, Friston KJ, Frackowiak RS. A voxel-based morphometric study of ageing in 465 normal adult human brains. Neuroimage. 2001;14:21–36. doi: 10.1006/nimg.2001.0786. [DOI] [PubMed] [Google Scholar]
- 14.Fox PT, Parsons LM, Lancaster JL. Beyond the single study: function/location metanalysis in cognitive neuroimaging. Curr Opin Neurobiol. 1998;8:178–187. doi: 10.1016/s0959-4388(98)80138-4. [DOI] [PubMed] [Google Scholar]
- 15.Turkeltaub PE, Eden GF, Jones KM, Zeffiro TA. Meta-analysis of the functional neuroanatomy of single-word reading: method and validation. Neuroimage. 2002;16:765–780. doi: 10.1006/nimg.2002.1131. [DOI] [PubMed] [Google Scholar]
- 16.Mosteller F, Colditz GA. Understanding research synthesis (meta-analysis) Annu Rev Public Health. 1996;17:1–23. doi: 10.1146/annurev.pu.17.050196.000245. [DOI] [PubMed] [Google Scholar]
- 17.Laird AR, Fox PM, Price CJ, Glahn DC, Uecker AM, Lancaster JL, et al. ALE meta-analysis: controlling the false discovery rate and performing statistical contrasts. Hum Brain Mapp. 2005;25:155–164. doi: 10.1002/hbm.20136. [DOI] [PMC free article] [PubMed] [Google Scholar]
- 18.Lancaster JL, Laird AR, Fox PM, Glahn DE, Fox PT. Automated analysis of meta-analysis networks. Hum Brain Mapp. 2005;25:174–184. doi: 10.1002/hbm.20135. [DOI] [PMC free article] [PubMed] [Google Scholar]
- 19.Job DE, Whalley HC, Johnstone EC, Lawrie SM. Grey matter changes over time in high risk subjects developing schizophrenia. Neuroimage. 2005;25:1023–1030. doi: 10.1016/j.neuroimage.2005.01.006. [DOI] [PubMed] [Google Scholar]
- 20.van Haren NE, Hulshoff Pol HE, Schnack HG, Cahn W, Mandl RC, Collins DL, et al. Focal gray matter changes in schizophrenia across the course of the illness: a 5-year follow-up study. Neuropsychopharmacology. 2007;32:2057–2066. doi: 10.1038/sj.npp.1301347. [DOI] [PubMed] [Google Scholar]
- 21.Job DE, Whalley HC, McConnell S, Glabus M, Johnstone EC, Lawrie SM. Voxel-based morphometry of grey matter densities in subjects at high risk of schizophrenia. Schizophr Res. 2003;64:1–13. doi: 10.1016/s0920-9964(03)00158-0. [DOI] [PubMed] [Google Scholar]
- 22.McClure RK, Phillips I, Jazayerli R, Barnett A, Coppola R, Weinberger DR. Regional change in brain morphometry in schizophrenia associated with antipsychotic treatment. Psychiatry Res. 2006;148:121–132. doi: 10.1016/j.pscychresns.2006.04.008. [DOI] [PubMed] [Google Scholar]
- 23.Potvin S, Mancini-Marie A, Fahim C, Mensour B, Levesque J, Karama S, et al. Increased striatal gray matter densities in patients with schizophrenia and substance use disorder: a voxel-based morphometry study. Psychiatry Res. 2007;154:275–279. doi: 10.1016/j.pscychresns.2006.11.009. [DOI] [PubMed] [Google Scholar]
- 24.Fox PT, Lancaster JL. Opinion: Mapping context and content: the BrainMap model. Nat Rev Neurosci. 2002;3:319–321. doi: 10.1038/nrn789. [DOI] [PubMed] [Google Scholar]
- 25.Talairach J, Tournoux P. Co-planar Stereotaxic Atlas of the Human Brain 3-dimensional Proportional System: An approach to cerebral imaging. New York: NY: Thieme Medical Publishers, Inc; 1988. [Google Scholar]
- 26.Lancaster JL, Tordesillas-Gutierrez D, Martinez M, Salinas F, Evans A, Zilles K, et al. Bias between MNI and Talairach coordinates analyzed using the ICBM-152 brain template. Hum Brain Mapp. 2007;28:1194–1205. doi: 10.1002/hbm.20345. [DOI] [PMC free article] [PubMed] [Google Scholar]
- 27.Kochunov P, Lancaster J, Thompson P, Toga AW, Brewer P, Hardies J, et al. An optimized individual target brain in the Talairach coordinate system. Neuroimage. 2002;17:922–927. [PubMed] [Google Scholar]
- 28.Neumann J, Lohmann G, Derrfuss J, von Cramon DY. The meta-analysis of functional imaging data using replicator dynamics. Hum Brain Mapp. 2005;25:165–173. doi: 10.1002/hbm.20133. [DOI] [PMC free article] [PubMed] [Google Scholar]
- 29.Bomze IM, Pelillo M. Approximating the maximum weight clique using replicator dynamics. IEEE Trans Neural Netw. 2000;11:1228–1241. doi: 10.1109/72.883403. [DOI] [PubMed] [Google Scholar]
- 30.Selemon LD, Mrzljak J, Kleinman JE, Herman MM, Goldman-Rakic PS. Regional specificity in the neuropathologic substrates of schizophrenia: a morphometric analysis of Broca's area 44 and area 9. Arch Gen Psychiatry. 2003;60:69–77. doi: 10.1001/archpsyc.60.1.69. [DOI] [PubMed] [Google Scholar]
- 31.D'Esposito M, Detre JA, Alsop DC, Shin RK, Atlas S, Grossman M. The neural basis of the central executive system of working memory. Nature. 1995;378:279–281. doi: 10.1038/378279a0. [DOI] [PubMed] [Google Scholar]
- 32.Cannon TD, Glahn DC, Kim J, Van Erp TG, Karlsgodt K, Cohen MS, et al. Dorsolateral prefrontal cortex activity during maintenance and manipulation of information in working memory in patients with schizophrenia. Arch Gen Psychiatry. 2005;62:1071–1080. doi: 10.1001/archpsyc.62.10.1071. [DOI] [PubMed] [Google Scholar]
- 33.Bush G, Luu P, Posner MI. Cognitive and emotional influences in anterior cingulate cortex. Trends Cogn Sci. 2000;4:215–222. doi: 10.1016/s1364-6613(00)01483-2. [DOI] [PubMed] [Google Scholar]
- 34.Baiano M, David A, Versace A, Churchill R, Balestrieri M, Brambilla P. Anterior cingulate volumes in schizophrenia: a systematic review and a meta-analysis of MRI studies. Schizophr Res. 2007;93:1–12. doi: 10.1016/j.schres.2007.02.012. [DOI] [PubMed] [Google Scholar]
- 35.Yamada M, Hirao K, Namiki C, Hanakawa T, Fukuyama H, Hayashi T, et al. Social cognition and frontal lobe pathology in schizophrenia: a voxel-based morphometric study. Neuroimage. 2007;35:292–298. doi: 10.1016/j.neuroimage.2006.10.046. [DOI] [PubMed] [Google Scholar]
- 36.Giuliani NR, Calhoun VD, Pearlson GD, Francis A, Buchanan RW. Voxel-based morphometry versus region of interest: a comparison of two methods for analyzing gray matter differences in schizophrenia. Schizophr Res. 2005;74:135–147. doi: 10.1016/j.schres.2004.08.019. [DOI] [PubMed] [Google Scholar]
- 37.Ha TH, Youn T, Ha KS, Rho KS, Lee JM, Kim IY, et al. Gray matter abnormalities in paranoid schizophrenia and their clinical correlations. Psychiatry Res. 2004;132:251–260. doi: 10.1016/j.pscychresns.2004.05.001. [DOI] [PubMed] [Google Scholar]
- 38.Salgado-Pineda P, Baeza I, Perez-Gomez M, Vendrell P, Junque C, Bargallo N, et al. Sustained attention impairment correlates to gray matter decreases in first episode neuroleptic-naive schizophrenic patients. Neuroimage. 2003;19:365–375. doi: 10.1016/s1053-8119(03)00094-6. [DOI] [PubMed] [Google Scholar]
- 39.Drevets WC, Price JL, Simpson JR, Jr, Todd RD, Reich T, Vannier M, et al. Subgenual prefrontal cortex abnormalities in mood disorders. Nature. 1997;386:824–827. doi: 10.1038/386824a0. [DOI] [PubMed] [Google Scholar]
- 40.Gur RE, Kohler CG, Ragland JD, Siegel SJ, Lesko K, Bilker WB, et al. Flat affect in schizophrenia: relation to emotion processing and neurocognitive measures. Schizophr Bull. 2006;32:279–287. doi: 10.1093/schbul/sbj041. [DOI] [PMC free article] [PubMed] [Google Scholar]
- 41.Kohler C, Gur RC, Swanson CL, Petty R, Gur RE. Depression in schizophrenia: I. Association with neuropsychological deficits. Biol Psychiatry. 1998;43:165–172. doi: 10.1016/S0006-3223(97)00033-4. [DOI] [PubMed] [Google Scholar]
- 42.Kohler C, Swanson CL, Gur RC, Mozley LH, Gur RE. Depression in schizophrenia: II. MRI and PET findings. Biol Psychiatry. 1998;43:173–180. doi: 10.1016/S0006-3223(97)00298-9. [DOI] [PubMed] [Google Scholar]
- 43.Sigmundsson T, Suckling J, Maier M, Williams S, Bullmore E, Greenwood K, et al. Structural abnormalities in frontal, temporal, and limbic regions and interconnecting white matter tracts in schizophrenic patients with prominent negative symptoms. Am J Psychiatry. 2001;158:234–243. doi: 10.1176/appi.ajp.158.2.234. [DOI] [PubMed] [Google Scholar]
- 44.Lang DJ, Kopala LC, Vandorpe RA, Rui Q, Smith GN, Goghari VM, et al. Reduced basal ganglia volumes after switching to olanzapine in chronically treated patients with schizophrenia. Am J Psychiatry. 2004;161:1829–1836. doi: 10.1176/ajp.161.10.1829. [DOI] [PubMed] [Google Scholar]
- 45.Deshmukh A, Rosenbloom MJ, De Rosa E, Sullivan EV, Pfefferbaum A. Regional striatal volume abnormalities in schizophrenia: effects of comorbidity for alcoholism, recency of alcoholic drinking, and antipsychotic medication type. Schizophr Res. 2005;79:189–200. doi: 10.1016/j.schres.2005.04.025. [DOI] [PubMed] [Google Scholar]
- 46.Okugawa G, Nobuhara K, Takase K, Saito Y, Yoshimura M, Kinoshita T. Olanzapine increases grey and white matter volumes in the caudate nucleus of patients with schizophrenia. Neuropsychobiology. 2007;55:43–46. doi: 10.1159/000103575. [DOI] [PubMed] [Google Scholar]
- 47.Glenthoj A, Glenthoj BY, Mackeprang T, Pagsberg AK, Hemmingsen RP, Jernigan TL, et al. Basal ganglia volumes in drug-naive first-episode schizophrenia patients before and after short-term treatment with either a typical or an atypical antipsychotic drug. Psychiatry Res. 2007;154:199–208. doi: 10.1016/j.pscychresns.2006.10.002. [DOI] [PubMed] [Google Scholar]
- 48.Kubicki M, Shenton ME, Salisbury DF, Hirayasu Y, Kasai K, Kikinis R, et al. Voxel-based morphometric analysis of gray matter in first episode schizophrenia. Neuroimage. 2002;17:1711–1719. doi: 10.1006/nimg.2002.1296. [DOI] [PMC free article] [PubMed] [Google Scholar]
- 49.Keller SS, Mackay CE, Barrick TR, Wieshmann UC, Howard MA, Roberts N. Voxel-based morphometric comparison of hippocampal and extrahippocampal abnormalities in patients with left and right hippocampal atrophy. Neuroimage. 2002;16:23–31. doi: 10.1006/nimg.2001.1072. [DOI] [PubMed] [Google Scholar]
- 50.Tisserand DJ, Pruessner JC, Sanz Arigita EJ, van Boxtel MP, Evans AC, Jolles J, et al. Regional frontal cortical volumes decrease differentially in aging: an MRI study to compare volumetric approaches and voxel-based morphometry. Neuroimage. 2002;17:657–669. [PubMed] [Google Scholar]
- 51.Bookstein FL. Voxel-based morphometry should not be used with imperfectly registered images. Neuroimage. 2001;14:1454–1462. doi: 10.1006/nimg.2001.0770. [DOI] [PubMed] [Google Scholar]
- 52.Davatzikos C. Why voxel-based morphometric analysis should be used with great caution when characterizing group differences. Neuroimage. 2004;23:17–20. doi: 10.1016/j.neuroimage.2004.05.010. [DOI] [PubMed] [Google Scholar]
- 53.Salmond CH, Ashburner J, Vargha-Khadem F, Connelly A, Gadian DG, Friston KJ. Distributional assumptions in voxel-based morphometry. Neuroimage. 2002;17:1027–1030. [PubMed] [Google Scholar]
- 54.Hulshoff Pol HE, Schnack HG, Mandl RC, van Haren NE, Koning H, Collins DL, et al. Focal gray matter density changes in schizophrenia. Arch Gen Psychiatry. 2001;58:1118–1125. doi: 10.1001/archpsyc.58.12.1118. [DOI] [PubMed] [Google Scholar]
Associated Data
This section collects any data citations, data availability statements, or supplementary materials included in this article.