Abstract
Context:
The diagnosis and evaluation of impaired renal function remains a challenge owing to lack of reliable biomarker for assessment of kidney function. The existing panel of biomarkers currently displays several limitations, and recently kidney injury molecule-1 (KIM-1) has been suggested as a sensitive biomarker of renal function and proposed to enter clinical practice.
Aims:
This study was conducted to determine the diagnostic value of serum creatinine, urea, and microalbuminuria (MAU) in relation to the novel biomarker, KIM-1.
Materials and Methods:
Serum creatinine, urea, MAU, and KIM-1 were measured in forty individuals with and forty without kidney disease. Data were analyzed using multivariate methods of assessing diagnostic efficiency, test agreement, condition effects, and variability.
Results:
The area under the receiver-operator characteristic curve revealed a diagnostic advantage of creatinine (0.924 ± 0.0066) and urea (0.925 ± 0.0068) over MAU (0.880 ± 0.078) and KIM-1 (0.35 ± 0.124). Overall diagnostic efficiency was higher for creatinine and urea (89.5% and 90.9%, respectively), followed by MAU (85.7%) and then KIM-1 (56.3%). Logistic regression analysis showed that creatinine and urea (R2 = 0.75 and R2 = 0.72, respectively, P < 0.001 for both) were better predictors of kidney disease than MAU (R2 = 0.64, P < 0.001) and KIM-1 (R2 = 0.046, P = 0.116). Further analysis of agreement showed that urea had an excellent agreement with creatinine (kappa r = 0.835, P < 0.001), with KIM-1 (kappa r = –0.198, P = 0.087) showing a poor agreement with creatinine.
Conclusion:
Our results indicate that elevated serum creatinine and urea above specific cutoff points reliably identifies patients with acute kidney injury or chronic kidney disease. However, more researches are warranted to further validate the diagnostic efficiency and application of MAU and for KIM-1 before its implementation in clinical practice.
Keywords: Creatinine, diagnostic accuracy, kidney disease, kidney injury molecule-1, microalbuminuria, urea
Introduction
Renal failure is a disorder in which the kidneys fail to function effectively.[1] Acute renal failure (acute kidney injury [AKI]) is a syndrome characterized by the rapid loss of the kidney excretory function and is one of the most important complications among hospitalized patients and accounts for a high rate of in-hospital deaths,[2] whereas chronic kidney disease (CKD) is characterized by primary renal failure and irreversible renal structural lesions that have been present for months to years.[3] AKI and CKD are worldwide public health problems principal to a progressively growing number of patients with end-stage renal disease and are among the most common causes of morbidity and premature death, with major impact on health-care costs, productivity, and growth.[4] Thus, diagnosis and evaluation of impaired renal function is of particular importance in treatment, monitoring, and prognosis of renal failure. Whereas accumulation of end products of nitrogen metabolism (urea and creatinine) is currently established biomarkers of choice for the diagnosis of AKI and CKD, these have been rigorously criticized for their apparent low diagnostic efficiency and inability to accurately determine kidney failure in certain circumstances.[5,6] Their possible better replacements, thus, have been a legend over many decades retold. The aim of this study was to investigate the diagnostic value of traditional biomarker of kidney function – urea, creatinine, and microalbuminuria (MAU) and a previously described highly sensitive novel biomarker, kidney injury molecule-1 (KIM-1)[7,8] in the diagnosis of acute and CKD.
Materials and Methods
Individuals matched on broad age categories (18–39, 40–59, 60–75 years old – mean ± standard deviation; 35.6 ± 13.5 years, range; and 18–72 years.) and genders (female: male ratio: 3:5) were recruited to the study (n = 80) between June 2014 and August 2014 at the University Teaching Hospital, Lusaka, Zambia. The group consisted of previously diagnosed individual with kidney disease (n = 40; 27 with CKD and 13 with AKI) and matched individuals without kidney disease (n = 40). Kidney disease was defined according to the individual's clinical history, presenting condition and previous laboratory diagnosis; with these data obtained from previous test results, and current patient registry files. Consecutive individuals of either gender that gave written consent were recruited to the study. Individuals below 18 years old or above 75 years of age were excluded from the study. Pregnant women and those with debilitating comorbid conditions, including liver disease, diabetes mellitus, major surgery, cancer, acute and chronic inflammatory diseases, and heart failure, were also excluded from the study. All laboratory tests were performed in duplicate on one sample of urine or serum appropriately, after collection from study participants. Urinary KIM-1 levels were determined using the NeoBioLab® Human HK0032 (USA) ELISA Kit, a quantitative competitive immunoassay for measurement of Human KIM-1 according to the manufacturer's protocol. MAU levels were determined using the Fitzgerald® Industries International (USA) ELISA Kit, a quantitative competitive immunoassay for measurement of human albumin in urine. KIM-1 and MAU levels in the samples were calculated using linear regression equations obtained from standard absorbance verses concentration plots. Urea and creatinine were measured using the modified Jaffé method and the kinetic urease method, respectively, on the Bechman Coulter Olympus AU480 automated chemistry analyzer. A full description of the urea and creatinine methods and their validation have been published elsewhere.[9,10,11]
Data were analyzed in the Statistical Package for Social Sciences (SPSS) version 22 (IBM Corp. SPSS Inc. Armonk, NY, USA) for MAC (SPSS Inc., Chicago, IL, USA). The Shapiro–Wilk test was used, and histograms, box plots, and Q-Q plots were examined to verify the normality of distribution of measurement data. Nonparametric receiver-operator characteristic (ROC) curves based on the Mann–WhitneyU-test statistics were calculated, and the area under the curve (AUC), 95% confidence interval, and specific P values were calculated for each plot.[12] Logistic regression was used to calculate the best cut-off points for each biomarker a described previously.[13] Sensitivity, specificity, positive predictive values, negative predictive values, and overall diagnostic efficiency were calculated for each value of creatinine, urea, KIM-1, and MAU. Logistic regression analysis was further applied to ascertain the effects of creatinine, urea, KIM-1, and MAU on the likelihood that participants have kidney disease. In addition, agreement of creatinine with urea, KIM-1, and MAU in detecting kidney disease was assessed using Cohen's kappa statistic for agreement.[14] Interaction of gender at two levels (male and female) and kidney status at three levels (AKI, CKD, and normal kidney function) on each biomarker was evaluated using two-way analysis of variance (ANOVA) with a post hoc Bonferroni test. The independent sample Student's t-test was used to compare mean creatinine values between genders. All statistical tests were performed at the 5% significance level, and differences were considered significant if two-tailed P < 0.05 for all test applied.
The University of Zambia Biomedical Research Ethics Committee IRB00001131 of IORG0000774 approved the study protocol; approval reference No. 003-08-14. Written informed consent was obtained from all study participants. Permission to conduct the study was obtained from the Directorate of Research and Graduate Studies of the University of Zambia.
Results
Discrimination model for diagnosis of kidney disease
Assessing how well the model distinguished patients with and without kidney disease was done using the AUC of the ROC curve as in Figure 1.
Figure 1.
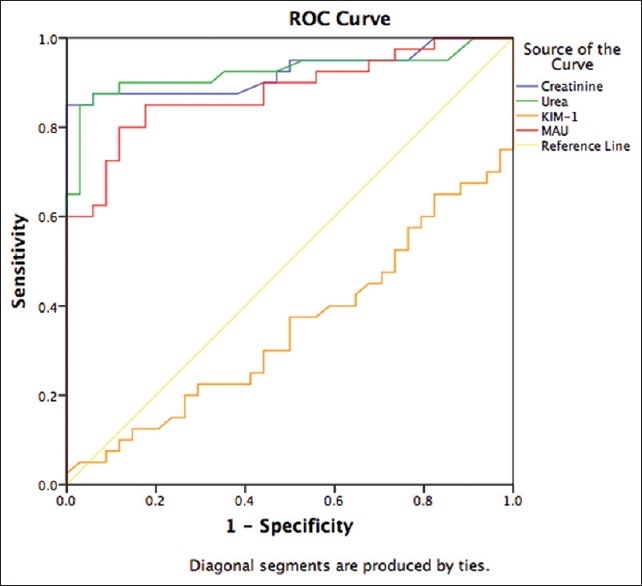
Receiver–operator characteristic curves for the best prediction model of kidney disease. The area under the receiver–operator characteristic curve values and 95% confidence intervals and P values
Kidney disease prediction models
A logistic regression was performed to ascertain the effects of creatinine, urea, KIM-1, and MAU on the likelihood that participants have kidney disease. The logistic regression models for creatinine and for urea were statistically significant, P < 0.0001 for both tests. The models for creatinine and urea explained 75.4% and 71.6% (i.e., Nagelkerke R2 = 0.754 and R2 = 0.716, respectively) of the variance in kidney disease and correctly classified 89.7% and 90.9% of cases, respectively. The MAU logistic regression model was statistically significant, P < 0.0001, the model explained 64% of the variance in kidney disease and correctly classified 85.7% of cases. KIM-1 displayed a nonstatistically significant model, P = 0.116, R2 = 0.046 which explained only 56.3% of cases. Step-wise logistic regression model combined for urea and creatinine was statistically significant P < 0.0001 and this model explained 76.6% of the variable in kidney disease and correctly classified 93.2% of cases. Adding MAU to the urea and creatinine logistic regression model yielded a statistically significant model, P < 0.0001, with which 81.7% of the variable in kidney disease was explained and correctly classified 94.6% of the cases.
Interaction of kidney status and gender on biomarker levels
A two-way ANOVA was conducted that examined the effect of gender (two levels; male and female) and kidney status (three levels; AKI, CKD, or normal) on serum creatinine, urea, KIM-1, and MAU levels.
Creatinine
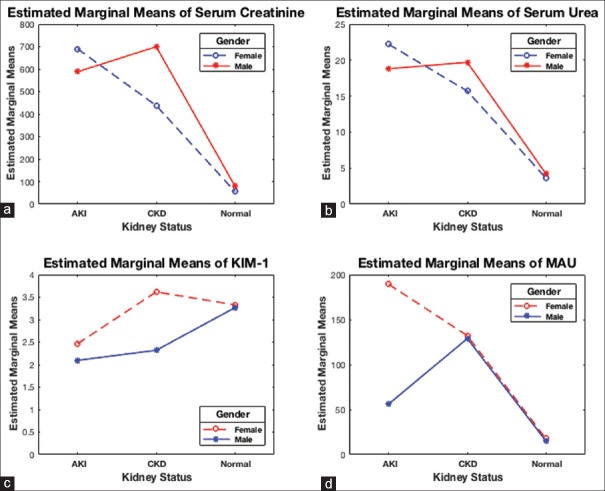
There was a nonstatistically significant interaction between the effects of gender and kidney status on serum creatinine levels, P = 0.437. The main effect kidney status was statistically significant, P < 0.001, indicating that creatinine levels were different across kidney status. However, the main effect gender was not significant (P = 0.626), indicating that the mean creatinine levels were not different for gender across different kidney statuses. Post hoc analysis with a Bonferroni adjustment showed that individuals with AKI and CKD had statistically significantly elevated creatinine levels (639.2 ± 115.0 μmol/L and 553.3 ± 86.4 μmol/L, respectively) than the normal control group levels (68.0 ± 70.8 μmol/L), P < 0.001 and P < 0.001, respectively. Creatinine levels were statistically similar between AKI and CKD, P = 1.0 [Figure 2a]. However, creatinine levels were statistically significantly different between genders for the control group [Figure 3].
Figure 2.
Interaction between kidney biomarkers with gender and kidney status: two-way analysis of variance showed that main effect kidney status was associated with creatinine (P < 0.001) (a), urea (P < 0.001) (b), and microalbuminuria (P < 0.001) (d) but not for kidney injury molecule-1 (P = 0.096) (c)
Figure 3.
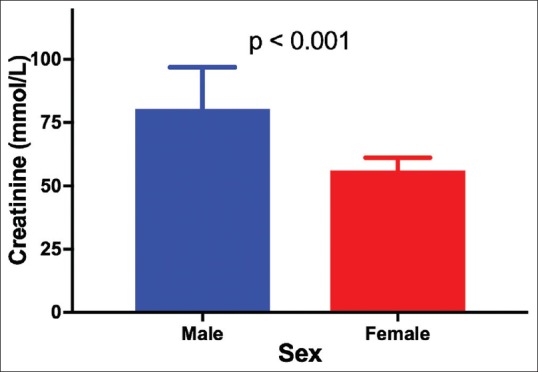
Mean serum creatinine levels of individuals with normal kidney function
Urea
The main effect kidney status indicated that urea levels were different across kidney statuses, (P < 0.001). Conversely, urea levels were not different for gender across different kidney statuses, P = 0.882. Furthermore, there was no interaction between the effects of gender and kidney status on serum urea [P = 0.598, Figure 2b]. Bonferroni adjusted post hoc analysis showed that individuals with AKI and CKD had statistically significantly elevated urea levels (20.5 ± 3.1 mmol/L and 17.7 ± 2.2 mmol/L, respectively) than the normal control group levels (3.9 ± 1.9 mmol/L), P < 0.001 for both comparisons. Whereas there was no statistical difference between AKI and CKD creatinine levels (P = 1.0).
Kidney injury molecule-1
The main effect kidney status and main effect gender both showed no difference in KIM-1 levels across kidney status and gender, P = 0.078, and P = 0.096, respectively. Furthermore, there was no significant interaction between the effects of gender and kidney status on KIM-1 levels [P = 0.213, Figure 2c].
Microalbuminuria
The main effect kidney status and main effect gender both showed statistically significant differences in MAU levels across kidney status and gender, P < 0.001, and P = 0.003, respectively. There was a statistically significant interaction between the effects of gender and kidney status on MAU [P = 0.002, Figure 2d]. Post hoc test with a Bonferroni adjustment showed that individuals with AKI and CKD had statistically significantly raised MAU (122.7 ± 16.5 μg/mL and 130.6 ± 11.5 μg/mL, respectively) than control group levels (16.3 ± 9.5 μg/mL) (P < 0.001 and P < 0.001, respectively).
Discussion
Our results as demonstrated on ROC curves AUCs revealed that the ROC models of urea and creatinine best distinguishes individual with and without kidney disease and support the advantage of serum urea and creatinine over MAU and even more so better than KIM-1 in the diagnosis of kidney disease [Figure 1 and Table 1]. Creatinine AUC-ROC of >0.90 also have been reported and showing that serum creatinine is a good predictor of kidney disease.[15] In addition, creatinine AUC increased as the cut-off value for serum creatinine increased, indicating that the diagnostic accuracy of serum creatinine improves as renal function worsens.[16] Likewise, this could be inferred on urea as urea and creatinine showed similar AUCs and excellent agreement as measured using Cohen's kappa statistic [Table 2]. Our results also support the occurrence of MAU as a relevant marker of kidney disease as previously suggested.[17] Moreover, our KIM-1 AUC (0.35 ± 0.124) value was inconsistent with other studies that demonstrated KIM-1 AUC-ROC ranging from 0.52 to 0.98.[8,18] However, it might be argued that such a broad range of reported values may indicate inconsistency, consequently provides little confidence of KIM-1 as a biomarker for diagnosis of kidney disease.
Table 1.
Area under the receiver-operator characteristic curve for kidney biomarkers
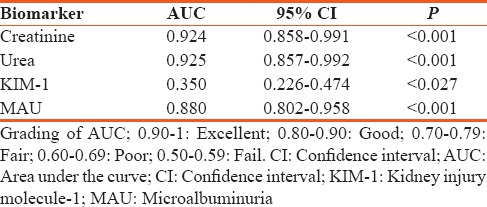
Table 2.
Specificity, sensitivity, positive predictive values, negative predictive values and diagnostic efficiency of creatinine, urea, kidney injury molecule-1, and microalbuminuria

Calculated sensitivity, specificity, positive and negative predictive values further supported the advantage of urea and creatinine by their comparably high diagnostic sensitivity and excellent specificity, and negative and positive predictive values [Table 3]. KIM-1 further exhibited a dismal overall diagnostic efficiency of 0.56, which is not far off a coin toss, suggesting that KIM-1 may not only be inferior to urea, creatinine, or MAU for that matter but also that it might be inappropriate for diagnosis of kidney disease.[19] These findings further support the observed low AUC-ROC [Figure 1] plot below the reference line, which specifies anything useful for predicting a particular condition–kidney disease in our case.[20]
Table 3.
Agreement of creatinine and urea, kidney injury molecule-1, and microalbuminuria on detecting kidney disease
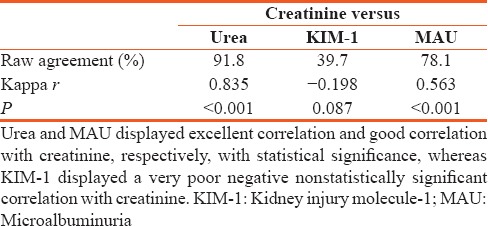
Our logistic regression analysis revealed that urea and creatinine had an excellent predictability of kidney disease. In addition, we revealed that KIM-1 prediction of kidney disease might be poor as only 4.6% of kidney disease were predicated, whereas MAU exhibits a strong predictability of kidney disease.[21,22] Moreover, a combined logistic regression model of both urea and creatinine to predict kidney disease correctly classified 93.2% of cases, demonstrating that the use of both tests simultaneously offers a slight advantage. Adding MAU to this model produced a marginal increase of 1.4% in overall diagnostic efficiency and correctly classified 94.6% of the cases. However, consideration of this increase in overall efficiency together with important concerns in medical practice such as cost, time, and labor discourages us from suggesting the use of all three tests on patients.[3]
We further analyzed for interaction between kidney status (AKI, CKD, and normal function) since the detected biomarker quantities may vary with the type of kidney disease and gender and other factors.[3] Here, we demonstrated that serum creatinine and urea varied across different kidney statuses but not with gender, with the lowest levels of both biomarkers present among those with normal kidney function, thus, adding further impetus that urea and creatinine are elevated in kidney disease. Nonetheless, it worth stating that creatinine levels were as expected higher in males than females with normal kidney function as suggested elsewhere [Figure 3].[23]
Despite various compelling evidence presented here, it should be noted that for a biomarker to be considered better than another, other considerations need to be taken into account such as organ specificity, cost, quickly and reliably measured, noninvasiveness, and use for monitoring and prognosis.[6] More importantly, this means we ought to be adept to reach a compromise as to which biomarker best meets the criteria of a perfect biomarker – serum creatinine and urea do practically so mainly in the context of cost and quickly and reliably measured. We are not blinded, however, from the elements that urea and creatinine endure valid scrutiny and reports of low diagnostic values in numerous studies is undeniable.[6,24,25,26] However, our findings present compelling evidence, and it ought to be noted also that performance characteristics reported here could be lower than those expected in clinical practice, due to availability of a complementary clinical diagnosis and other patient data such as persons at risk of developing kidney disease, recurring disease, persistent urinary infections and obstruction, cardiovascular and hepatic disease, nephritic drugs, and among others,[3,27] all which are factors of the medical diagnosis equation.
Conversely, the professed perfect biomarker may not be upon us for years to come, or simply, may be a myth, or may lie elsewhere, such as in the science of biosensors,[28,29,30] or biomathematics and algorithm,[31,32] even this remains highly speculative. Since other options are lacking, accordingly, as we hope, speculate and evaluate, we should continue applying the current sensitive biomarkers with “questionable confidence” – conscious that urea and creatinine meet the fundamental diagnostic tenets of a biological test – to estimate according to its quantity, the presence or absence of disease, and if present, its severity.
Conclusion
Our results indicate that elevated serum creatinine and urea above a specific cut-off point reliably identifies patients with AKI and CKD. Improved overall test efficiency to predict kidney disease may be obtained by combining urea and creatinine measurement in patients simultaneously. MAU showed capacity as a good biomarker for kidney disease, whereas KIM-1 performance was overall unsatisfactory. However, larger prospective studies are warranted with the goal of confirming our observations and to further validate the biological efficiency and application of MAU and KIM-1.
Financial support and sponsorship
This work was financially supported by grant No. 5R24TW008873 administered by the Fogarty International Center of the National Institutes of Health and Funded by OGAC and OAR and The University of Zambia.
Conflicts of interest
There are no conflicts of interest.
References
- 1.Liangos O, Perianayagam MC, Vaidya VS, Han WK, Wald R, Tighiouart H, et al. Urinary N-acetyl-beta-(D)-glucosaminidase activity and kidney injury molecule-1 level are associated with adverse outcomes in acute renal failure. J Am Soc Nephrol. 2007;18:904–12. doi: 10.1681/ASN.2006030221. [DOI] [PubMed] [Google Scholar]
- 2.Lo LJ, Go AS, Chertow GM, McCulloch CE, Fan D, Ordoñez JD, et al. Dialysis-requiring acute renal failure increases the risk of progressive chronic kidney disease. Kidney Int. 2009;76:893–9. doi: 10.1038/ki.2009.289. [DOI] [PMC free article] [PubMed] [Google Scholar]
- 3.Burtis CA, Ashwood ER, Bruns DE. Tietz Textbook of Clinical Chemistry and Molecular Diagnostics. St. Louis, MO: Elsevier Saunders: Elsevier Health Sciences; 2012. [Google Scholar]
- 4.Lewington AJ, Cerdá J, Mehta RL. Raising awareness of acute kidney injury: A global perspective of a silent killer. Kidney Int. 2013;84:457–67. doi: 10.1038/ki.2013.153. [DOI] [PMC free article] [PubMed] [Google Scholar]
- 5.Lameire NH, Bagga A, Cruz D, De Maeseneer J, Endre Z, Kellum JA, et al. Acute kidney injury: An increasing global concern. Lancet. 2013;382:170–9. doi: 10.1016/S0140-6736(13)60647-9. [DOI] [PubMed] [Google Scholar]
- 6.Urbschat A, Obermüller N, Haferkamp A. Biomarkers of kidney injury. Biomarkers. 2011;16(Suppl 1):S22–30. doi: 10.3109/1354750X.2011.587129. [DOI] [PubMed] [Google Scholar]
- 7.Hosohata K, Ando H, Takeshita Y, Misu H, Takamura T, Kaneko S, et al. Urinary Kim-1 is a sensitive biomarker for the early stage of diabetic nephropathy in Otsuka long-evans Tokushima fatty rats. Diab Vasc Dis Res. 2014;11:243–50. doi: 10.1177/1479164114531299. [DOI] [PubMed] [Google Scholar]
- 8.Sabbisetti VS, Waikar SS, Antoine DJ, Smiles A, Wang C, Ravisankar A, et al. Blood kidney injury molecule-1 is a biomarker of acute and chronic kidney injury and predicts progression to ESRD in type I diabetes. J Am Soc Nephrol. 2014;25:2177–86. doi: 10.1681/ASN.2013070758. [DOI] [PMC free article] [PubMed] [Google Scholar]
- 9.Kaiser T, Kinny-Köster B, Bartels M, Parthaune T, Schmidt M, Thiery J. Impact of different creatinine measurement methods on liver transplant allocation. PLoS One. 2014;9:e90015. doi: 10.1371/journal.pone.0090015. [DOI] [PMC free article] [PubMed] [Google Scholar]
- 10.Peake M, Whiting M. Measurement of serum creatinine – Current status and future goals. Clin Biochem Rev. 2006;27:173–84. [PMC free article] [PubMed] [Google Scholar]
- 11.Smith GL, Shlipak MG, Havranek EP, Foody JM, Masoudi FA, Rathore SS, et al. Serum urea nitrogen, creatinine, and estimators of renal function: Mortality in older patients with cardiovascular disease. Arch Intern Med. 2006;166:1134–42. doi: 10.1001/archinte.166.10.1134. [DOI] [PubMed] [Google Scholar]
- 12.Hanley JA, McNeil BJ. The meaning and use of the area under a receiver operating characteristic (ROC) curve. Radiology. 1982;143:29–36. doi: 10.1148/radiology.143.1.7063747. [DOI] [PubMed] [Google Scholar]
- 13.Soureshjani MH, Kimiagari AM. Calculating the best cut off point using logistic regression and neural network on credit scoring problem – A case study of a commercial bank. Afr J Bus Manage. 2013;7:1414–21. [Google Scholar]
- 14.Khan KS, Chien PF. Evaluation of a clinical test. I: Assessment of reliability. BJOG. 2001;108:562–7. doi: 10.1111/j.1471-0528.2001.00150.x. [DOI] [PubMed] [Google Scholar]
- 15.Yashiro M, Kamata T, Segawa H, Kadoya Y, Murakami T, Muso E. Comparisons of cystatin C with creatinine for evaluation of renal function in chronic kidney disease. Clin Exp Nephrol. 2009;13:598–604. doi: 10.1007/s10157-009-0202-6. [DOI] [PubMed] [Google Scholar]
- 16.Couchoud C, Pozet N, Labeeuw M, Pouteil-Noble C. Screening early renal failure: Cut-off values for serum creatinine as an indicator of renal impairment. Kidney Int. 1999;55:1878–84. doi: 10.1046/j.1523-1755.1999.00411.x. [DOI] [PubMed] [Google Scholar]
- 17.Glassock RJ. Is the presence of microalbuminuria a relevant marker of kidney disease? Curr Hypertens Rep. 2010;12:364–8. doi: 10.1007/s11906-010-0133-3. [DOI] [PMC free article] [PubMed] [Google Scholar]
- 18.Coca SG, Yalavarthy R, Concato J, Parikh CR. Biomarkers for the diagnosis and risk stratification of acute kidney injury: A systematic review. Kidney Int. 2008;73:1008–16. doi: 10.1038/sj.ki.5002729. [DOI] [PubMed] [Google Scholar]
- 19.Hajian-Tilaki K. Receiver operating characteristic (ROC) curve analysis for medical diagnostic test evaluation. Caspian J Intern Med. 2013;4:627–35. [PMC free article] [PubMed] [Google Scholar]
- 20.Zweig MH, Campbell G. Receiver-operating characteristic (ROC) plots: A fundamental evaluation tool in clinical medicine. Clin Chem. 1993;39:561–77. [PubMed] [Google Scholar]
- 21.Hajian-Tilaki KO, Gholizadehpasha AR, Bozorgzadeh S, Hajian-Tilaki E. Body mass index and waist circumference are predictor biomarkers of breast cancer risk in Iranian women. Med Oncol. 2011;28:1296–301. doi: 10.1007/s12032-010-9629-6. [DOI] [PubMed] [Google Scholar]
- 22.Bewick V, Cheek L, Ball J. Statistics review 14: Logistic regression. Crit Care. 2005;9:112–8. doi: 10.1186/cc3045. [DOI] [PMC free article] [PubMed] [Google Scholar]
- 23.Stevens LA, Coresh J, Schmid CH, Feldman HI, Froissart M, Kusek J, et al. Estimating GFR using serum cystatin C alone and in combination with serum creatinine: A pooled analysis of 3,418 individuals with CKD. Am J Kidney Dis. 2008;51:395–406. doi: 10.1053/j.ajkd.2007.11.018. [DOI] [PMC free article] [PubMed] [Google Scholar]
- 24.Fassett RG, Venuthurupalli SK, Gobe GC, Coombes JS, Cooper MA, Hoy WE. Biomarkers in chronic kidney disease: A review. Kidney Int. 2011;80:806–21. doi: 10.1038/ki.2011.198. [DOI] [PubMed] [Google Scholar]
- 25.Han WK, Bailly V, Abichandani R, Thadhani R, Bonventre JV. Kidney injury molecule-1 (KIM-1): A novel biomarker for human renal proximal tubule injury. Kidney Int. 2002;62:237–44. doi: 10.1046/j.1523-1755.2002.00433.x. [DOI] [PubMed] [Google Scholar]
- 26.Tesch GH. Review: Serum and urine biomarkers of kidney disease: A pathophysiological perspective. Nephrology (Carlton) 2010;15:609–16. doi: 10.1111/j.1440-1797.2010.01361.x. [DOI] [PubMed] [Google Scholar]
- 27.London GM. Cardiovascular disease in chronic renal failure: Pathophysiologic aspects. Semin Dial. 2003;16:85–94. doi: 10.1046/j.1525-139x.2003.16023.x. [DOI] [PubMed] [Google Scholar]
- 28.Chang YF, Chao CH, Lin LY, Tsai CH, Chou C, Lee YJ. Determination of urine cofilin-1 level in acute kidney injury using a high-throughput localized surface plasmon-coupled fluorescence biosensor. J Biomed Opt. 2014;19:11004. doi: 10.1117/1.JBO.19.1.011004. [DOI] [PubMed] [Google Scholar]
- 29.Ching CT, Sun TP, Jheng DY, Tsai HW, Shieh HL. A creatinine biosensor based on admittance measurement. In: Mohseni H, Agahi MH, Razeghi M, editors. International Society for Optics and Photonics. 2015. p. 95500N. [Google Scholar]
- 30.Monošík R, Stred'anský M, Šturdík E. Application of electrochemical biosensors in clinical diagnosis. J Clin Lab Anal. 2012;26:22–34. doi: 10.1002/jcla.20500. [DOI] [PMC free article] [PubMed] [Google Scholar]
- 31.Fleet JL, Dixon SN, Shariff SZ, Quinn RR, Nash DM, Harel Z, et al. Detecting chronic kidney disease in population-based administrative databases using an algorithm of hospital encounter and physician claim codes. BMC Nephrol. 2013;14:81. doi: 10.1186/1471-2369-14-81. [DOI] [PMC free article] [PubMed] [Google Scholar]
- 32.Sis B, Jhangri GS, Riopel J, Chang J, de Freitas DG, Hidalgo L, et al. A new diagnostic algorithm for antibody-mediated microcirculation inflammation in kidney transplants. Am J Transplant. 2012;12:1168–79. doi: 10.1111/j.1600-6143.2011.03931.x. [DOI] [PubMed] [Google Scholar]


