

Abstract
Monitoring the fluorescence of proteins, particularly the fluorescence of intrinsic tryptophan residues, is a popular method often used in the analysis of unfolding transitions (induced by temperature, chemical denaturant, and pH) in proteins. The tryptophan fluorescence provides several suitable parameters, such as steady‐state fluorescence intensity, apparent quantum yield, mean fluorescence lifetime, position of emission maximum that are often utilized for the observation of the conformational/unfolding transitions of proteins. In addition, the fluorescence intensities ratio at different wavelengths (usually at 330 nm and 350 nm) is becoming an increasingly popular parameter for the evaluation of thermal transitions. We show that, under certain conditions, the use of this parameter for the analysis of unfolding transitions leads to the incorrect determination of thermodynamic parameters characterizing unfolding transitions in proteins (e.g., melting temperature) and, hence, can compromise the hit identification during high‐throughput drug screening campaigns.
Keywords: tryptophan fluorescence, intrinsic protein fluorescence, protein denaturation, melting temperature
Introduction and Discussion
An analysis of unfolding transitions, induced by temperature, chemical denaturants, and pH, provides important information regarding protein stability. Consequently, this information plays a critical role for the further development of pharmacological and biotechnological utilizations of proteins. Among numerous biophysical techniques (methods of optical spectroscopy, differential scanning calorimetry) available for the determination of protein stability, spectroscopic techniques have certain advantages. The main advantages of these techniques, such as absorption, circular dichroism, and fluorescence spectroscopy, are ease of sample preparation, high sensitivity (thus low amounts of precious proteins are required), short measurement time, and the relative simplicity of the analysis of the data. Intrinsic tryptophan (Trp) fluorescence is of a particular interest because of the high sensitivity of its excited state, which responds very sensitively to properties of its local microenvironment. As a result, the intrinsic Trp fluorescence provides several suitable parameters, such as steady‐state fluorescence intensity, apparent quantum yield, mean fluorescence lifetime,1, 2 fluorescence anisotropy,3 and the position of the emission maximum,4, 5 all of which can be used in the analysis of protein stability. It has previously been pointed out that the critical condition for using any of these signals is whether the signal is proportional to the population of macrostates.2, 5 In fact, of all the commonly used fluorescence signals, this criterion is fulfilled only for the fluorescence emission intensity measured at some pair of excitation and emission wavelengths.5 Other, above mentioned, fluorescence signals have to be analyzed in more complex ways, for example they have to be corrected by weighting both the fraction of states and by the fluorescence quantum yield of each state2 and/or these signals have to be analyzed in combination.3 For example, steady‐state fluorescence anisotropy does not directly track the population states and caution must be taken in attempting to obtain thermodynamic parameters from such experiments. However, a combined analysis with fluorescence total intensity may provide insights into reaction mechanisms, which could not be obtained by either data type in isolation.3 Here, we demonstrate that another commonly used fluorescence parameter, the ratio of fluorescence emissions at two different wavelengths belongs to the latter group of fluorescence signals, which are used in thermodynamic analyses of conformational transitions of proteins and, hence, needs to be analyzed with caution.
The two‐step unfolding transitions of proteins monitored by extensive signals, such as fluorescence intensity, can be described by the equation derived by Santoro and Bolen, in which the fluorescence signal is weighted by the fraction of the macrostates, that is, native and denatured states6:
| (1) |
where S obs, S N, and S D are signals corresponding to experimentally measured, native and denatured states, respectively. The variable x corresponds to perturbation variables, such as temperature, denaturant (usually urea or guanidium chloride) concentration, or pH. The parameters m N and m D are the slopes of linear dependences of the pre‐ and post‐denaturation states on x, respectively. The parameter K in Eq. (1) corresponds to the equilibrium constant between denatured (unfolded) and native (folded) states, . This parameter can be expressed as a function of a perturbation variable in the following forms:
(i) when x corresponds to temperature
| (2) |
where ΔH vH, R, T, and T m correspond to van't Hoff enthalpy of the transition (which assumes to be constant within the transition region), gas constant (8.314 J mol−1 K−1), temperature (in K), and melting temperature, respectively.
(ii) when x corresponds to denaturant concentration
| (3) |
where ΔG 0, m, and [D] correspond to Gibbs free energy of the transition in the absence of a denaturant, the so‐called m‐value,6, 7 and denaturant concentration, respectively.
(iii) when x corresponds to pH
| (4) |
where n and pK a correspond to the number of protons involved in the transition and the pK a‐value of the transition, respectively.
The high sensitivity of the intrinsic Trp fluorescence to its microenvironment has, in addition to number of advantages, several disadvantages. Temperature, chemical denaturant, and pH‐induced conformational changes affect Trp fluorescence by two mechanisms: (i) changes in the polarity of Trp surrounding and (ii) changes in the quenching effects on Trp fluorescence. Due to conformational changes accompanied an unfolding process, the polarity of Trp residue(s) surrounding(s) increases and maximum of the emission intensity is shifted toward longer wavelengths. Denaturation‐induced changes in quenching effects on Trp residue(s) fluorescence are quite complex as quenching can arise (i) intramolecularly from various Trp‐neighboring amino acid residues, such as cysteine/cystine, histidine, tyrosine, lysine, asparagines, glutamine, and aspartic and glutamic acids,8 or (ii) intermolecularly due to collisional/dynamics quenching Trp fluorescence by solvent molecules, particularly at high temperatures.9, 10 As a consequence of these effects, a dependence of the fluorescence emission intensity at given wavelength(s) may be relatively complex, which makes analysis of such dependences difficult.11, 12 Therefore, an empirical parameter that equals the ratio of the fluorescence intensities at two different wavelengths, most commonly at 330 nm and 350 nm, has been utilized.11, 12, 13, 14, 15, 16, 17 This approach has been used as a complementary method for deriving thermodynamic parameters describing unfolding transitions, particularly in high‐throughput analyses, such as preformulation development.11, 12, 16
In fact, the parameter Fa/Fb, in which Fa and Fb stand for the emission intensities at the wavelengths a and b, respectively, leads to smoother and “better‐looking” transition curves. This may be partially explained by the counterbalancing effect of the division of emission intensities, for example in the case of steep pre‐ and/or post‐denaturation linear dependences (described by the parameter m N or m D in Eq. (1)), or the instability of the lamp light intensity during measurements or scattered light from micro‐particles (e.g., dust, aggregates). Moreover, the resulting parameters, such as melting temperatures, T m, or change in the Gibbs free energies, ΔG 0, are usually similar to the values of these parameters calculated by other methods. However, here we show that despite these observations, the parameters extracted from the dependences Fa/Fb vs. the perturbation variable are not absolutely correct and at certain conditions may lead to erroneous conclusions. In fact, a systematic difference in T m values determined from dependence of Fa/Fb and those determined by differential scanning calorimetry was observed before, but this discrepancy was not further analyzed.12
To explain this phenomenon, we have used a simplified equation describing the unfolding process, that is, the transition at which pre‐ and post‐denaturation dependences do not depend on a perturbation variable (i.e., m N = m D = 0 in Eq. (1)). In such a case, Eq. (1) can be re‐written as follows:
| (5) |
where the parameters S obs, S N, S D, and K have the same meaning as explained above.
The dependences of the signals monitoring the same unfolding process at wavelengths a and b may be written in the following form:
for the signal monitored at wavelength aand analogously
for the signal monitored at wavelength b.
Consequently, the ratio Fa/Fb can be expressed as:
| (6a) |
or
| (6b) |
From the algebraic point of view, Eqs. (5) and (6b) differ due to the component in the denominator when . This is, in fact, always true as to monitor unfolding processes one chooses a signal, whose value differs at a given wavelength b for native and denatured states.
Figure 1 demonstrates how the value of the parameter affects the determination of the melting temperature, T m, in the temperature‐induced unfolding transition and the corresponding values are listed in Table 1. Table 1 contains analogously calculated data for the chemically and pH‐induced transitions, that is, ΔG0 and pK a values, respectively. When the ratio lies within an interval 0.67 and 1.5 (Table 1), it is evident that the parameters characterizing the transitions obtained from the dependences vs. temperature, denaturant concentration, or pH may be considered accurate, that is, within uncertainties of measurements. In fact, in cases of published dependences vs. perturbation variables, the ratio usually lies within this interval which explains why the values obtained from the dependences vs. perturbation variables usually agree (within uncertainties of measurements) with the parameters obtained by using other methods. However, when the ratio is out of this interval, the error in the determining the parameters characterizing the transitions can significantly affect the interpretation of the transitions.
Figure 1.
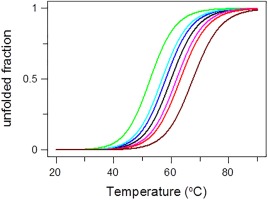
Dependence of thermal denaturation transition on the value of the parameter from Eq. (6b). is equal: 5 (green), 2 (cyan), 1.5 (blue), 1 (black), 0.67 (purple), 0.5 (red), and 0.2 (dark red). Corresponding values of calculated T m are listed in Table 1.
Table 1.
Dependence of Tm, ΔG0 and pKa on the Parameter
| S D b/S N b | T m (°C) | ΔT m (%)a | ΔG o (kJ/mol) | ΔΔG o (%)a | pK a | ΔpK a (%)a |
|---|---|---|---|---|---|---|
| 0.2 | 67.6 | 12.7 | 29.0 | 16.0 | 3.3 | 17.5 |
| 0.5 | 63.2 | 5.3 | 26.7 | 6.8 | 3.7 | 7.5 |
| 0.67 | 61.9 | 3.2 | 26.0 | 4.0 | 3.8 | 5.0 |
| 1b | 60.0 | 0.0 | 25.0 | 0.0 | 4.0 | 0.0 |
| 1.5 | 58.1 | 3.2 | 24.0 | 4.0 | 4.2 | 5.0 |
| 2 | 56.8 | 5.3 | 23.3 | 6.8 | 4.3 | 7.5 |
| 5 | 52.3 | 12.7 | 21.0 | 16.0 | 4.7 | 17.5 |
The Δ values of the obtained parameters were calculated as a relative difference of the parameter at given value of S Db/S Nb and the value S Db/S Nb = 1, e.g. for T m: (T m – )/ × 100% and analogously for all other parameters.
Calculated parameters are identical with the parameters obtained from corresponding equations: (i) the thermal transition described by Eqs. (2) and (5) is characterized by T m = 60°C and ΔH vH = 200 kJ/mol, (ii) the chemically induced transition described by Eqs. (3) and (5) is characterized by ΔG 0 = 25 kJ/mol and m = 5 kJ/(mol protein)/(mol denaturant), and (iii) the pH‐induced transition described by Eqs. (4) and (5) is characterized by pK a = 4.0 and n = 1.
To summarize, even though the ratio might be helpful in analysis of unfolding transition in proteins, for example when the individual signals at Fa and Fb are complex, researchers should be aware of limited validity. From dependences of the vs. perturbation variables, one cannot in principle extract correct thermodynamic parameters under all conditions and, thus, the fluorescence ratio is not a completely reliable parameter for evaluating thermal transitions. Because depends on solvent composition, hit identification during high‐throughput drug screening campaigns (which identify a hit based on the shift of the melting temperature of protein target) can be compromised in two ways; an apparent shift in the melting temperature due to a decrease in the ratio (false positive hit) or, in a much worse case, a negligible shift in melting temperature due to compensating effects of an increase in the melting temperature (hit) and an increase of the ratio. In the latter case, a real hit is mistakenly interpreted as a negative result which has tremendous effect for further processing. While false positive hits are further evaluated by standard techniques and can be sorted out, false negative hits are rarely or never analyzed again using additional techniques which can lead to a failure to identify a potentially life‐saving drug.
Acknowledgment
Authors thank Dr. Stephen Starck for his editorial help in preparing the manuscript. The authors have no conflict of interest to declare.
References
- 1. Permyakov EA, Burstein EA (1984) Some aspects of studies of thermal transitions in proteins by means of their intrinsic fluorescence. Biophys Chem 19:265–271. [DOI] [PubMed] [Google Scholar]
- 2. Eftink MR (1994) The use of fluorescence methods to monitor unfolding transitions in proteins. Biophys J 66:482–501. [DOI] [PMC free article] [PubMed] [Google Scholar]
- 3. Otto MR, Lillo MP, Beechem JM (1994) Resolution of multiphasic reactions by the combination of fluorescence total‐intensity and anisotropy stopped‐flow kinetic experiments. Biophys J 67:2511–2521. [DOI] [PMC free article] [PubMed] [Google Scholar]
- 4. Monsellier E, Bedouelle H (2005) Quantitative measurement of protein stability from unfolding equilibria monitored with the fluorescence maximum wavelength. Protein Eng Des Sel 18:445–456. [DOI] [PubMed] [Google Scholar]
- 5. Moon CP, Fleming KG (2011) Using tryptophan fluorescence to measure the stability of membrane proteins folded in liposomes. Methods Enzymol 492:189–211. [DOI] [PMC free article] [PubMed] [Google Scholar]
- 6. Santoro MM, Bolen DW (1988) Unfolding free energy changes determined by the linear extrapolation method. I. Unfolding of phenylmethanesulfonyl alpha‐chymotrypsin using different denaturants. Biochemistry 27:8063–8068. [DOI] [PubMed] [Google Scholar]
- 7. Auton M, Bolen DW (2005) Predicting the energetics of osmolyte‐induced protein folding/unfolding. Proc Natl Acad Sci USA 102:15065–15068. [DOI] [PMC free article] [PubMed] [Google Scholar]
- 8. Chen Y, Barkley MD (1998) Toward understanding tryptophan fluorescence in proteins. Biochemistry 37:9976–9982. [DOI] [PubMed] [Google Scholar]
- 9. Lakowicz JR (1983) Principles of fluorescence spectroscopy. New York: Plenum Press. [Google Scholar]
- 10. Schmid FX, Spectral methods of characterizing protein conformation and conformational changes In: Creighton TE, Ed. (1989) Protein structure. A practical approach. Oxford: IRL Press, pp 251–285. [Google Scholar]
- 11. Weichel M, Bassarab S, Garidel P (2008) Probing thermal stability of MAbs by intrinsic tryptophan fluorescence. BioProcess Int 6:42–52. [DOI] [PubMed] [Google Scholar]
- 12. Garidel P, Hegyi M, Bassarab S, Weichel M (2008) A rapid, sensitive and economical assessment of monoclonal antibody conformational stability by intrinsic tryptophan fluorescence spectroscopy. Biotechnol J 3:1201–1211. [DOI] [PubMed] [Google Scholar]
- 13. Hussain F, Sedlak E, Wittung‐Stafshede P (2007) Role of copper in folding and stability of cupredoxin‐like copper‐carrier protein CopC. Arch Biochem Biophys 467:58–66. [DOI] [PubMed] [Google Scholar]
- 14. Natalello A, Ami D, Collini M, D'Alfonso L, Chirico G, Tonon G, Scaramuzza S, Schrepfer R, Doglia SM (2012) Biophysical characterization of Met‐G‐CSF: effects of different site‐specific mono‐pegylations on protein stability and aggregation. PLoS One 7:e42511. [DOI] [PMC free article] [PubMed] [Google Scholar]
- 15. Martin L, Schwarz S, Breitsprecher D (2014) Thermal unfolding. Application Note NT023. Available at: www.nanotemper-technologies.com. Accessed: April 2, 2017.
- 16. Brader ML, Estey T, Bai S, Alston RW, Lucas KK, Lantz S, Landsman P, Maloney KM (2015) Examination of thermal unfolding and aggregation profiles of a series of developable therapeutic monoclonal antibodies. Mol Pharm 12:1005–1017. [DOI] [PubMed] [Google Scholar]
- 17. Temel DB, Landsman P, Brader ML (2016) Orthogonal methods for characterizing the unfolding of therapeutic monoclonal antibodies: differential scanning calorimetry, isothermal chemical denaturation, and intrinsic fluorescence with concomitant static light scattering. Methods Enzymol 567:359–389. [DOI] [PubMed] [Google Scholar]