Abstract
There is a need to individualize assays for tumor molecular phenotyping, given variations in the differentiation status of tumor and normal tissues in different patients. To address this, we performed single-cell genomics of breast tumors and adjacent normal cells propagated for a short duration under growth conditions that enable epithelial reprogramming. Cells analyzed were either unselected for a specific subpopulation or phenotypically defined as undifferentiated and highly clonogenic ALDH+/CD49f+/EpCAM+ luminal progenitors, which express both basal cell and luminal cell-enriched genes. We analyzed 420 tumor cells and 284 adjacent normal cells for expression of 93 genes that included a PAM50 intrinsic subtype classifier and stemness-related genes. ALDH+/CD49f+/EpCAM+ tumor and normal cells clustered differently compared to unselected tumor and normal cells. PAM50 gene-set analyses of ALDH+/CD49f+/EpCAM+ populations efficiently identified major and minor clones of tumor cells, with the major clone resembling clinical parameters of the tumor. Similarly, a stemness-associated gene set identified clones with divergent stemness pathway activation within the same tumor. This refined expression profiling technique distinguished genes truly deregulated in cancer from genes that identify cellular precursors of tumors. Collectively, the assays presented here enable more precise identification of cancer-deregulated genes, allow for early identification of therapeutically targetable tumor cell subpopulations, and ultimately provide a refinement of precision therapeutics for cancer treatment.
Keywords: breast cancer, single cell genomics, PAM50, tumor classification
Introduction
Gene expression-based molecular subclassification of tumors has gained clinical acceptance over the years and several tools have been commercialized for clinical use. Oncotype DX®, ProSigna® (PAM50) and MammaPrint (70-gene signature) are few such assays used in breast cancer management (1–4). A recent study suggested that MammaPrint assay aids in treatment decisions in early stage breast cancer, particularly to identify patients who may not need chemotherapy (5). Superiority of few of these assays in tumor classification compared to traditional immunohistochemistry based tumor classification is under debate. For example, while an earlier report claimed that PAM50 gathers more clinical information than immunohistochemistry of hormone receptors or ki67 (6), a recent study disputed such a claim (7).
While tumor classification based on gene expression patterns has been valuable clinically, further progress in these assays are needed to address two clinically important issues. First, it has been difficult to discern whether gene expression patterns in tumors that led to subtype classification are acquired due to genome aberrations or reflect cell type origin of tumors. Recent discovery of enormous inter-individual variation in gene expression in healthy tissues due to single nucleotide polymorphism in the regulatory regions of genomes makes it even harder to identify mutation-driven gene expression changes when normal cells from the same individual are not available for comparison (8,9). Second, tumor heterogeneity is a major clinical concern and the gene expression based assays may identify only major clones of the tumor. Therefore, an ideal assay should be able to identify cancer-specific aberration in gene expression and identify both major and minor clones of tumor cells.
As an initial step to address the above issues, we combined the latest progress in propagating normal and tumor cells from the same patient using an epithelial reprogramming assay (10) and single cell genomics of PAM50/stem cell associated genes (11). Unlike previously reported mammary epithelial growth conditions, which favors outgrowth of basal epithelial cells, reprogramming assay allows growth of stem, luminal progenitor and mature cells (12–14). Assays that allow growth of breast epithelial cells of different differentiation state are essential because most breast cancers including basal-like breast cancers are suggested to originate from luminal progenitors and then differentiate/dedifferentiate into specific subtypes (15–18). We have recently demonstrated that tumor and adjacent normal cells are in different differentiation state, which complicates our ability to distinguish mutation-driven gene expression changes in tumor from changes due to differences in differentiation state (14). In normal breast, >2000 genes are differentially expressed between stem/progenitor and differentiated cells (19) and these differences alone can account for tumor to normal tissue gene expression variations noted in large scale studies. To partially overcome this limitation, comparison between normal and tumors were done two ways. Assays included either bulk populations of epithelial cells or flow cytometrically enriched ALDH+/CD49f+/EpCAM+ adjacent normal and tumor cells. In normal breast, these cells are considered to be undifferentiated highly clonogenic luminal progenitors that express both basal cell and luminal cell enriched genes (20). These assays, performed with cells from four tumors and adjacent normal tissues, enabled us to identify major and minor tumor clones and distinguish genes aberrantly expressed in tumors from genes whose expression pattern in tumor mirrored expression pattern in a subset of normal cells, which are likely the cellular precursors of tumors.
Materials and Methods
Primary tissues, culturing by reprogramming assay, and flow cytometry
Breast tissues used were de-identified and the Indiana University Institutional Review Board considered the protocol non-human subjects. Freshly obtained or cryopreserved tissues were minced, digested and subjected to culturing under modified reprogramming assay condition, as we have described recently (14). All cases used in the study were from mastectomy such that adjacent normal tissues were from regions as distant as possible from the tumor. Breast epithelial cells were collected by trypsinization and subjected to flow cytometry using antibodies described previously (14).
Single cell qRT-PCR
We used the C1 Single-Cell Auto Prep System (Fluidigm) for single-cell capture and pre-amplification according to the manufacturer’s instructions (protocol 100-4904 K1). Both adjacent normal and tumor cells were grown for similar duration and in the same media and collected by flow cytometry before loading into the Integrated Fluidic Circuit (IFC). Briefly, a pool of all primers was prepared (100 μM). A lysis final mix, a reverse-transcriptase (RT) final mix and a pre-amplification (PreAmp) final mix were prepared and stored on ice. Next, the IFC for normal medium-size single cells (10 to 17 μm in diameter; Fluidigm, part number 100-5479), or the IFC for tumor large-size single cells (17–25μm in diameter; Fluidigm, part number 100-5758) was primed by adding C1 collection reagent, preloading reagent, blocking reagent and wash buffer into the IFC, and the IFC was placed into the C1 Single-Cell Auto Prep System and the script ‘STA:Prime’ was run. Priming lasted 20 min, during which time cells were prepared for loading. Cells were pelleted and media was removed to create a concentration of 300,000 cells/mL. The single-cell suspension was mixed with a 3:2 ratio of Suspension Reagent (Fluidigm). After priming was completed, blocking and priming solutions were removed and 6 μl of cell mix was loaded onto the IFC. The IFC was placed back into the C1, and the script ‘STA:Cell Load’ was run. After cell loading was complete, the IFC was removed and single-cell capture sites were viewed using a microscope. Empty capture sites were noted, and the IFC was loaded with harvest reagent, lysis final mix, RT final mix, and PreAmp final mix. The IFC was placed back into the C1, and the script ‘STA:PreAmp’ was run. After pre-amplification, the IFC was removed from the C1 and 3 μl of cDNA from each single cell was removed from individual collection wells and diluted in 25 μl of DNA suspension buffer (Fluidigm). The BioMark HD System (Fluidigm, protocol 68000088 K1) performs 96 individual qPCR reactions on the pre-amplified cDNA from every single cell by utilizing 96 × 96 Dynamic Array Gene Expression IFCs (Fluidigm, part number BMK-M-96.96). For the qPCR reactions, SsoFast EvaGreen Supermix with Low ROX (Bio-Rad, part number 172-5211) and DNA Binding Dye (Fluidigm, part number 100-7609) were combined with individual cDNA samples. The cDNA mix was loaded into one side of the IFC, and primer pairs were loaded into the other side. The Juno System (Fluidigm) was used to prime the IFC and to distribute cDNA mix and primer pairs into reaction chambers inside the IFC. The IFC was then transferred into the BioMark HD System where qPCR reactions were controlled. Data from wells that contained more than one cell or non-viable cells were excluded from the analyses.
Data analyses
Real Time PCR Analysis software is a data analysis tool available from Fluidigm as part of the Singular Analysis Toolset and can be found at https://www.fluidigm.com/software. This toolset was built on the open source software R (Version 3.0.2). These software packages were used together to annotate and analyze data files generated from the BioMark HD. Hierarchical clustering (HC) was used to identify co-expressed genes. Heatmaps and violin plots were generated to compare sample groups. Analysis of variance (ANOVA) identified differentially expressed genes (Table S1). Principal component analysis (PCA) plots were generated to analyze outliers. Differentially expressed genes were subjected to Ingenuity pathway analyses (Ingenuity.com) to identify signaling networks uniquely active in tumor cells.
Immunohistochemistry
Immunohistochemistry procedure for MMP2 (antibody from Fisher Scientific #35-130-0Z) and quantitation have been described previously (21).
Results
Single cell genomics in cancer are mostly being used to decipher tumor heterogeneity, to develop evolutionary tree, and to map cellular hierarchy (11,22,23). This technique has also been used to detect clonal selection in patient-derived breast cancer xenografts (24). While DNA-based single cell genomics, which only compares copy number variations and mutations, have seen enormous progress with respect to detection and data analysis, there are several limitations in the use of this technology for RNA-based studies including inter-individual variation in gene expression (9,25) and differences in differentiation state of tumor and normal (14). While perfection in elucidating cancer-specific gene expression changes may be impossible to achieve, refinement is possible by co-adapting several latest technologies. Figure 1A provides a schematic view of our approach towards achieving these goals.
Figure 1.
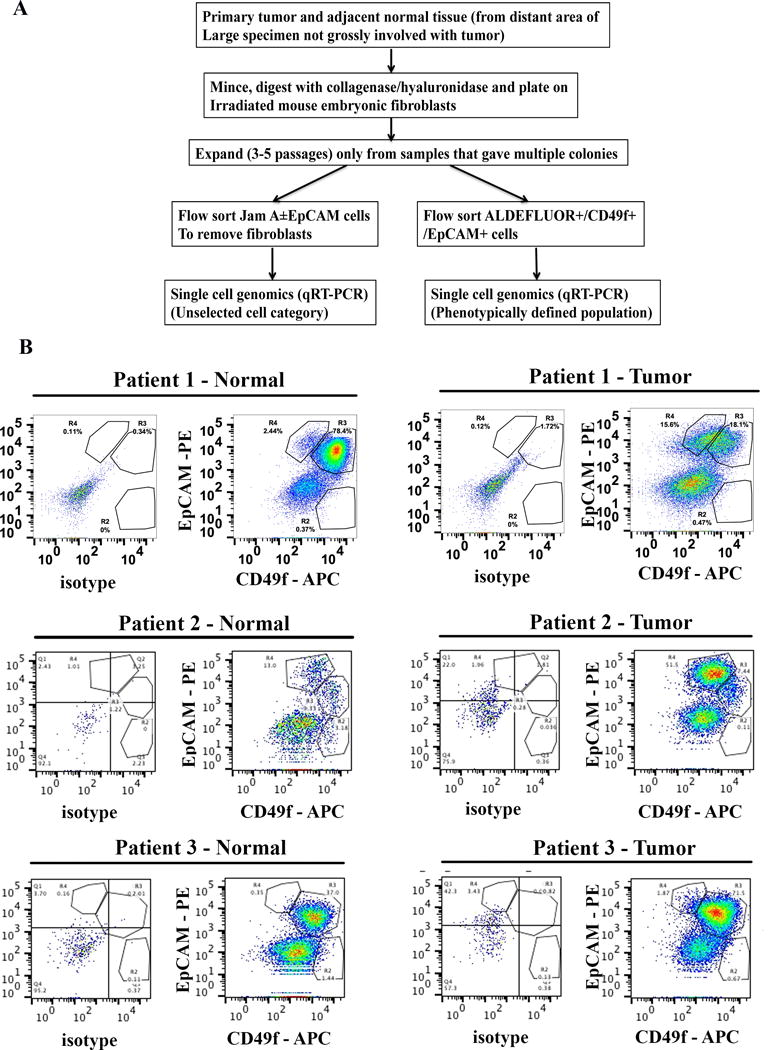
Single cell analyses scheme and samples analyzed. A) Schematic view of experimental design. B) Tumor and adjacent normal cells are in different differentiation state. Flow cytometry with CD49f and EpCAM stained cells shows different levels of CD49f+/EpCAM+ luminal progenitor and CD49f-/EpCAM+ differentiated cells in tumor and adjacent normal cells of three samples analyzed. Unstained or weakly CD49f stained cells correspond to feeder fibroblasts.
We propagated tumor and the adjacent normal tissues from four patients for a short duration using epithelial reprogramming assay (10). In our previous study, we have shown that in vitro propagation does not introduce any mutations and potentially allows expansion of minor clones (14). Tumors in Patient 1 and Patient 2 were ER+/Progesterone Receptor + (PR+), whereas Patient 3 had an ER+/PR−/HER2+ tumor. Patient 4 had ER+/PR+ tumor with extensive metastasis. Patient 2 tumor also expressed HER2 at moderately higher levels (2+). We first performed phenotypic characterization of tumor and adjacent normal cells using CD49f and EpCAM antibodies. CD49f+/EpCAM−, CD49f+/EpCAM+ and CD49f−/EpCAM+ cells are enriched for cells with stem/basal, luminal progenitor, and mature/differentiated/non-clonogenic properties, respectively (26,27). As expected, tumors of Patients 1 and 2 had higher levels of differentiated cells compared to their corresponding adjacent normal cells, whereas both tumor and the adjacent normal cells of patient 3 were enriched for luminal progenitor cells (Figure 1B). Because of these differences in stem/progenitor and differentiated cell hierarchy between tumor and normal cells, we adapted two strategies for characterizing primary cells. The first series included comparison of gene expression between randomly selected epithelial cells of tumor with normal, irrespective of their differentiation state. Epithelial cells were sorted using EpCAM and Jam-A/CD321 antibodies to avoid contamination from any non-epithelial cells (Figure 2A). The second comparison included a phenotypically defined population in which gated ALDEFLUOR+ stem/progenitor cells (28) were fractionated based on the expression of CD49f and EpCAM into CD49f+/EpCAM+ luminal progenitor cells (Figure 2B). These cells in normal breast are considered to be undifferentiated luminal progenitors with overlapping luminal and basal cell gene expression pattern (20). Therefore, this selection procedure should enhance our ability to detect relevant cancer-specific gene expression differences in undifferentiated tumor cells. Between 27 and 93 cells per sample from isolated tumor or normal cells were subjected to qRT-PCR at the single cell level with stemness-associated and PAM50 gene primers.
Figure 2.
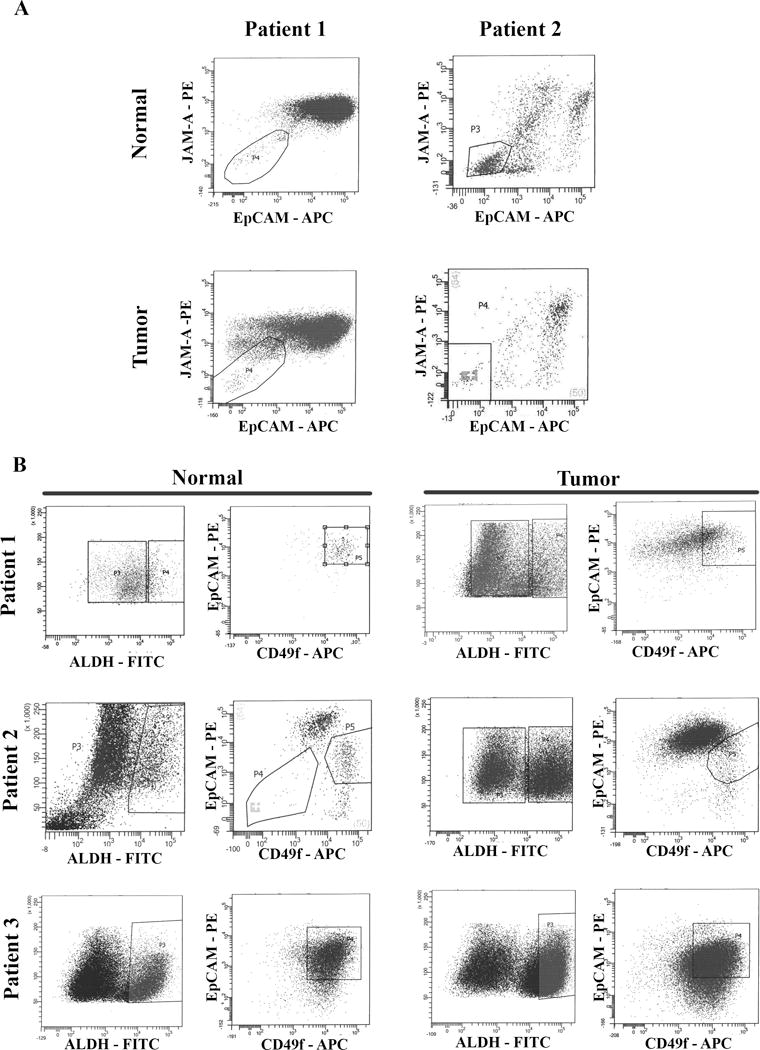
Flow cytometry sorting of cells for single cell analyses. A) Jam-A/EpCAM staining to separate breast epithelial cells from feeder layer fibroblasts. Fibroblasts do not stain for Jam-A/EpCAM. Jam-A/EpCAM positive cells were sorted and used for unselected cell analyses. B) Sorting of ALDH+/CD49f+/EpCAM+ cells to enrich for phenotypically defined cell population. CD49f+/EpCAM+ cells in the boxed regions on right were selected for analyses.
Results of unselected tumor and normal epithelial cell comparison
Unsupervised hierarchical clustering of qRT-PCR results of stemness gene set showed clear separation of tumor from normal cells in both patient samples (Figure 3A and B). Tumor cells in both cases formed 2–3 minor clusters. However, tumor-enriched signaling networks differed between patient samples. A cluster of tumor cells in patient 1 showed enrichment of genes in the Wnt/βCatenin pathway (Figure 3C). Major signals responsible for cancer cell dedifferentiation and germ cell fate including SOX9 and SOX17 were upregulated in tumor cells compared to normal cells (29,30). A cluster of tumor cells in patient 2 likely have an activated Wnt/βCatenin pathway but it is most likely due to down regulation of APC and AXIN1, which are negative regulators of Wnt/β-Catenin pathway (Figure 3D) (31).
Figure 3.
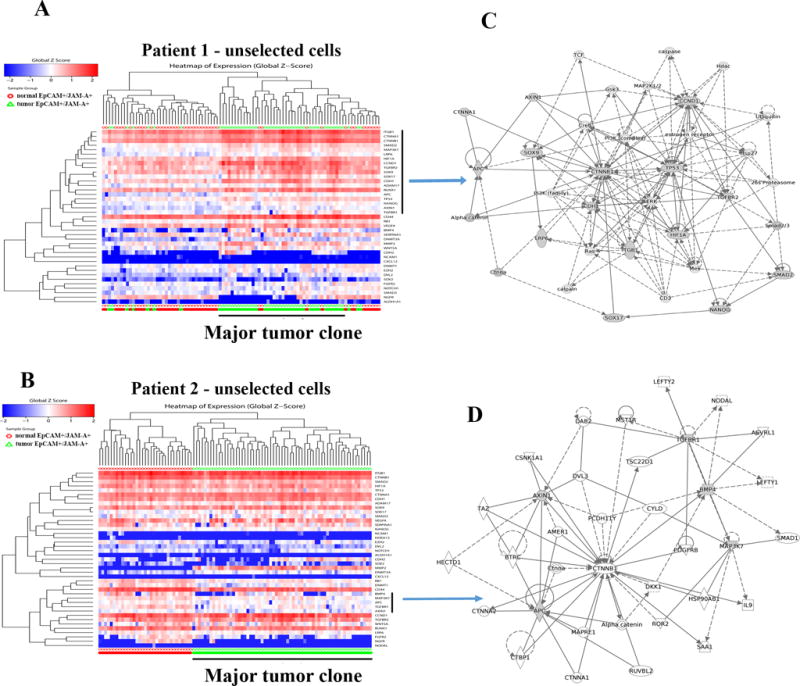
Genes linked to stemness differentiate tumor cells from normal cells. A) Heatmap depicting expression pattern of stemness-associated genes in unselected cells of tumor and adjacent normal of patient 1. A vertical bar on right side denotes genes overexpressed in tumor cells compared to normal cells. Red and green bars at the bottom indicate normal and tumor cells, respectively. B) Heatmap depicting expression pattern of stemness-associated genes in unselected cells of tumor and adjacent normal of patient 2. A vertical bar on the right side denotes genes that are expressed at a lower level in tumor cells compared to normal. C) Stemness cell signaling network uniquely active in tumor cells of patient 1. Network was generated using genes indicated by a vertical bar in A. Genes with shaded boxes in the network are differentially expressed in tumor cells compared to normal cells. D) Signaling network in tumor cells in patient 2. Negative regulators of Wnt signaling pathway such as AXIN1 and APC were expressed at lower levels in tumor cells compared to normal cells.
PAM50 gene set analyses enabled characterization of tumor and normal cells at multiple levels. First, Jam-A±EpCAM+ cells used in the analyses are epithelial because these cells expressed variable levels of keratin 5, keratin 17, epidermal growth factor receptor (EGFR) and ERBB2 (Figure 4A). Keratin 5 and 17, although expressed predominantly in basal cells, are expressed in luminal cells, particularly cells with luminal A breast cancer gene expression pattern (32). Second, most often cultured breast epithelial cells are enriched for basal gene expression. Although our previous phenotypic analyses have shown that reprogramming assay conditions allow growth of both luminal and basal cells, this has not been proven at transcriptome level (14). In case of patient 1, normal cells were randomly distributed with one relatively large cluster with interspersed tumor cells and a minor cluster. The major cluster of normal cells expressed both basal and luminal cell-enriched genes, whereas the minor cluster expressed mostly luminal cell-enriched genes (Figure 4A). Tumor cells formed two well-separated clusters, one expressing predominantly luminal cell-enriched genes and the other expressing both luminal and basal cell-enriched genes. Similar results in patient 2 with majority of tumor cells forming a single cluster that predominantly expressed luminal genes (Figure 4B). Majority of normal cells expressed both luminal and basal genes. Third, PAM50 gene set analyses confirmed heterogeneity in gene expression pattern in both tumor and normal cells of the same patient.
Figure 4.
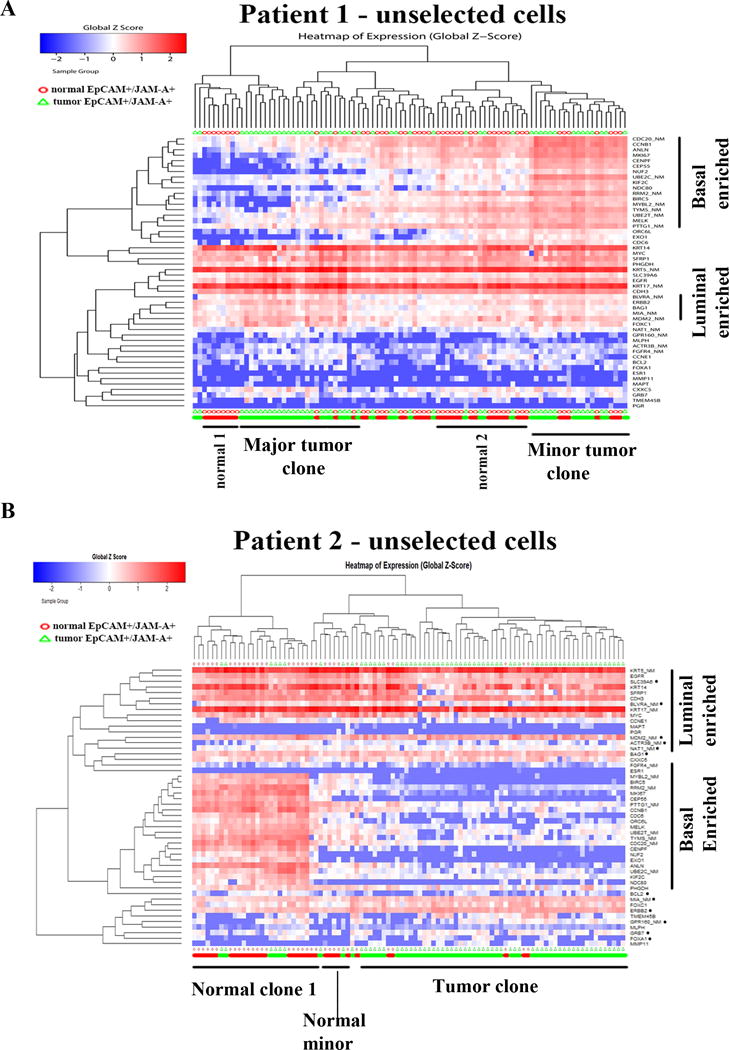
PAM50 gene set analyses identify cells with luminal-enriched, basal-enriched or hybrid gene expression patterns. A) Heatmap depicting expression pattern of PAM50 genes in unselected cells of tumor and adjacent normal of patient 1. Red and green bars at the bottom indicate normal and tumor cells, respectively. Unlike with stemness-associated gene set analyses, tumor and normal did not separate clearly into two groups. B) Heatmap depicting expression pattern of PAM50 genes in tumor and normal cells of patient 2.
Tumor classification based on differential gene expression in phenotypically defined tumor and normal cells
To overcome difference in differentiation state between two cell types as a confounding factor in identification of cancer-specific gene expression changes, we performed the analyses in a phenotypically defined ALDH+/CD49f+/EpCAM+ subpopulation. CD49f+/EpCAM− and/or CD44+/CD24− cells, although considered much more stem/basal like, were not selected for the analysis because these cells constituted a minor population in both normal and tumors (Figure 1B and data not shown).
With stemness-associated gene primer sets, normal and tumor cells segregated into two distinct groups in patient 1 (Figure 5A). This analysis distinguished tumor cells from normal cells much more clearly than the analysis that involved unselected epithelial cells shown in Figure 3A. Ingenuity pathway analyses of genes that are expressed at higher levels in tumor cells compared to normal cells identified two signaling networks; one involving VEGFA, WNT5A, SMAD3, and MMP2 and the other involving DNMT3A (Figure 5B). In patient 2, tumor cells formed two unique clusters; one being very similar to normal cells and other showing very little expression of stemness-associated genes (Figure 5C). Pathways that involved β-Catenin signaling and stemness-associated genes SOX9 and SOX17 were dominant in the major tumor clone (Figure 5D). In patient 3, tumor cells formed one major cluster, which differed from normal cells through differential expression of NGFR and SERPINA1 (Figure 5E). Tumor cells also lacked the expression of CDH2, which further indicates luminal nature of tumor cells. Similar analysis of tumor and normal of patient 4 is shown in Figure S1. Tumor cells were enriched for the expression of Wnt/β-Catenin pathway genes.
Figure 5.
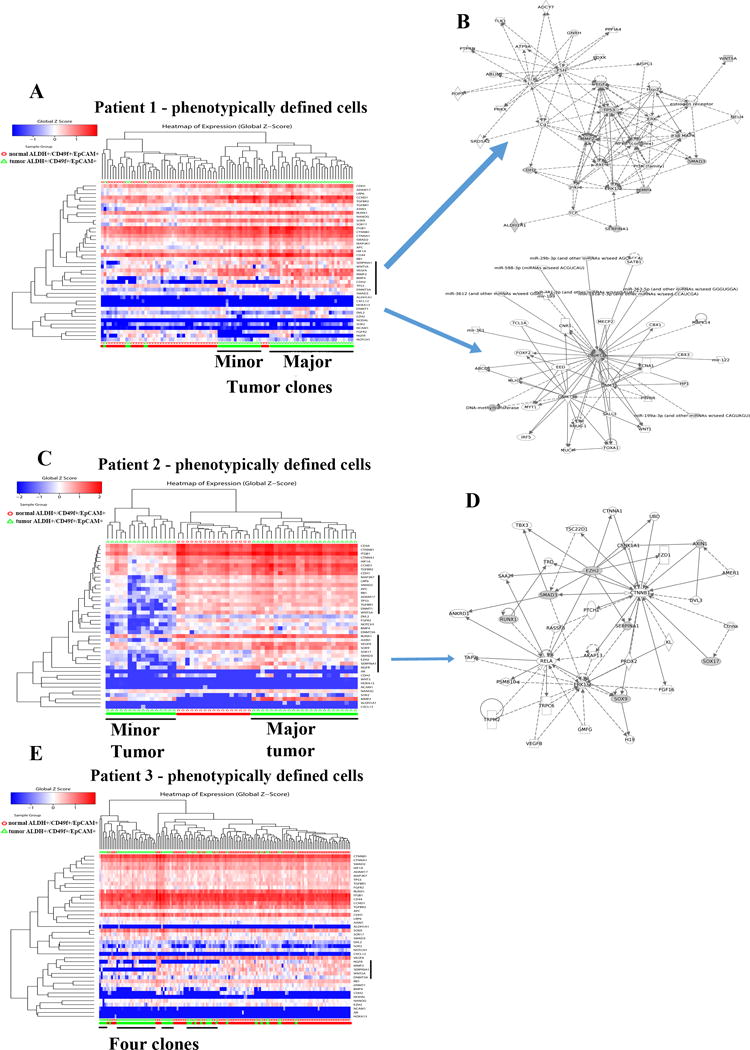
Distinct clustering of ALDH+/CD49f+/EpCAM+ undifferentiated normal and tumor luminal progenitor cells. A) Heatmap depicting expression pattern of stemness-associated genes in phenotypically defined cells of tumor and adjacent normal of patient 1. B) Genes differentially expressed in tumor cells compared to normal cells were part of two signaling networks. C) Heatmap depicting expression patterns of stemness-associated genes in normal and tumor cells of patient 2. Tumors clustered into two distinct groups. D) Signaling network involving β-Catenin-SOX9-SOX17 was active in the major tumor clone. E). Heatmap depicting stemness-associated gene expression in patient 3.
PAM50 gene set analyses provided additional insights. Keratin 14 and keratin 5 expression pattern in these phenotypically defined cells was similar to previously reported expression pattern in freshly prepared un-cultured CD49f+/EpCAM+ cells (16) suggesting limited introduction of culturing artifacts in gene expression analyses. In patient 1, while normal cells grouped into one cluster demonstrating basal/luminal hybrid gene expression pattern, tumor cells subgrouped into three clusters (Figure 6A). One major cluster is most likely luminal B subtype as it expressed mostly luminal genes. Two other minor clusters were enriched for basal or basal/luminal hybrid gene expression pattern. Tumor samples of patient 2 also formed two distinct clusters; one expressing mostly luminal genes, while the other expressing both luminal and basal genes (Figure 6B). Tumor cells in patient 3 are mostly homogenous expressing predominantly luminal genes and few basal genes (Figure 6C). However, normal cells in this case clustered into two clusters; one leaning towards luminal and the other being luminal/basal hybrid. Note that basal/luminal hybrid gene expression pattern is not unique to cultured cells and is observed in primary tumor samples (33).
Figure 6.
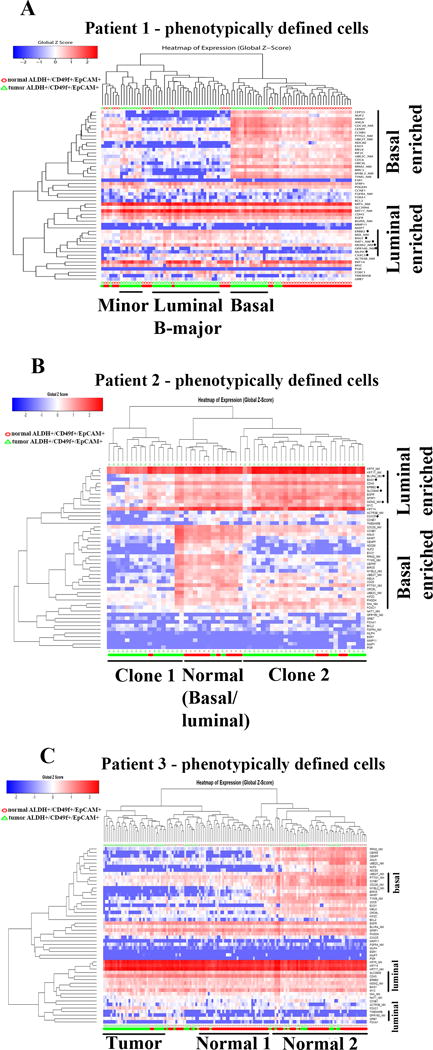
PAM50 gene set analyses of phenotypically defined cells identify multiple tumor clones. A) Tumor cells in patient 1 clustered into three distinct groups, each expressing different levels of luminal and basal genes. B) Expression pattern of PAM50 genes in patient 2. Tumor cells formed two clusters. C) Tumor cells in patient 3 are relatively homogenous with tumor cells clustering into one group expressing mostly luminal genes.
Clustering analysis of combined unselected and phenotypically defined cell population
It is often difficult to distinguish tumor cells from normal cells that may be embedded in the tumor and such cross contamination could impact data interpretation in single cell RNA analysis. To address this issue, we performed unsupervised clustering of all cells from a patient sample. In the PAM50 analyses of cells from patient 1, the majority of tumor cells separated into two large clusters with very few tumor cells interspersed within two clusters of normal cells (Figure S2). In stemness gene set analysis, normal cells formed two distinct clusters with very few interspersed tumor cells, whereas tumor cells formed one large cluster (Figure S3). Results are similar with cells from patient 2. With PAM50 gene set, normal cells formed one cluster expressing both basal and luminal genes, whereas tumor cells formed one major cluster and one minor clusters with both clusters expressing mostly luminal genes compared to normal cells (Figure S4). With stemness gene set, normal cells formed one large cluster expressing both luminal and basal genes, whereas tumor cells formed two distinct clusters (Figure S5). As with patient 1, there were very few normal cells clustered within the tumor cell cluster suggesting minimum normal cell contamination within the tumor. Overall, results presented clearly show the ability of the assay presented in this study to document heterogeneity within primary tumor at single cell level. In addition, this clustering analysis further documents heterogeneity in gene expression in both normal and tumor cells.
Gene expression differences between tumor and normal: cell-type-origin of tumor versus transformation-induced
It has often been difficult to determine whether the observed gene expression pattern in a tumor is reflection of cancer-specific gene aberration or cell-type-origin of tumor. Towards this end, we organized results of qRT-PCR into violin plots, which show dynamic range of expression in cells and depict heterogeneity in expression. With phenotypically defined population of cells, tumor-specific overexpression of MMP2, CCND1, BAG1 and CTNNA1 was clearly evident in patient 1 (Figure 7A). Analyses of data from unselected cells demonstrated a wide range of heterogeneity in expression patterns in both tumor and adjacent normal cells and the number of genes that could be considered differentially expressed between tumor and normal cells dropped significantly (Figure 7B). For example, although overall expression of NGFR appeared to be lower in tumor cells compared to adjacent normal cells, tumor contained two populations of cells, one with NGFR levels similar to adjacent normal cells and the other population expressing lower levels of NGFR. CDH2 expression appears to be elevated in only a fraction of tumor cells as evident from both phenotypically defined and unselected cell analyses. Data from patient 2 (Figure 7C and D) also revealed the ability of single cell analyses to identify genes that are truly differentially expressed in tumors. MMP2 was only gene that showed overexpression in both tumors compared to normal irrespective of cell types used for comparison. We confirmed overexpression of MMP2 in tumors by immunohistochemistry of tumor and adjacent normal tissues (Figure S6). Overall, the single cell gene expression studies presented in this study enabled identification of major and minor subclones of tumor cells as well as genes truly differentially expressed in tumor compared to normal cells.
Figure 7.
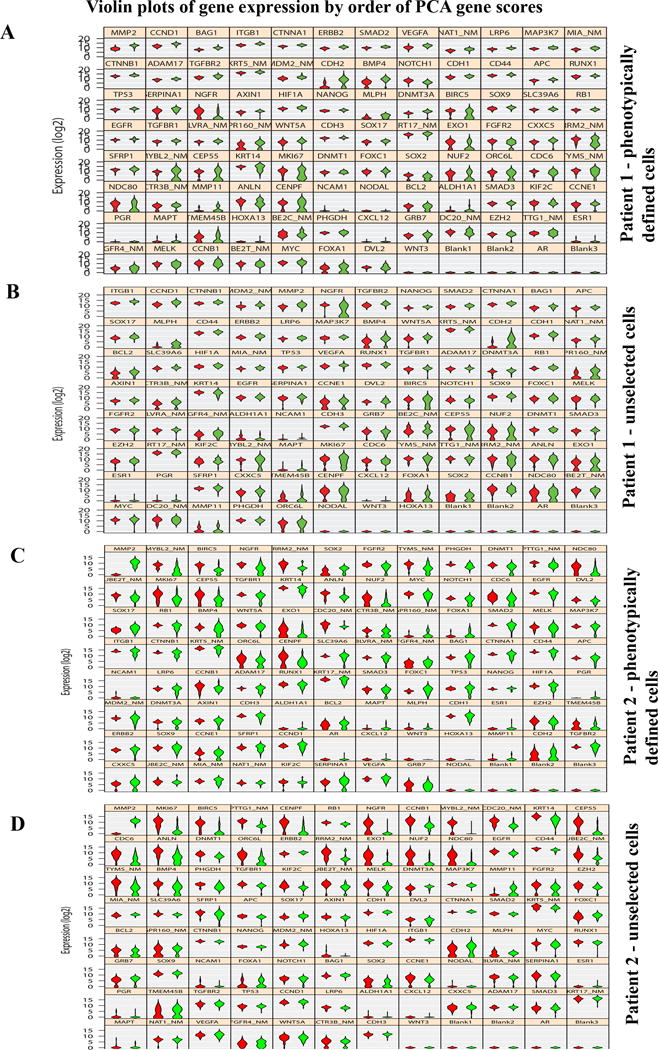
Identifying genes truly differentially expressed in tumors compared to normal. Violin plots show genes truly overexpressed or underexpressed in all tumor cells compared to all normal cells. Width of the violin depicts expression frequency at that level. A) Data from phenotypically defined cells of patient 1. B) Data from unselected cells of patient 1. C) Data from phenotypically defined cells of patient 2. D) Data from unselected cells of patient 2.
Discussion
In this study, we used single cell gene expression analyses to further refine methods that can be used to decipher tumor heterogeneity at individual patient level, to identify minor tumor clones as well as to distinguish genes truly differentially expressed in tumor from genes whose expression pattern in tumor suggests cellular precursor of tumor. Although several previously used techniques of culturing normal and tumor cells from the breast are often biased towards outgrowth of cells with basal cell characteristics, single cell analyses clearly showed that the method used in our study enabled growth of both normal and tumor cells with luminal gene expression pattern. Therefore, we believe that any artifacts introduced due to culturing are minimum and is the same for both normal and tumor cells. Also note that there is no contamination of other cell types because all cells selected for the analyses expressed keratins, ERBB2 and EGFR at variable levels. As multiple studies including the recently published results of Human Functional Genome Project clearly show enormous functional variation in human genome that impacts host-environment interaction at individual levels (8,9,25,34), it is critical to develop assays that compare tumor with normal from the same patient. Data presented here demonstrate feasibility of comparing tumor and normal at individual level.
Ideally, the studies reported here need to be conducted with cells from fresh tissues with limited in vitro manipulation. Our attempts to conduct such analyses were unsuccessful due to limited number of epithelial cells from fresh tissues. Such studies are feasible only when large tumors are available and larger tumors often tend to have significant number of necrotic areas. Adjacent normal tissue also tends to have higher levels of fibroblasts and adipocytes and yield very few epithelial cells. Therefore, our analyses required enrichment of epithelial cells through short-term cultures. Since data were obtained from cultured cells, the effect of tumor microenvironment on tumor cell gene expression was not taken into consideration. Nonetheless, cell-intrinsic gene expression differences alone were sufficient to distinguish tumor from adjacent normal.
Precision therapeutics programs at multiple institutions rely mostly on testing gene aberrations at DNA levels to identify cancer-specific signaling networks (35). These assays are reliable in characterizing tumors compared to assays that utilize mRNA-based tumor characterization although recent studies have revealed limitations even with mutation-based assays because selected tumor tissue for DNA analysis may not be representative of entire tumor (36). mRNA-based cancer classification suffers from several limitations including lack of appropriate normal controls, inter-individual heterogeneity in normal cell gene expression, differences in differentiation state between normal and tumors affecting gene expression, and the effect of stroma on gene expression in tumor cells. Greater than 2000 genes are differentially expressed between luminal/progenitor and mature cells of the breast and we have previously demonstrated inter-individual variability in differentiation state of normal breast epithelial cells (14,19). Comparative analyses of phenotypically defined cells versus unselected cells described in this study clearly showed the need to refine cancer-specific pathway discovery by excluding confounding factors such as differences in differentiation state between normal and tumor cells and to use normal tissue from the same individual for comparison. Stemness-related signaling networks that appear to be active in tumor cells differed based on types of cells used for comparison. Lack of consideration to these aspects may be responsible for limited reproducibility of mRNA-based gene expression signatures and even randomly selected gene sets demonstrating prognostic values in breast cancer (37).
It has been technically challenging to differentiate genes that are truly differentially expressed in tumor compared to normal from genes whose expression pattern in tumor suggests cellular precursors of tumor. This knowledge is critical if the focus is to develop therapies based on differentially expressed genes. Data presented in Figure 7 clearly indicate the power of the analyses presented to identify truly differentially expressed genes in tumors. Number of genes differentially expressed in tumor compared to normal is much higher in patient 1 compared to patient 2. Further studies with additional samples are needed to link results of this type of studies with clinical parameters.
We were able to detect minor clones of tumor cells using the assay system. Although bioinformatics approaches have allowed dissection of genome and RNA sequencing data to build tumor evolutionary maps and detect minor tumor clones, functional evaluation of these minor clones for tumor recurrence or therapy resistance has not been possible. With cryopreserved tumor and normal cells from the same patients, the assay presented here provides an opportunity to test various drugs for their tumor cell-specific affects and residual cells after treatment can then be subjected to single cell genomic studies to identify cancer cell types that are de novo resistant to treatment.
Supplementary Material
Acknowledgments
We thank Mr. Luke Stewart of Fluidigm for the analyses of samples from patient 4. We also thank IU Simon Cancer Center Flow cytometry, Immunohistochemistry and Tissue Procurement Cores for their help.
Financial Support: Susan G. Komen for the Cure SAC110025 and Indiana Clinical Translational Sciences core pilot grant to H. Nakshatri. Walther Cancer Foundation provided support for the Bioinformatics core.
Footnotes
Conflict of Interest: Authors declare no potential conflicts of interest
References
- 1.Paik S, Shak S, Tang G, Kim C, Baker J, Cronin M, et al. A multigene assay to predict recurrence of tamoxifen-treated, node-negative breast cancer. N Engl J Med. 2004;351(27):2817–26. doi: 10.1056/NEJMoa041588. [DOI] [PubMed] [Google Scholar]
- 2.Prat A, Bianchini G, Thomas M, Belousov A, Cheang MC, Koehler A, et al. Research-based PAM50 subtype predictor identifies higher responses and improved survival outcomes in HER2-positive breast cancer in the NOAH study. Clin Cancer Res. 2014;20(2):511–21. doi: 10.1158/1078-0432.CCR-13-0239. [DOI] [PubMed] [Google Scholar]
- 3.van ’t Veer LJ, Dai H, van de Vijver MJ, He YD, Hart AA, Mao M, et al. Gene expression profiling predicts clinical outcome of breast cancer. Nature. 2002;415(6871):530–6. doi: 10.1038/415530a. [DOI] [PubMed] [Google Scholar]
- 4.Drukker CA, Elias SG, Nijenhuis MV, Wesseling J, Bartelink H, Elkhuizen P, et al. Gene expression profiling to predict the risk of locoregional recurrence in breast cancer: a pooled analysis. Breast Cancer Res Treat. 2014;148(3):599–613. doi: 10.1007/s10549-014-3188-z. [DOI] [PubMed] [Google Scholar]
- 5.Cardoso F, van’t Veer LJ, Bogaerts J, Slaets L, Viale G, Delaloge S, et al. 70-Gene Signature as an Aid to Treatment Decisions in Early-Stage Breast Cancer. N Engl J Med. 2016;375(8):717–29. doi: 10.1056/NEJMoa1602253. [DOI] [PubMed] [Google Scholar]
- 6.Nielsen TO, Parker JS, Leung S, Voduc D, Ebbert M, Vickery T, et al. A comparison of PAM50 intrinsic subtyping with immunohistochemistry and clinical prognostic factors in tamoxifen-treated estrogen receptor-positive breast cancer. Clin Cancer Res. 2010;16(21):5222–32. doi: 10.1158/1078-0432.CCR-10-1282. [DOI] [PMC free article] [PubMed] [Google Scholar]
- 7.Martin M, Brase JC, Ruiz A, Prat A, Kronenwett R, Calvo L, et al. Prognostic ability of EndoPredict compared to research-based versions of the PAM50 risk of recurrence (ROR) scores in node-positive, estrogen receptor-positive, and HER2-negative breast cancer. A GEICAM/9906 sub-study. Breast Cancer Res Treat. 2016;156(1):81–9. doi: 10.1007/s10549-016-3725-z. [DOI] [PMC free article] [PubMed] [Google Scholar]
- 8.Wagner JR, Busche S, Ge B, Kwan T, Pastinen T, Blanchette M. The relationship between DNA methylation, genetic and expression inter-individual variation in untransformed human fibroblasts. Genome Biol. 2014;15(2):R37. doi: 10.1186/gb-2014-15-2-r37. [DOI] [PMC free article] [PubMed] [Google Scholar]
- 9.Lappalainen T, Sammeth M, Friedlander MR, t Hoen PA, Monlong J, Rivas MA, et al. Transcriptome and genome sequencing uncovers functional variation in humans. Nature. 2013;501(7468):506–11. doi: 10.1038/nature12531. [DOI] [PMC free article] [PubMed] [Google Scholar]
- 10.Liu X, Ory V, Chapman S, Yuan H, Albanese C, Kallakury B, et al. ROCK inhibitor and feeder cells induce the conditional reprogramming of epithelial cells. Am J Pathol. 2012;180(2):599–607. doi: 10.1016/j.ajpath.2011.10.036. [DOI] [PMC free article] [PubMed] [Google Scholar]
- 11.Gawad C, Koh W, Quake SR. Single-cell genome sequencing: current state of the science. Nat Rev Genet. 2016;17(3):175–88. doi: 10.1038/nrg.2015.16. [DOI] [PubMed] [Google Scholar]
- 12.Garbe JC, Bhattacharya S, Merchant B, Bassett E, Swisshelm K, Feiler HS, et al. Molecular distinctions between stasis and telomere attrition senescence barriers shown by long-term culture of normal human mammary epithelial cells. Cancer Res. 2009;69(19):7557–68. doi: 10.1158/0008-5472.CAN-09-0270. [DOI] [PMC free article] [PubMed] [Google Scholar]
- 13.Ince TA, Richardson AL, Bell GW, Saitoh M, Godar S, Karnoub AE, et al. Transformation of different human breast epithelial cell types leads to distinct tumor phenotypes. Cancer Cell. 2007;12(2):160–70. doi: 10.1016/j.ccr.2007.06.013. [DOI] [PubMed] [Google Scholar]
- 14.Nakshatri H, Anjanappa M, Bhat-Nakshatri P. Ethnicity-Dependent and -Independent Heterogeneity in Healthy Normal Breast Hierarchy Impacts Tumor Characterization. Scientific reports. 2015;5:13526. doi: 10.1038/srep13526. [DOI] [PMC free article] [PubMed] [Google Scholar]
- 15.Proia TA, Keller PJ, Gupta PB, Klebba I, Jones AD, Sedic M, et al. Genetic predisposition directs breast cancer phenotype by dictating progenitor cell fate. Cell Stem Cell. 2011;8(2):149–63. doi: 10.1016/j.stem.2010.12.007. [DOI] [PMC free article] [PubMed] [Google Scholar]
- 16.Lim E, Vaillant F, Wu D, Forrest NC, Pal B, Hart AH, et al. Aberrant luminal progenitors as the candidate target population for basal tumor development in BRCA1 mutation carriers. Nat Med. 2009;15(8):907–13. doi: 10.1038/nm.2000. [DOI] [PubMed] [Google Scholar]
- 17.Pfefferle AD, Spike BT, Wahl GM, Perou CM. Luminal progenitor and fetal mammary stem cell expression features predict breast tumor response to neoadjuvant chemotherapy. Breast Cancer Res Treat. 2015;149(2):425–37. doi: 10.1007/s10549-014-3262-6. [DOI] [PMC free article] [PubMed] [Google Scholar]
- 18.Keller PJ, Arendt LM, Skibinski A, Logvinenko T, Klebba I, Dong S, et al. Defining the cellular precursors to human breast cancer. Proc Natl Acad Sci U S A. 2012;109(8):2772–7. doi: 10.1073/pnas.1017626108. [DOI] [PMC free article] [PubMed] [Google Scholar]
- 19.Raouf A, Zhao Y, To K, Stingl J, Delaney A, Barbara M, et al. Transcriptome analysis of the normal human mammary cell commitment and differentiation process. Cell Stem Cell. 2008;3(1):109–18. doi: 10.1016/j.stem.2008.05.018. [DOI] [PubMed] [Google Scholar]
- 20.Shehata M, Teschendorff A, Sharp G, Novcic N, Russell IA, Avril S, et al. Phenotypic and functional characterisation of the luminal cell hierarchy of the mammary gland. Breast Cancer Res. 2012;14(5):R134. doi: 10.1186/bcr3334. [DOI] [PMC free article] [PubMed] [Google Scholar]
- 21.Perkins SM, Bales C, Vladislav T, Althouse S, Miller KD, Sandusky G, et al. TFAP2C expression in breast cancer: correlation with overall survival beyond 10 years of initial diagnosis. Breast Cancer Res Treat. 2015;152(3):519–31. doi: 10.1007/s10549-015-3492-2. [DOI] [PubMed] [Google Scholar]
- 22.Navin NE. Delineating cancer evolution with single-cell sequencing. Science translational medicine. 2015;7(296):296fs29. doi: 10.1126/scitranslmed.aac8319. [DOI] [PMC free article] [PubMed] [Google Scholar]
- 23.Guo G, Luc S, Marco E, Lin TW, Peng C, Kerenyi MA, et al. Mapping cellular hierarchy by single-cell analysis of the cell surface repertoire. Cell Stem Cell. 2013;13(4):492–505. doi: 10.1016/j.stem.2013.07.017. [DOI] [PMC free article] [PubMed] [Google Scholar]
- 24.Eirew P, Steif A, Khattra J, Ha G, Yap D, Farahani H, et al. Dynamics of genomic clones in breast cancer patient xenografts at single-cell resolution. Nature. 2014 doi: 10.1038/nature13952. [DOI] [PMC free article] [PubMed] [Google Scholar]
- 25.Li Y, Oosting M, Smeekens SP, Jaeger M, Aguirre-Gamboa R, Le KT, et al. A Functional Genomics Approach to Understand Variation in Cytokine Production in Humans. Cell. 2016;167(4):1099–110e14. doi: 10.1016/j.cell.2016.10.017. [DOI] [PubMed] [Google Scholar]
- 26.Lim E, Wu D, Pal B, Bouras T, Asselin-Labat ML, Vaillant F, et al. Transcriptome analyses of mouse and human mammary cell subpopulations reveal multiple conserved genes and pathways. Breast Cancer Res. 2010;12(2):R21. doi: 10.1186/bcr2560. [DOI] [PMC free article] [PubMed] [Google Scholar]
- 27.Visvader JE, Stingl J. Mammary stem cells and the differentiation hierarchy: current status and perspectives. Genes Dev. 2014;28(11):1143–58. doi: 10.1101/gad.242511.114. [DOI] [PMC free article] [PubMed] [Google Scholar]
- 28.Ginestier C, Hur MH, Charafe-Jauffret E, Monville F, Dutcher J, Brown M, et al. ALDH1 Is a Marker of Normal and Malignant Human Mammary Stem Cells and a Predictor of Poor Clinical Outcome. Cell Stem Cell. 2007;1(5):555–67. doi: 10.1016/j.stem.2007.08.014. [DOI] [PMC free article] [PubMed] [Google Scholar]
- 29.Irie N, Weinberger L, Tang WW, Kobayashi T, Viukov S, Manor YS, et al. SOX17 is a critical specifier of human primordial germ cell fate. Cell. 2015;160(1–2):253–68. doi: 10.1016/j.cell.2014.12.013. [DOI] [PMC free article] [PubMed] [Google Scholar]
- 30.Guo W, Keckesova Z, Donaher JL, Shibue T, Tischler V, Reinhardt F, et al. Slug and Sox9 cooperatively determine the mammary stem cell state. Cell. 2012;148(5):1015–28. doi: 10.1016/j.cell.2012.02.008. [DOI] [PMC free article] [PubMed] [Google Scholar]
- 31.Boras-Granic K, Wysolmerski JJ. Wnt signaling in breast organogenesis. Organogenesis. 2008;4(2):116–22. doi: 10.4161/org.4.2.5858. [DOI] [PMC free article] [PubMed] [Google Scholar]
- 32.Bastien RR, Rodriguez-Lescure A, Ebbert MT, Prat A, Munarriz B, Rowe L, et al. PAM50 breast cancer subtyping by RT-qPCR and concordance with standard clinical molecular markers. BMC medical genomics. 2012;5:44. doi: 10.1186/1755-8794-5-44. [DOI] [PMC free article] [PubMed] [Google Scholar]
- 33.Grosse-Wilde A, Fouquier d’Herouel A, McIntosh E, Ertaylan G, Skupin A, Kuestner RE, et al. Stemness of the hybrid Epithelial/Mesenchymal State in Breast Cancer and Its Association with Poor Survival. PloS one. 2015;10(5):e0126522. doi: 10.1371/journal.pone.0126522. [DOI] [PMC free article] [PubMed] [Google Scholar]
- 34.Ter Horst R, Jaeger M, Smeekens SP, Oosting M, Swertz MA, Li Y, et al. Host and Environmental Factors Influencing Individual Human Cytokine Responses. Cell. 2016;167(4):1111–24e13. doi: 10.1016/j.cell.2016.10.018. [DOI] [PMC free article] [PubMed] [Google Scholar]
- 35.Wheler JJ, Atkins JT, Janku F, Moulder SL, Yelensky R, Stephens PJ, et al. Multiple gene aberrations and breast cancer: lessons from super-responders. BMC cancer. 2015;15:442. doi: 10.1186/s12885-015-1439-y. [DOI] [PMC free article] [PubMed] [Google Scholar]
- 36.Miller CA, Gindin Y, Lu C, Griffith OL, Griffith M, Shen D, et al. Aromatase inhibition remodels the clonal architecture of estrogen-receptor-positive breast cancers. Nature communications. 2016;7:12498. doi: 10.1038/ncomms12498. [DOI] [PMC free article] [PubMed] [Google Scholar]
- 37.Venet D, Dumont JE, Detours V. Most random gene expression signatures are significantly associated with breast cancer outcome. PLoS Comput Biol. 2011;7(10):e1002240. doi: 10.1371/journal.pcbi.1002240. [DOI] [PMC free article] [PubMed] [Google Scholar]
Associated Data
This section collects any data citations, data availability statements, or supplementary materials included in this article.


