

Abstract
There is growing evidence that stress-coping mechanisms represent tumor cell vulnerabilities that may function as therapeutically beneficial targets. Recent work has delineated an integrated stress adaptation mechanism that is characterized by the formation of cytoplasmic mRNA/protein foci termed stress granules (SGs). Here, we demonstrate that SGs are markedly elevated in mutant KRAS cells following exposure to stress-inducing stimuli. The upregulation of SGs by mutant KRAS is dependent on the production of the signaling lipid molecule 15-deoxy-delta 12,14 prostaglandin J2 (15-d-PGJ2) and confers cytoprotection against stress stimuli and chemotherapeutic agents. The secretion of 15-d-PGJ2 by mutant KRAS cells is sufficient to enhance SG formation and stress resistance in cancer cells that are wild-type for KRAS. Our findings identify a mutant KRAS-dependent cell non-autonomous mechanism that may afford the establishment of a stress-resistant niche that encompasses different tumor sub-clones. These results should inform the design of strategies to eradicate tumor cell communities.
Keywords: cancer, KRAS, stress granules, prostaglandins
INTRODUCTION
The acquisition of a gain of function mutation in the KRAS gene is a driver of malignant transformation in a wide number of tissues (Stephen et al., 2014). As collateral damage to the emergence of such mutations is an increase in the exposure of mutant KRAS cells to stress-inducing conditions (e.g. genotoxic, proteotoxic, metabolic stress) due to the loss of normal proliferative barriers and the disruption of tissue homeostasis (Downward, 2015; Luo et al., 2009b). Thus, the successful expansion of KRAS tumors is dependent on the engagement of stress adaptive mechanisms that enable cells to grow and survive under adverse conditions (Solimini et al., 2007). These stress adaptive mechanisms are also largely responsible for the notorious drug resistance of KRAS cancers to chemotherapeutic agents (Eberhard et al., 2005; Grana et al., 2002; Rosell et al., 1995; Wang et al., 2011). By extension, understanding the molecular mechanisms through which mutant KRAS confers stress resistance has the potential to inform the development of new targeting strategies that may have significant therapeutic implications.
Stress granules (SGs) are characterized as non-membranous cytosolic structures consisting of mRNA and protein that form upon cellular exposure to a variety of stress stimuli including oxidative, nutritional, genotoxic, proteotoxic, and osmotic stress, UV-irradiation, and chemotherapeutic agents, and are required for cells to cope with stress (Kedersha et al., 2013). The current view holds that SG assembly occurs downstream of stress-induced translational arrest with the pool of stalled mRNAs serving as the scaffold for the recruitment of RNA-binding proteins which in turn recruit a plethora of signaling molecules (Anderson et al., 2015; Buchan and Parker, 2009; Kedersha et al., 2013). As such, SGs are thought to operate as platforms for signal compartmentalization and regulation of pathway activity. In support of this idea, the recruitment of TORC1 and dual specificity tyrosine phosphorylation-regulated kinase (DYRK) 3 to SGs has been shown to regulate the timing of TORC1 inactivation/reactivation in stressed cells (Wippich et al., 2013). In addition, it has been demonstrated that association of RACK1 with SGs leads to the inhibition of stress-induced activation of p38/JNK signaling, thereby compromising p38/JNK-mediated apoptosis (Arimoto et al., 2008).
While the critical role of SGs in the cellular stress response is well established, their contribution to tumor cell fitness is less understood. Here we demonstrate that SG formation is elevated in mutant KRAS cells in response to a variety of stress stimuli. The upregulation of SGs is mediated by mutant KRAS-dependent pathways that control prostaglandin metabolism and confers cytoprotection by cell autonomous and cell non-autonomous mechanisms. Intercepting these pathways leads to the sensitization of mutant KRAS cells to stress stimuli and chemotherapeutic agents. Our results define a previously unappreciated paracrine mechanism exploited by mutant KRAS tumors to counteract stress. This mechanism could serve to establish a stress-resistant environment consisting of cells with diverse genetic and lineage backgrounds, and as such, may dictate responsiveness to therapeutic intervention.
RESULTS
SG formation in response to stress exposure is upregulated in mutant KRAS cells
To monitor SG formation, we have used a well-documented assay in which the cellular distribution of SG resident proteins is assessed by immunofluorescence (Kedersha and Anderson, 2007). As illustrated in Fig. 1A, exposure of mutant KRAS colorectal cancer cells DLD1 (hereafter referred to as DLD1 Mut) to oxidative stress via treatment with sodium arsenate (SA) was associated with the induction of SGs as indicated by the accumulation of cytoplasmic puncta containing two well established SG markers, endogenous endoribonuclease RAS GTPase-activating protein-binding protein 1 (G3BP) and endogenous eukaryotic initiation factor 4G (eIF4G) (Kedersha and Anderson, 2007). To establish a quantitative readout for SG formation, we have applied the Image J analyze-particle tool to calculate the fraction of total area of SGs in the total cell area visualized. Using this approach, we compared the induction of SGs in response to oxidative stress across a panel of human pancreatic and colorectal adenocarcinoma cell lines (Figure 1B). This analysis revealed that the levels of SGs displayed by mutant KRAS negative (KRAS WT) cancer cells, including cancer cells that harbor oncogenic mutations in BRAF (HT-29) or BRAF/PI3K (NCI H747) was significantly lower compared to cancer cells that harbor KRAS mutations (KRAS Mut). Together, these observations suggest that mutant KRAS may play a regulatory role in SG formation.
Figure 1. Upregulation of SGs in mutant KRAS cells.
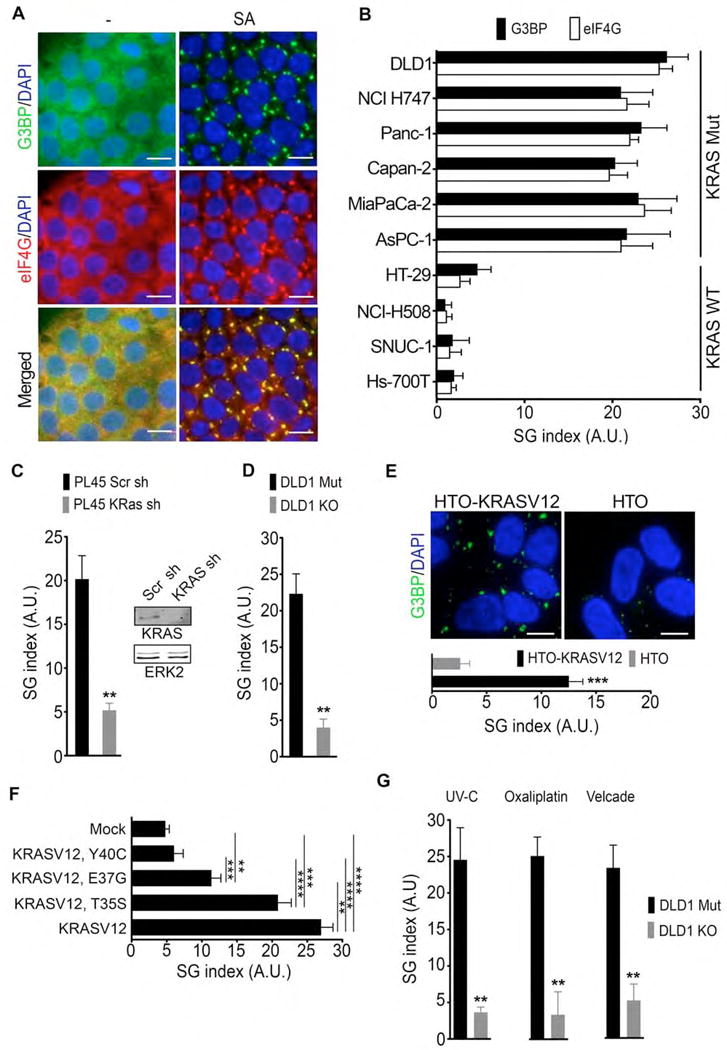
(A) DLD1 Mut cells were treated with sodium arsenate (SA, 100 μM) for 1hr. SGs were detected by G3BP and eIF4G immunofluorescence staining. Scale bar, 10 μm.
(B) Colon (DLD1, NCI H747, HT29, NCI H508, SNUC1) and pancreatic (Panc-1, Capan-2, MiaPaCa 2, AsPC-1, HS 700T) cancer cells were treated as in (A). SGs were quantified by defining a SG index (SG area/cell area) based on G3BP and eIF4G immunofluorescence. Data are presented as arbitrary units (A.U.) Error bars indicate mean −/+ SEM for at least 3 independent experiments in which 4 fields of view with at least 50 cells/field of view/cell line were quantified.
(C) PL45 cells expressing inducible scramble (Scr) or KRAS shRNA were treated with SA as in A. SG index based on G3BP immunofluorescence is shown. Inset-Whole cell lysates (WCL) expressing inducible scramble (Scr) or KRAS shRNA were subjected to immunoblotting with the indicated antibodies. ERK2 serves as a loading control.
(D) DLD1 Mut and DLD1 KO cells were treated with SA as in A. SG index based on G3BP immunofluorescence is shown.
(E) Hela Tet-ON cells (HTO) and HTO cells that conditionally express mutant KRAS (HTO-KRASV12) were treated with SA (100 μM, 1hr). SGs were visualized by G3BP immunofluorescence staining (top). SG index based on G3BP immunofluorescence is shown (bottom).
(F) Hela cells expressing mCherry-KRASV12, mCherry-KRASV12T35S, mCherry-KRASV12E37G, mCherry-KRASV12Y40C were treated with SA (100 μM, 1hr). SG index based on G3BP immunofluorescence is shown.
(G) DLD1 Mut and DLD1 KO cells were treated with UV-C irradiation (50 mJ/m2, 24hr), oxaliplatin (200 μM, 6 hr), or velcade (1 μM, 8hr). SG index based on G3BP immunofluorescence is shown.
(C–G) Data are from a representative experiment out of least 3 independent experiments. For all graphs, error bars indicate mean −/+ SEM for at least 4 fields of view with at least 50 cells/field of view. **p<0.05, ***p<0.005, ****p<0.005. Scale bar, 10 μm.
Mutant KRAS is necessary and sufficient for SG upregulation
To determine whether mutant KRAS is a causative factor leading to elevated SG levels, we assessed SG formation under experimental conditions where mutant KRAS expression was conditionally suppressed or switched on. Inducible shRNA-directed knockdown of KRAS in the KRAS mutant pancreatic cancer cell lines PL45, Panc-1, MiaPaCa-2, and AsPC-1 resulted in a significant attenuation of SG formation in response to oxidative stress (Figure 1C and Supplemental Figure 1A). In addition, SG formation was reduced by approximately 5-fold in an isogenic derivative of DLD1 Mut cells where the mutant KRAS allele has been knocked out (DLD1 KO) (Shirasawa et al., 1993), (Figure 1D and Supplemental Figure 1B). Conversely, inducible expression of mutant KRAS (KRASV12) in HeLa Tet-ON KRASV12 cells led to an approximate 5-fold elevation in SG levels following exposure to oxidative stress (Figure 1E). Upregulation of SGs by mutant KRAS was reflected in significantly larger average size and number of SGs/cell (Supplemental Figure 1C). Together, these observations indicate that mutant KRAS is necessary and sufficient for SG upregulation under oxidative stress conditions. Moreover, expression of mutant HRAS (HRASV12) also enhanced SG levels indicating that acquisition of an activating mutation in other RAS isoforms also confers SG upregulation (not shown).
To define the molecular pathways through which mutant KRAS upregulates SGs we investigated three key Ras-effector pathways: KRAS/RAF, KRAS/RALGEF, and KRAS/PI3K. To do so, we utilized the RAS effector domain mutants KRASV12,T35S, KRASV12,E37G, or KRASV12,Y40C, which preferentially activate the RAF, RALGEF, or PI3K pathway, respectively. Hela cells transiently expressing KRASV12,T35S upregulated SGs ~ 5 fold over mock transfected cells, similar to KRASV12 expressing cells (Figure 1F). In contrast, Hela cells expressing KRASV12,Y40C showed no upregulation whereas expression of KRAS,V12E37G led to a modest upregulation (~2 fold) (Figure 1F). These results implicate the RAF pathway as a major mediator for KRAS-induced SG upregulation. Consistent with this, treatment with the MEK inhibitor PD0325901 impaired the capacity of HeLa Tet-ON KRASV12 cells to form SGs (Supplemental Figure 1D).
In addition to oxidative stress, several other tumor-associated stresses have been shown to induce SGs (Arimoto et al., 2008; Dewey et al., 2011; Kedersha and Anderson, 2007; Moeller et al., 2004). To test whether mutant KRAS-dependent upregulation of SGs displays specificity for a particular type of stress, we subjected DLD1 Mut and DLD1 KO cells to various stress stimuli. As illustrated in Figure 1G, the presence of mutant KRAS was associated with elevated levels of SG induction in response to UV-C irradiation (~6 fold), and the chemotherapeutic agents oxaliplatin (~6 fold) and velcade (~5 fold), which induce DNA damage and proteotoxic stress, respectively. These results are consistent with a role for mutant KRAS in regulating fundamental aspects of SG formation that are common to diverse stress stimuli.
SGs are dynamic structures that form and dissipate with kinetics that can vary depending on the type of stress (Kedersha and Anderson, 2007; Kedersha et al., 2008). Time-course analysis of SG levels revealed that DLD1 Mut cells displayed more than 5-fold elevation of SG levels relative to DLD1 KO cells at the 30 min time-point following exposure to sodium arsenate, and this trend was maintained until their dissolution at the 120 min time-point (Supplemental Figure 1E). Similarly, DLD1 Mut cells showed ~ 5 fold elevated SG levels compared to DLD1 KO cells at 3 hr following UV-C irradiation, when SGs start to become apparent, and a similar trend is maintained for the 24hr time-course after which SGs dissipate (Supplemental Figure 1F and data not shown). Similar results were obtained for oxaliplatin and velcade (data not shown). Together, these results indicate that mutant KRAS promotes the rate and extent of SG formation.
Mutant KRAS tumors display elevated levels of SGs
To investigate whether the effect of mutant KRAS on SG levels observed in cell culture conditions is manifested in vivo, we evaluated SGs in the pancreata of LSL-KRasG12D/+;LSL-Trp53R172H/+;Pdx-1-Cre (KPC) mice (Hingorani et al., 2005). As shown in Figure 2A, the SG marker G3BP showed a diffuse cytoplasmic distribution in normal pancreatic tissue. In contrast, G3BP accumulated in cytoplasmic granular structures in the majority of lesions resembling early pancreatic intraepithelial neoplasia (PanINs) and in all lesions displaying a phenotype of advanced PanINs. Importantly, SGs were readily detected in tissue sections from human pancreatic adenocarcinoma as visualized by G3BP (Figure 2B) or poly A mRNA binding protein 1 (PABP1) (Supplemental Figure 2A) staining, but not in adjacent normal pancreatic tissue (Figure 2C). Furthermore, SGs were prominent in human xenograft tumors from the KRAS mutant cell lines DLD1 Mut and PL45 (Supplemental Figure 2B). In comparison, no SGs were detected in xenografts of the KRAS WT cell line BxPC3 (Supplemental Figure 2B), affirming that the upregulation of SGs in vivo is associated with the presence of mutant KRAS.
Figure 2. Mutant KRAS upregulates SGs in vivo.

(A) Serial sections from a pancreas of LSL-KRasG12D/+;LSL-Trp53R172H/+;Pdx-1-Cre (KPC) animals and control wild-type (WT) littermates were stained with hematoxylin and eosin (H&E; scale bar 40 μm) and SGs were visualized by G3BP immunofluorescence (scale bar, 10 μm; inset, 4× zoom-in of boxed region). Arrowheads and arrows indicate early and advanced PanIN lesions, respectively. Images are representative of results obtained from 3 animals/cohort.
(B) Sections from two independent human PDAC tissues were immunostained for G3BP and CK19 (epithelial marker).
(C) A section from a normal region in human PDAC immunostained for G3BP and CK19.
(B–C) Scale bar, 10 μm. Lower panels are 3× zoom-in of boxed regions.
Mutant KRAS-induced upregulation of SGs is mediated by eIF4A
We next sought to determine the mechanism through which mutant KRAS promotes SG upregulation. The main regulatory events that have been identified as essential for SG formation are: the phosphorylation of the eukaryotic initiation factor eIF2α and the inactivation of the eukaryotic initiation factor eIF4A (Kedersha et al., 2013). Both events lead to a decrease in translation initiation rates, which provides the surge in non-polysomal RNA which functions as a scaffold for SG nucleator proteins. In addition, overexpression of SG nucleating proteins can lead to SG assembly even in the absence of stress stimuli (Kedersha and Anderson, 2007). We first asked whether upregulated SG levels in DLD1 Mut versus DLD1 KO cells occurs as a consequence of increased eIF2α phosphorylation. Both DLD1 Mut and DLD1 KO cells displayed similar levels of p-eIF2α following exposure to sodium arsenate or oxaliplatin, demonstrating that elevated SG levels in DLD1 Mut cells cannot be merely attributed to higher p-eIF2α levels (Figure 3A and data not shown). Of note, neither sodium arsenate nor oxaliplatin treatment led to an increase in the phosphorylation of eIF2α over basal levels (Figure 3A and data not shown), consistent with earlier reports demonstrating that eIF2α is constitutively phosphorylated in cancer cells (Silvera et al., 2010). Furthermore, DLD1 Mut and DLD1 KO cells showed similar levels of G3BP and eIF4A (Figure 3A) ruling out the possible contribution of a preferential increase in the levels of these SG nucleators.
Figure 3. Mutant KRAS upregulates SGs by modulating the cellular capacity to biosynthesize and catabolize prostaglandins.
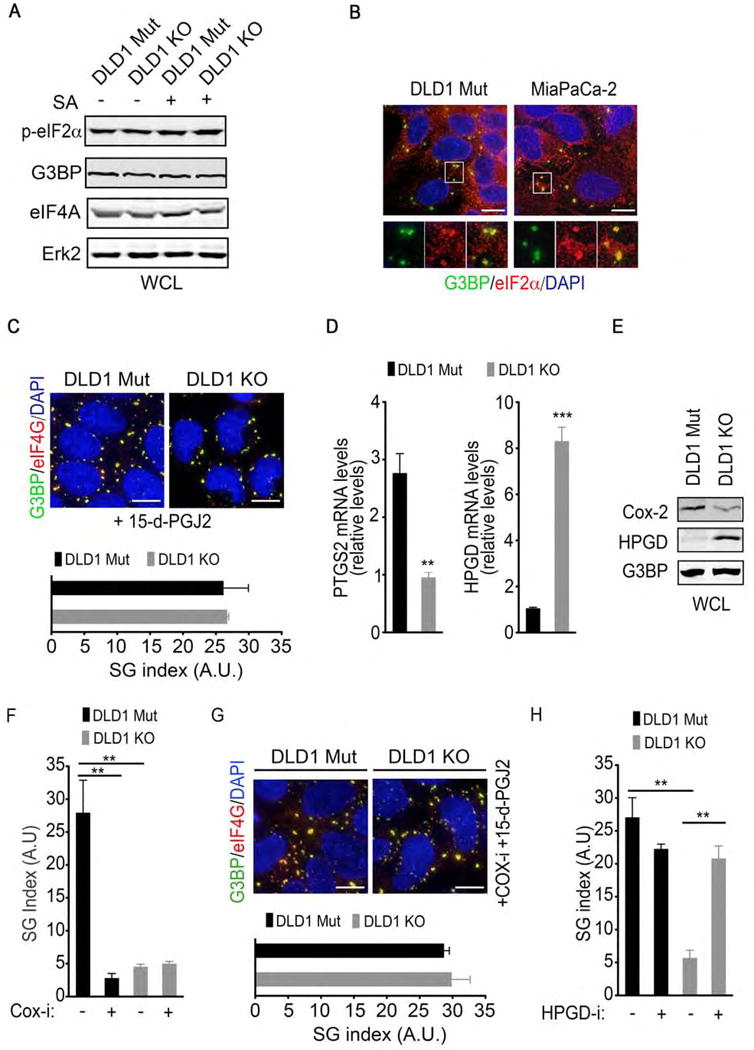
(A) DLD1 Mut and DLD1 KO cells were treated with SA (100 μM, 1hr). Whole cell lysates (WCL) were collected and subjected to immunoblotting with the indicated antibodies. ERK2 serves as a loading control.
(B) DLD1 Mut and MiaPaCa-2 cells were treated with SA as in A and SGs were detected by immunofluorescence staining for G3BP and eIF2α.
(C) DLD1 Mut and DLD1 KO cells were treated with 15-d-PGJ2 (50 μM, 1hr). SGs were detected by immunofluorescence staining for G3BP and eIF4G (top). SG index based on G3BP immunofluorescence (bottom) is shown.
(D) PTGS2 and HPGD mRNA levels in DLD1 Mut and DLD1 KO cells were assessed by quantitative RT-PCR. Error bars indicate SEM (n=3).
(E) COX-2 and HPGD protein levels in DLD1 Mut and DLD1 KO cells were assessed by immunoblotting of whole cell lysates (WCL) with the indicated antibodies. G3BP serves as a loading control.
(F) DLD1 Mut cells were treated with diclofenac sodium (20 μM, COX-i) for 12 hrs followed by SA treatment (100 μM, 1hr). SG index based on G3BP immunofluorescence is shown.
(G) DLD1 Mut and DLD1 KO cells were treated with diclofenac sodium (COX-i) as in Figure 3F and 15-d-PGJ2 as in Figure 3C. SGs were detected by immunofluorescence staining for G3BP and eIF4G (top). SG index based on G3BP immunofluorescence is shown (bottom).
(H) DLD1 Mut and DLD1 KO cells were treated with a HPGD inhibitor (HPGD-i; 40 μM) for 6 hrs followed by SA (100 μM, 1hr). SG index based on G3BP immunofluorescence is shown.
(A–C, E–H) Data are from a representative experiment out of at least 3 independent experiments.
(C, F–H) Error bars indicate mean −/+ SEM for at least 4 fields of view with at least 50 cells/field of view.
**p<0.005, ***p<0.0005. Scale bar, 10 μm.
We next examined whether mutant KRAS regulates SGs through eIF4A inactivation. A characteristic property of eIF4A-regulated SGs is the presence of eIF2α and eIF5 initiation factors, which are absent from p-eIF2α–dependent SGs (Bordeleau et al., 2005; Silvera et al., 2010). Consistent with mutant KRAS-driven SG upregulation being dependent on eIF4A inactivation but not eIF2α phosphorylation, SGs in the KRAS mutant cells DLD1 Mut and MiaPaCa2 were positive for eIF2α and eIF5 (Figure 3B and Supplemental Figure 3A). The inactivation of eIF4A and the consequential induction of SGs has been reported to occur through covalent modification of eIF4A by the bioactive lipid prostaglandins 15-deoxy-delta 12,14-prostaglandin J2 (15-d-PGJ2) and prostaglandin A1 (PGA1) (Kim et al., 2007). We reasoned that if SG upregulation by mutant KRAS is mediated by 15-d-PGJ2- dependent inactivation of eIF4A, then the treatment of cells with 15-d-PGJ2 would obviate the requirement of mutant KRAS for the upregulation of SGs. Consistent with this postulate, incubation of DLD1 KO cells with 15-d-PGJ2 was sufficient to induce the accumulation of SGs to a similar level to that observed in DLD1 Mut cells (Figure 3C and Supplemental Figure 3B). This effect was specific to 15-d-PGJ2 as the addition of another prostaglandin, prostaglandin E2 (PGE2), did not induce SGs (Supplemental Figure 3C).
Mutant KRAS enhances SG formation by regulating prostaglandin biosynthesis and catabolism
The capacity of 15-d-PGJ2 to enhance SG formation raises the possibility that in mutant KRAS cells this response might be linked to mutant KRAS-regulated changes in prostaglandin levels. The accumulation of prostaglandin in tissues is controlled by the relative rates of biosynthesis and breakdown. The rate-limiting step in prostaglandin biosynthesis is catalyzed by cyclooxygenases (COX) 1 and/or 2, whereas prostaglandin degradation is catalyzed by the NAD+–dependent 15-hydroxyprostaglandin dehydrogenase (HPGD). Suppression of mutant KRAS expression in colon and pancreatic cancer cells led to an attenuation of PTGS2 (COX-2) levels and an upregulation of HPGD (Figure 3D and 3E and Supplemental Figure 3D). These results suggest that mutant KRAS can control prostaglandin accumulation through enhancing biosynthesis and/or attenuating catabolism. In support of this idea, analysis of ONCOMINE data from tissue samples from pancreatic adenocarcinomas where KRAS mutations are highly prevalent (~90% of patients) revealed significant PTGS2 upregulation as well as HPGD downregulation compared to normal pancreatic tissue (Supplementary Figure 3E). Consistent with a regulatory role for mutant KRAS in prostaglandin accumulation, we also observed a significant enrichment of PTGS2 in lung adenocarcinoma (LUAD) tumors with KRAS mutations compared to tumors with wild-type KRAS (Supplemental Figure 3F).
To investigate the significance of mutant KRAS-mediated prostaglandin accumulation in SG upregulation, we used pharmacological inhibitors of the relevant enzymatic activities. COX-1/2 inhibition attenuated SG levels in DLD1 Mut cells subjected to sodium arsenate (Figure 3F and Supplemental Figure 3G), and this effect was reversed by the addition of 15-d-PGJ2 (Figure 3G). Furthermore, in DLD1 KO cells, pharmacological inhibition of HPGD rescued the levels of oxidative stress-induced SGs (Figure 3H and Supplemental Figure 3H). Taken together these results indicate that the increase in prostaglandin levels by upregulating prostaglandin biosynthesis and/or downregulating prostaglandin catabolism is essential for mutant KRAS-induced upregulation of SGs.
Mutant KRAS exerts cell non-autonomous control of SG levels through 15-d-PGJ2
Since 15-d-PGJ2 is a secreted molecule, in principle, it could regulate its targets in a cell autonomous and/or cell non-autonomous fashion. This raises the possibility that by regulating 15-d-PGJ2 production mutant KRAS might exert a cell non-autonomous control of SG levels. To test this idea, we initially measured by ELISA the extracellular amounts of 15-d-PGJ2 and its precursor PGD2. The levels of 15-d-PGJ2 and PGD2 detected in conditioned medium from DLD1 Mut cells (KCM) were significantly higher compared with DLD1 KO cells (Figure 4A). Furthermore, conditioned media from MiaPaCa-2 and AsPC-1 cells in which KRAS has been knocked down had significantly lower levels of 15-d-PGJ2 compared to MiaPaCa-2 and AsPC-1 shRNA control cells (Supplemental Figure 4). These results demonstrate that mutant KRAS promotes the extracellular accumulation of 15-d-PGJ2.
Figure 4. Cell non-autonomous upregulation of SGs by mutant KRAS is mediated by 15-d-PGJ2.
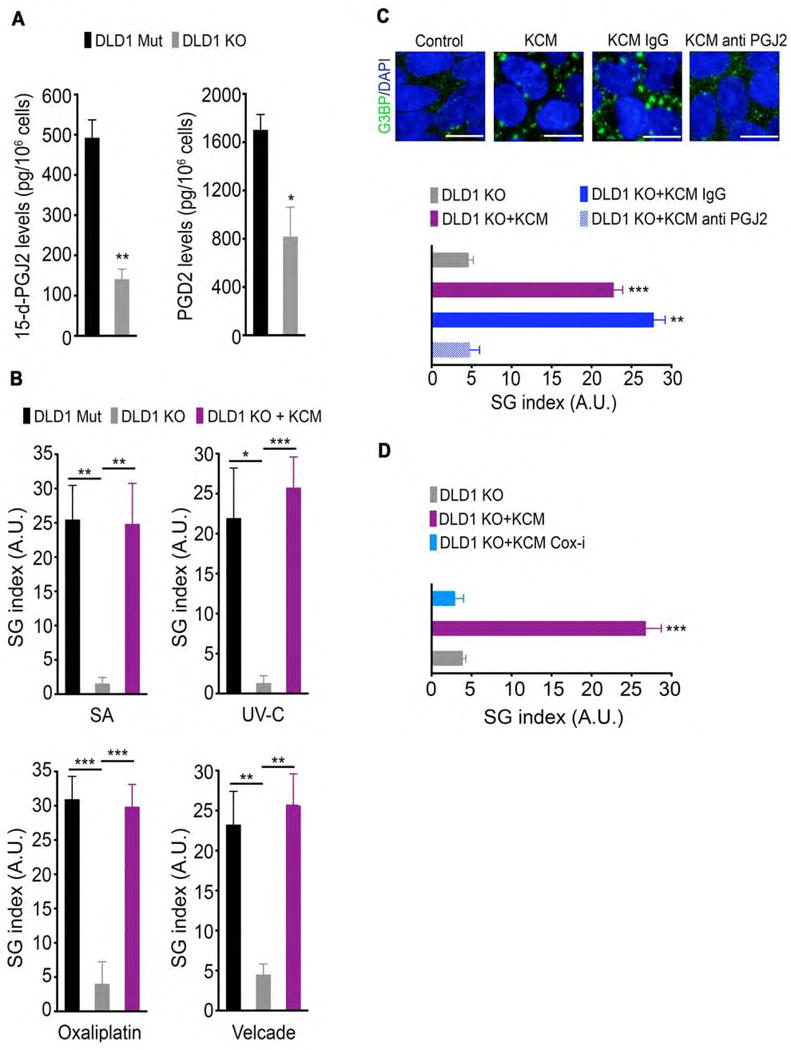
(A) The levels of 15-d-PGJ2 and PGD2 that were secreted by DLD1 Mut and DLD1 KO cells were determined by ELISA of the respective cell culture medium. Data are represented as mean −/+ SEM.
(B) DLD1 Mut and DLD1 KO cells were incubated for 10 min in control medium or in conditioned medium from DLD1 Mut cells (KRAS conditioned media; KCM) and then treated with SA, UV-C irradiation, oxaliplatin, or velcade as in Figure 1G. SG index based on G3BP immunofluorescence is shown.
(C) DLD1 KO cells were incubated as in Figure 4B in control medium, KCM, KCM immunodepleted with anti-IgG (KCM IgG), or KCM immunodepleted with anti-15-d-PGJ2 (KCM anti PGJ2) and then treated with SA (100 μM, 1hr). SGs were detected by G3BP immunofluorescence staining (top). SG index based on G3BP immunofluorescence is shown (bottom).
(D) DLD1 KO cells were incubated as in Figure 4B in control medium, KCM, or KCM from cells treated with diclofenac sodium (COX-i), and then treated with SA (100 μM, 1hr). SG index based on G3BP immunofluorescence is shown.
Data are from a representative experiment out of least 3 independent experiments. Error bars indicate mean −/+ SEM for at least 4 fields of view. *p<0.05, **p<0.005, ***p<0.0005. Scale bar, 10 μm.
Next, we investigated the effects of KCM on SG levels in KRAS WT cells. Incubation of DLD1 KO in KCM from DLD1 Mut cells resulted in SG upregulation in response to oxidative stress, UV-C irradiation, oxaliplatin-induced DNA damage, and velcade-induced proteotoxic stress (Figure 4B). Confirming that this is not a cell type-specific effect, KCM from DLD1 Mut cells also led to a significant enhancement of SG levels in RAS WT 5637 bladder cancer cells and Hela cells (data not shown). To formally prove that 15-d-PGJ2 is directly responsible for the SG enhancing activity displayed by KCM, we performed an immunodepletion experiment using a 15-d-PGJ2 antibody. The capacity of KCM from DLD1 Mut cells to upregulate SGs in DLD1 KO cells was abolished following 15-d-PGJ2 immunodepletion (Figure 4C). Moreover, KCM from DLD1 Mut cells that had been treated with a COX-1/2 inhibitor failed to exhibit the stimulatory effect on SG formation in DLD1 KO cells (Fig. 4D), supporting a role for prostaglandin biosynthesis in the cell non-autonomous regulation of SGs. Altogether these results establish 15-d-PGJ2 as a secreted molecule through which mutant KRAS cells modulate SG levels in a cell non-autonomous fashion.
Cell non-autonomous upregulation of SGs by mutant KRAS confers cytoprotection from stress stimuli
Because SGs have been shown to be critical for cellular survival in response to stress, we asked whether SGs could contribute to mutant KRAS-mediated resistance to stress stimuli and chemotherapeutic agents. Inhibition of SGs by emetine treatment, which stalls mRNA in polysomes and thus blocks SG assembly, enhanced oxidative stress-induced apoptosis in mutant KRAS-expressing HTO-KRASV12 but not in HTO wild type cells (Supplemental Figure 5A and 5B). In addition, treatment of DLD1 Mut cells with a COX-1/2 inhibitor, which inhibits SG formation, enhanced sensitivity to oxaliplatin (Figure 5A). Taken together these results indicate a dependence of mutant KRAS cells on SGs for resistance to stress stimuli.
Figure 5. KRAS cancer cells exert cell non-autonomous protection from chemotherapeutic agents via SG upregulation.
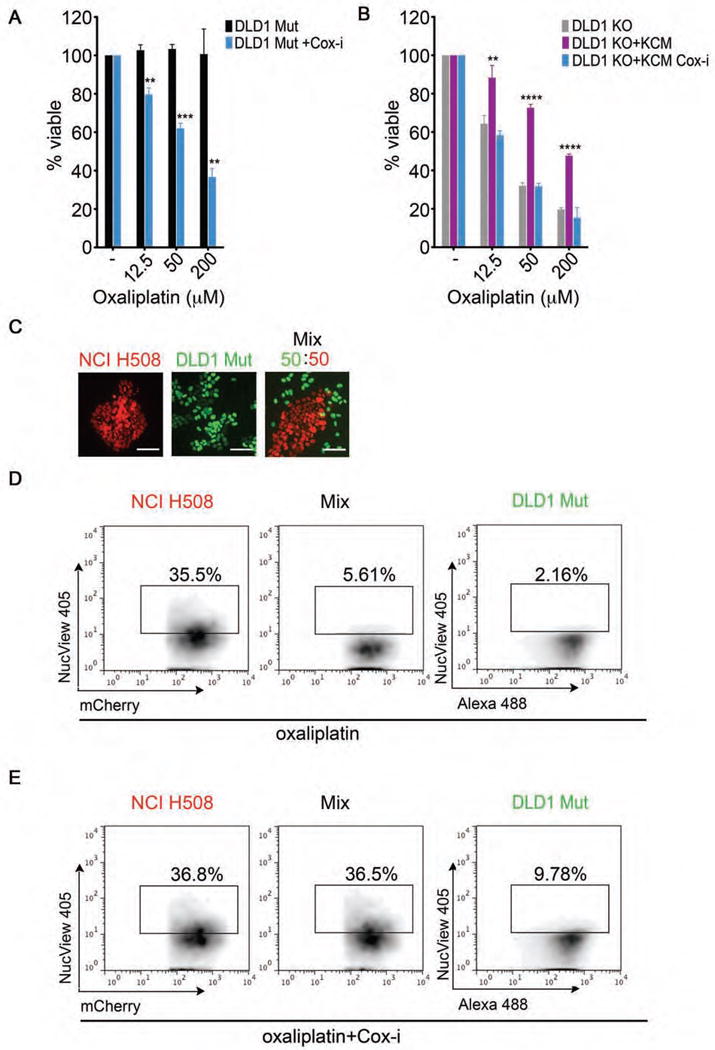
(A) Medium obtained from DLD1 Mut cells treated −/+ diclofenac sodium (COX-i) was utilized to dilute oxaliplatin at the indicated concentrations and added back to the respective conditions for 48 hrs. Cell viability was assessed using the MTT assay.
(B) Medium from DLD1 KO cells (control medium), KCM, and KCM from diclofenac sodium (COX-i) treated cells was used to dilute oxaliplatin to the indicated concentrations and added to DLD1 KO cells. Cell viability was assessed using the MTT assay after 48 hrs.
(C) Fluorescence images of mCherry-H2B-labeled NCI H508 cells (red), GFP-H2B-labeled DLD1 Mut cells (green), cultured individually or as a mixture. Scale bars represent 40 μm.
(D) The indicated cells lines were labeled and cultured as in (C) and subjected to oxaliplatin (100 μM, 48 hrs). Cell death in each population was assessed by flow cytometry analysis of NucView Alexa 405 positive cells.
(E) The indicated cells lines were cultured as in (C) and subjected to diclofenac sodium (20 μM, COX-i) as in Figure 4D followed by oxaliplatin (100 μM) for 48 hrs. Cell death in each population was assessed as in Figure 5D.
(A–B) Data is expressed as percentage of viable cells. Error bars are mean +/− SEM from 3 independent conditions each performed in triplicate. **p<0.05, ***p<0.005, ****p<0.0005.
(D–E) Data are from a representative experiment out of at least 3 independent experiments.
We next tested whether the cell non-autonomous upregulation of SGs could also confer cytoprotection against stress stimuli. To do so, DLD1 KO cells were incubated with normal growth medium, KCM from DLD1 Mut cells, or KCM from COX-1/2 inhibitor-treated DLD1 Mut cells in the presence or absence of oxaliplatin (Figure 5B). KCM from DLD1 Mut cells reduced the sensitivity of DLD1 KO cells to oxaliplatin treatment and this protective effect was lost when the KCM was derived from COX-1/2 inhibited DLD1 Mut cells (Figure 5B). Thus, COX-1/2-mediated cell non-autonomous upregulation of SGs might serve as a mechanism by which mutant KRAS cells can impart resistance to chemotherapeutic agents to KRAS WT cells.
Next we asked whether this mode of cytoprotection could also occur under conditions that mimic the mutational heterogeneity observed in KRAS-driven tumors. Patient biopsies have identified tumors where mutant KRAS cancer cells co-exist with mutant PI3K cancer cells, or where mutant RAS clones arise after treatment of BRAF mutant tumors with BRAF inhibitors (Baldus et al., 2010; Kopetz et al., 2015; Nazarian et al., 2010; Poulikakos et al., 2011; Richman et al., 2011). Accordingly, we co-cultured DLD1 Mut and NCI-H508 (BRAF mut/PI3K mut) cells that stably express GFP-H2B and mCherry-H2B, respectively (Figure 5C). This differential labeling of the cells allowed us to quantify the level of cell death in each cell type after treatment with oxaliplatin by flow cytometry using the NucView 405-Caspase 3 reporter (Figure 5D and 5E). Oxaliplatin had little effect on the viability of DLD1 Mut cells whereas it induced appreciably higher levels of cell death in NCI-H508 cells (Figure 5D). However, when co-cultured with DLD1 Mut cells, NCI-H508 displayed a markedly reduced sensitivity to oxaliplatin (Figure 5D). Notably, this reduced sensitivity to oxaliplatin correlated with significantly higher levels of SGs (~13-fold increase) in NCI-H508 cells when co-cultured with DLD1 Mut cells compared to when cultured alone (Supplemental Figure 5C and 5D). Consistent with mutant KRAS cells conferring cell non-autonomous drug resistance via the upregulation of SGs, treatment of the co-cultures with a COX1/2 inhibitor, impaired the ability of DLD1 Mut cells to confer cytoprotection (Figure 5E).
Positive regulators of SGs in patients of pancreatic adenocarcinoma are linked to poor survival
Our results indicate that cell non-autonomous upregulation of SGs by mutant KRAS may affect the stress resistance properties of the tumor ecosystem. As such, the status of SG regulators and the presence of SGs in human tumors could serve as predictors of tumor fitness and drug resistance. To investigate this idea, we examined the relationship between patient survival and the levels of SG regulators identified by our study, PTGS2 (COX-2) and HPGD. Kaplan-Meier curves of a human pancreatic carcinoma cohort stratified by maximized PTGS2 and HPGD expression risk groups revealed that a significant subgroup (~70% of patients) with anticipated high levels of SGs (high COX-2; low HPGD) had lower overall survival (Figure 6). As ~90% of pancreatic adenocarcinomas manifest KRAS mutations this stratification of survival based on anticipated SG levels would suggest that SG upregulation may represent an important mechanism through which mutant KRAS may confer tumor fitness and reduced survival. In support of this idea, we found that high PTGS2 expression was significantly associated with poorer recurrence free survival (RFS) in TCGA colon adenocarcinoma (COAD) patients with KRAS mutated tumors (Supplemental Figure 6). Conversely, in the absence of KRAS mutations, high PTGS2 levels showed no significant effect on patient RFS. These observations suggest that SG upregulation may have important implications for the fitness of mutant KRAS tumors. Clearly, additional in vivo studies will be required to determine the role of SGs in tumor drug response, and whether SG levels and PTGS2/HPGD expression are prognostic or predictive of tumor progression and therapy response.
Figure 6. Expression levels of regulators of SGs correlate with poor survival in human pancreatic cancers.
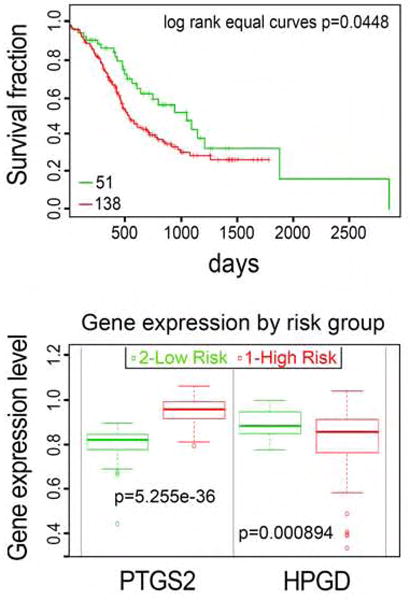
Kaplan-Meier survival curves of censored COX analysis showing overall survival for PACA-AU-ICGC human pancreatic carcinoma cohort (top) stratified by maximized PTGS2 and HPGD expression risk groups for the respective cohorts (bottom). (SurvExpress). Error bars indicate SD.
DISCUSSION
The tumorigenic process subjects cancer cells to a variety of stresses which function as selection barriers that force the emergence of cells that are resistant to the adverse effects of stress. Increasing evidence indicates that the acquisition of stress resistance mechanisms by cancer cells not only provides them with a survival advantage, but is also associated with a diminished sensitivity to standard-of-care cytotoxic chemotherapies and targeted therapies (Pazarentzos and Bivona, 2015; Solimini et al., 2007). In this study we have identified a mutant KRAS-dependent capability of cancer cells to self-protect against stress-inducing stimuli and chemotherapeutic agents through the upregulation of SGs. Furthermore, we show that this protective mechanism can be engaged in both a cell autonomous and cell non-autonomous fashion thereby enabling the stress adaptation of tumor cell communities.
Mutant KRAS-driven cancers are extremely refractory to standard chemotherapeutic treatments (McCormick, 2015). Efforts to understand the molecular mechanisms underlying the therapeutic resistance of KRAS tumors have largely focused on RAS-regulated events that impinge on drug delivery and cell survival (Chin et al., 1992; Zuber et al., 2000; Faber et al., 2014; Hata et al., 2014). Recent studies have indicated that SGs can limit the efficacy of several chemotherapeutic agents such as platinum compounds, 5-FU, bortezomib, and the multikinase inhibitor sorafenib (Adjibade et al., 2015; Fournier et al., 2010; Kaehler et al., 2014). Our results demonstrate that mutant KRAS is sufficient and necessary for the upregulation of SGs in response to stress stimuli and chemotherapeutic agents (Figure 1). When this capacity of mutant KRAS is abrogated, the sensitivity of mutant KRAS cells to the chemotherapeutic agent oxaliplatin is greatly enhanced (Figure 4 and 5). Altogether, these findings suggest that therapies aimed at inhibiting SGs may provide a potential avenue to enhance the efficacy of chemotherapeutic agents in mutant KRAS cancers.
Our results identify 15-d-PGJ2 as a critical mediator of mutant KRAS-dependent SG upregulation. We propose that mutant KRAS drives the production of this prostaglandin metabolite by regulating two critical steps in prostaglandin metabolism: COX-2-mediated prostaglandin biosynthesis and HPGD-mediated prostaglandin catabolism. This postulate is based on our findings that mutant KRAS promotes the expression of COX-2 and suppresses the expression of HPGD. While the induction of COX-2 by activated RAS has been reported in earlier studies (Hoang et al., 2006; Sheng et al., 2001; Sheng et al., 1998) the suppression of HPGD expression represents a previously unrecognized capability of mutant KRAS to inhibit prostaglandin catabolism. Notably, both COX-2 upregulation and HPGD suppression have been reported to cooperate with mutant KRAS and accelerate cancer progression in animal models (Funahashi et al., 2007; Pham et al., 2008). Moreover, in patients with pancreatic or colon adenocarcinoma, a large fraction of which harbor KRAS mutations, high levels of COX-2 and low levels of HPGD correlated with lower overall survival (Figure 6 and Supplemental Figure 6). Further studies will be required to determine whether the levels of these molecules predict SG upregulation and prognosis. However, given the role of adaptive stress responses in conferring tumorigenic fitness, it is enticing to speculate that the capacity of these molecules to promote the progression of mutant KRAS cancers could be attributed, at least in part, to their essential role in controlling mutant KRAS-dependent upregulation of SGs. It is noteworthy that several epidemiological studies have demonstrated a role for COX inhibitors in the prevention of human cancers (Cooper et al., 2010). It remains to be determined whether in the context of mutant KRAS tumors, the chemopreventive benefits of COX inhibitors may be related to their ability to impair SG formation in vivo.
From a therapeutic perspective, our data indicate that prostaglandins may play a role in the chemoresistance of mutant KRAS cells in large part due to their capacity to induce the upregulation of SGs. Consequently, targeting the mutant KRAS-driven accumulation of 15-d-PGJ2, the critical mediator of SG upregulation, is likely to be of therapeutic benefit. In agreement with this postulate, COX-2 inhibition combined with chemotherapy showed a survival advantage in patients with moderate to high levels of COX-2 in a phase II clinical trial (Edelman et al., 2008). Another phase II study in previously untreated COX-2-positive advanced NSCLC patients showed therapeutic benefit to COX-2 inhibition in combination with platinum-based chemotherapy (Wang et al., 2008). A larger study however employing various biomarkers of COX activity and target engagement have reported no meaningful clinical benefit, highlighting the need for more specific strategies for targeting prostaglandin accumulation (Edelman et al., 2015). For example, the development of agents that lower the cellular levels of 15-d-PGJ2 or specifically inhibit 15-d-PGJ2 may constitute a useful approach for the chemosensitization of KRAS tumors.
Consistent with the secretory nature of 15-d-PGJ2, we have found that mutant KRAS can upregulate SGs in a 15-d-PGJ2-mediated cell non-autonomous fashion. This finding has significant implications as it is becoming increasingly apparent that cancer cells within a tumor show extensive genetic and phenotypic heterogeneity, thus rendering the design of effective therapies that target all cell populations within tumors a major challenge. The existence of such heterogeneity in tumors harboring mutant KRAS is indicated by reports demonstrating significant variations in KRAS mutational status in lung, colon, and papillary thyroid carcinomas (Baldus et al., 2010; Dieterle et al., 2004; Han et al., 2011; Perez et al., 2013; Richman et al., 2011). Importantly, it has been shown that mutant KRAS clones can affect the chemosensitivity of non-mutant KRAS clones rendering them resistant to anti-cancer therapies (Hobor et al., 2014; Molinari et al., 2011). Our results indicate that the cell non-autonomous effect of mutant KRAS cells on SG formation may provide a mechanism for such inter-clonal cooperation. Accordingly, SG upregulation could represent a therapeutic vulnerability that is shared by mutant and WT KRAS tumor cells and, as such, the targeting of this mechanism might represent an effective strategy to eradicate tumor cell communities.
Although the cytoprotective function of SGs is well documented, the precise mechanisms through which SGs confer stress resistance are yet to be established. To date, this capacity has been attributed predominantly to the sequestration of macromolecules - proteins, mRNA, miRNA – that are linked to regulatory pathways that control cell survival. For example, the recruitment of TNF receptor associated factor (TRAF) to SGs inhibits tumor necrosis factor signaling under stress, thus blocking cellular apoptosis (Kim et al., 2005). Additionally, the global shift in mRNA translation and mRNA stability resulting from the recruitment of mRNA and miRNA to SGs has been postulated to contribute to stress resistance (Kedersha et al., 2013). The macromolecular composition of SGs can vary significantly depending on the type of stress and the cellular background. In principle therefore, in a setting of mutant KRAS, SGs may have a distinct composition that in turn may impart a unique translational and post-translational stress signature. Clearly, further investigation will be required to understand whether such a signature could be predictive of overall tumor cell resilience and chemotherapeutic resistance.
STAR METHODS
Contact for reagents and resource sharing
Email contact for reagent and resource sharing: Dafna.Bar-Sagi@nyumc.org
Constructs
To generate pLenti-CMV/TO GFP KRASV12 the coding sequence for KRASV12 was cloned into the pLenti-CMV/TO GFP-Zeo Destination vector. pLenti CMV/TO GFP-ZEO Dest (719-1) was a gift from Dr. Eric Campeau (Addgene plasmid # 17431) (Campeau et al., 2009). The constructs encoding mCherry-KRASV12, mCherry-KRASV12T35S, mCherry-KRASV12E37G, and mCherry-KRASV12Y40C were generated by cloning the corresponding KRAS mutants into the mCherry-C1 vector.
Cell lines
Human colon cancer cell lines DLD1, HT-29, NCI-H747, NCI-H508, SNUC-1, human pancreatic cancer cell lines Mia-PaCa-2, Panc-1, AsPC1, Capan2, Hs700T, and HEK-293T cells and Hela cells and were obtained from and cultured as indicated by American Type Culture Collection. The isogenic colon cancer cells DLD-1 K-RASWT/G12D (DLD1 Mut) and DLD1 K-RASWT/− (DLD1 KO; where the K-RasG12D allele has been knocked out by homologous recombination) (Luo et al., 2009a; Shirasawa et al., 1993) were a kind gift from Dr. Mark Philips. DLD1 Mut and DLD1 KO cells were cultured in RPMI medium with 10% fetal bovine serum and 1% penicillin/streptomycin.
To generate Hela Tet-ON KRASV12 (HTO-KRASV12), following viral particle production and transduction (MOI=1), Hela cells that had efficiently integrated the pLenti CMV/TO KRASV12 construct were obtained by fluorescent sorting based on the GFP marker. Sorted cells were subsequently transduced with a pLenti-CMV TetR Blast (Addgene) and selected with blasticidin (7μg/ml). pLenti CMV TetR Blast (716-1) was a gift from Dr. Eric Campeau (Addgene plasmid #17492) (Campeau et al., 2009). All expression experiments were performed on day 2 of doxycycline (1 μg/ml) induction.
To generate mCherry-H2B NCI-H508 cells and GFP-H2B DLD1 Mut cells, NCI-H508 and DLD1 Mut cells were transduced with a pLenti.PGK.H2B-chFP.W and LV-GFP respectively. pLenti.PGK.H2B-chFP.W was a gift from Dr. Rusty Lansford (Addgene plasmid # 51007) (Huss et al., 2015). LV-GFP was a gift from Dr. Elaine Fuchs (Addgene plasmid # 25999) (Beronja et al., 2010).
To generate PL45, Panc-1, Mia-PaCa-2, and AsPC-1 cells inducibly expressing scramble shRNA or KRAS shRNA, cells were transduced with lentiviral particles [multiplicity of infection (MOI) 7] containing pTripz scramble shRNA or KRAS shRNA (Open Biosystems) and selected with puromycin for 3 days. All knockdown experiments were performed on day 4 of doxycycline (1 μg/ml) induction.
Stress and inhibitor treatments
Sodium arsenate was dissolved in dH2O as a 100mM solution. Oxaliplatin was dissolved in DMSO as 100 mM solutions. Velcade was dissolved in DMSO as a 1 mM solution. UV-C irradiation was performed with Stratalinker 2400 (Agilent Technologies). Stress treatments were performed when cells had reached ~ 80% confluency. Before treatment cells were serum starved overnight. Stress treatments were performed by treating the cells with vehicle alone or with the different stress inducers: sodium arsenate (100 μM), UV-C (50 mJ/m2), oxaliplatin (100 μM), velcade (1 μM) for the indicated time points. For 15-d-PGJ2 treatments, cells were treated with 50 μM 15-d-PGJ2 (50mM stock solution in dH2O) for 1 hr. For COX-1/2 inhibition, cells were treated with 20 μM diclofenac sodium (50 mM stock solution in dH2O) for 16 hr. For HPGD inhibition, cells were treated with 20 μM 5-[[4-(ethoxycarbonyl)phenyl]azo]-2-hydroxy-benzeneacetic acid (20mM stock solution in DMSO) for 6 hr. For emetine inhibition of stress granules, cells were treated with 40 μg/ml emetine (40 mg/ml stock solution in dH2O).
Conditioned media experiments
To prepare conditioned medium, DLD1 Mut and DLD1 KO cells were grown to 70% confluency, washed three times with serum-free medium, and then incubated in serum-free medium for 20 hr. The medium from each cell type was harvested, centrifuged to eliminate intact cells, and supernatant was mixed 1:1 with serum free medium. For control treatments DLD1 Mut and DLD1 KO cells were incubated with conditioned media from DLD1 Mut and DLD1 KO cells, respectively, 10 minutes prior to stress treatment and medium was not changed for the remainder of the treatment. For KCM treatment DLD1 KO cells were incubated with conditioned media from DLD1 Mut as described above 10 minutes prior to stress treatment and medium was not changed for the remainder of the treatment. For immunodepletion experiments, KCM was incubated with anti-IgG (3 μg) or anti-15-d-PGJ2 (3 μg) for 3 hrs at 4°C. Subsequently, 50 μl of prewashed protein A/G sepharose resin was added to the mix and incubated at 4°C for 2 hrs. Immunodepleted supernatants were separated from protein A/G sepharose beads by centrifugation. Immunodepleted supernatants were each mixed 1:1 with serum free medium and added to cells 10 minutes prior to stress treatment.
Immunofluorescence and immunohistochemistry
Cells were grown on coverslips, fixed, and immunostained with antibodies for the established stress granule markers G3BP and eiF4G, as previously described (Kedersha and Anderson, 2007). For assessing stress granules in tissue samples, 5 μm thick paraffin sections were immunostained with anti-G3BP utilizing previously established procedures (Grabocka et al., 2014b). Slides were mounted in ProlongGold (Invitrogen). Imaging was performed using a DeltaVision Elite inverted microscope system (Applied Precision), using a 60×/1.4NA Oil PSF Objective from Olympus. The system was equipped with a CoolSNAP HQ2 camera and SoftWoRx imaging software version 5.0. 25 serial optical sections were captured every 0.2-μm and processed using the SoftWoRx deconvolution algorithm and projected into one maximum intensity projection picture using SoftWoRx software (Applied Precision). Images from each data set were acquired on the same day using the same exposure times. For histology, deparaffinized sections (5μm) were stained with Harris hematoxylin and eosin according to previously reported procedures (Grabocka et al., 2014b). Images were obtained using a Nikon Eclipse 80i microscope.
Quantification of stress granules
Stress granules were quantified using Image J (http://rsb.info.nih.gov/ij) as previously described (Commisso et al., 2013). Briefly, images were randomly acquired in 4 different fields with at least 50 cells/field. Background intensity was subtracted from each image. The plug in “Analyze Particles” was used to measure the total area of stress granules/total cell area, average size of SGs, and number of SGs/cell. The total cell area/image was delineated and measured through Image J selection and measure area tools. The stress granule index was determined by computing the total stress granule area in relation to the total cell area for each field, and then averaged across all fields.
Quantitative RT-PCR
The RNeasy mini kit (QIAGEN) and QuantiTect reverse transcription kit (QIAGEN) were respectively used for the extraction and reverse transcription of total RNA from cells. SYBR Green PCR Master Mix (USB) was used for amplification and the samples were run on the Stratagene Mx 3005P. The standard curve method was used to quantify gene expression. Expression was normalized to GAPDH.
FACS analysis
Staining for cleaved caspase 3 positive cells was performed using the Nucview-405 Caspase 3 Kit (Biotium) according to the manufacturer’s protocol. Flow cytometry was performed on an LSRII (BD Biosciences) instrument at NYU School of Medicine Flow Cytometry Core Facility, and data were analyzed using FlowJo software.
ELISA
15-d-PGJ2 and PGD2 levels in conditioned medium were measured by Elisa kits (15-d-PGJ2 from Enzo Lifesciences and PGD2-MOX from Cayman Chemicals) following the manufacturer’s instructions.
Proliferation
For viability assays, cells were seeded at a density of 4000 cells/well in 96 well plates. Twenty-four hrs post plating, cells were incubated in DMEM with 0.5% serum overnight and subsequently treated with oxaliplatin for 48 hrs. Cell viability was assessed by the MTT (3-[4,5-dimethylthiazol-2-yl]-2,5-diphenyl tetrazolium bromide; Sigma-Aldrich) assay according to the manufacturer’s protocol. Viable fraction is expressed as the percentage of vehicle treated control cells.
Mice
For xenografts, female homozygous NCr nude mice (Taconic) were injected subcutaneously in both flanks at 8 weeks of age with 1 × 10⁶ indicated cells mixed at a 1:1 dilution with BD Matrigel (BD Biosciences) in a total volume of 100 μL. When tumors reached an average volume of ~500 mm3 they were excised rapidly, fixed in formalin, and embedded in paraffin as previously described (Grabocka et al., 2014b). For the autochthonous model, pancreata from LSL-KRasG12D;p53R172H/+;pdx-Cre (KPC) mice at 17 weeks of age or control wild-type littermates were isolated and embedded in paraffin. All animal work was approved by New York University Langone Medical Center Institutional Animal Care and Use Committee.
Human Pancreas Specimens
The use of human tissue was reviewed and approved by the Institutional Review Board of NYU School of Medicine and samples (provided by the Tissue Acquisition and Biorepository Service) were obtained after informed consent. Sections (5 μm) were cut from formalin-fixed paraffin-embedded samples for the purpose of immunostaining. A total of 6 pancreatic adenocarcinoma and 3 normal tissues adjacent to PDACs were analyzed.
Analysis of human patient data
We analyzed the publicly available datasets of the UCSC Cancer Browser (https://genome-cancer.ucsc.edu). To retrace the exact Kaplan–Meyer analysis for the analysis of PDA patients stratified by PTGS2/HPGD, please visit SurvExpress http://bioinformatica.mty.itesm.mx:8080/Biomatec/SurvivaX.jsp (Aguirre-Gamboa et al., 2013).
Statistical analysis
Data were analyzed by the Graphpad Prism built-in test (unpaired, two-tailed), and results were considered significant at P<0.05. Statistical parameters including number of replicates, fold-change or log fold-change, SEM, SD, and statistical significance are reported in the figures and supplemental data.
KEY RESOURCES TABLE
| REAGENT or RESOURCE | SOURCE | IDENTIFIER |
|---|---|---|
| Antibodies | ||
| Mouse monoclonal G3BP | BD Biosciences | Cat# 611126; clone 23/G3BP; RRID:AB_398437 |
| Mouse monoclonal K-RAS | Santa Cruz Biotechnologies | Cat# sc-30; clone F234; RRID:AB_627865 |
| Mouse monoclonal Erk2 | EMD Millipore | Cat# 05-157; clone 1B3B9; RRID:AB_309637 |
| Mouse monoclonal vinculin | Sigma Aldrich | Cat# V9131; clone hVIN-1; RRID:AB_477629 |
| Rabbit polyclonal eiF4G | Santa Cruz Biotechnologies | Cat# sc-11373; clone H-300; RRID:AB_2095750 |
| Rabbit monoclonal phospho-eiF2α | Cell Signaling | Cat# 3398; clone D9G8; RRID:AB_2096481 |
| Rabbit monoclonal eiF2α | Cell Signaling | Cat# 5324; clone D7D3; RRID:AB_10692650 |
| Goat polyclonal eIF4A1 | Santa Cruz Biotechnologies | Cat# sc-14211; clone N-19; RRID:AB_2097369 |
| Rabbit monoclonal phospho-Erk1/2 | Cell Signaling | Cat# 4370; clone D13.14.4E; RRID:AB_2315112 |
| Rabbit monoclonal COX-2 | LabVision | Cat# RM9121-S0; clone SP21; RRID:AB_720731 |
| Rabbit polyclonal 15-PGDH | GeneTex | Cat# GTX113465; clone N1C2; RRID:AB_10617920 |
| Rabbit polyclonal 15-deoxy Delta 12,14 Prostaglandin J2 antibody (15-d-PGJ2) | Abcam | Cat#ab2313; RRID:AB_302970 |
| Rat monoclonal CK8 | Brûlet, P., et al. PNAS, 1980. | Developmental Studies Hybridoma Bank Cat#TROMA-I; RRID:AB_531826 |
| Rabbit monoclonal CK19 | Abcam | Cat#ab52625;clone EP1580Y; RRID:AB_2281020 |
| Rabbit polyclonal PABP1 | Cell Signaling | Cat#4992S; RRID:AB_10693595 |
| Goat anti-Mouse IgG (H+L) Secondary Antibody, Alexa Fluor 488 | ThermoFisher | Cat#A-11029; RRID: AB_2534088 |
| Goat anti-Mouse IgG (H+L) Secondary Antibody, Alexa Fluor 555 | ThermoFisher | Cat#A-21424; RRID: AB_2535845 |
| Goat anti-Rabbit IgG (H+L) Secondary Antibody, Alexa Fluor 488 | ThermoFisher | Cat#A-11034; RRID: AB_2576217 |
| Goat anti-Rabbit IgG (H+L) Secondary Antibody, Alexa Fluor 555 | ThermoFisher | Cat#A-21429; RRID: AB_2535850 |
| Goat anti-Rat IgG (H+L) Secondary Antibody, Alexa Fluor 488 | ThermoFisher | Cat#A-11006; RRID: AB_2534074 |
| Goat anti-Mouse IgG (H+L) Secondary Antibody, Alexa Fluor 680 | ThermoFisher | Cat#A-21058; RRID:AB_2535724 |
| IRDye 800CW Goat anti-Rabbit IgG (H + L) | LI-COR Biosciences | Cat#926-32211; RRID:AB_621843 |
| IRDye 800CW Donkey anti-Goat IgG (H + L) | LI-COR Biosciences | Cat# 925-32214 |
| Chemicals, Peptides, and Recombinant Proteins | ||
| Sodium arsenate | Sigma | Cat#S7400; CAS#7784-46-5 |
| Oxaliplatin | Tocris Bioscience | Cat#2623; CAS#61825-94-3 |
| Velcade (bortezomib) | Santa Cruz Biotechnology | Cat#sc-217785; CAS# 179324-69-7 |
| 15-deoxy-Δ12,14-Prostaglandin J2(15-d-PGJ2) | Cayman | Cat#18570; CAS# 87893-55-8 |
| Prostaglandin E2 | Tocris Bioscience | Cat#2296; CAS# 363-24-6 |
| Diclofenac sodium | Selleck | Cat#S1903; CAS# 15307-79-6 |
| 5-[[4-(ethoxycarbonyl)phenyl]azo]-2-hydroxybenzeneacetic acid | Santa Cruz Biotechnology | Cat#sc-205129; CAS# 78028-01-0 |
| Emetine | Calbiochem | Cat#324693; CAS# 316-42-7 |
| Protein A/G PLUS-Agarose | Santa Cruz Biotechnology | Cat#sc-2003 |
| Prolong Gold Antifade Mountant | Molecular Probes | Cat#P36934 |
| HotStart-IT SYBR Green qPCR Master Mix (2×) | Affymetrix | Cat#75762 500 |
| Puromycin | Calbiochem | Cat# 540411; CAS# 58-58-2 |
| Doxycycline | Sigma | Cat#D9891; CAS# 24390-14-5 |
| Blasticidin | Invitrogen | Cat#R21001; CAS# 3513-03-9 |
| 3-[4,5-dimethylthiazol-2-yl]-2,5-diphenyltetrazolium bromide MTT | Sigma | Cat#M5655; CAS# 298-93-1 |
| Harris hematoxylin | Sigma | Cat#HHS32 |
| Eosin Y aqueous | Sigma | Cat#HT110216 |
| Matrigel | Corning | Cat#CB-40234B |
| Critical Commercial Assays | ||
| 15-deoxy-Δ12,14-PGJ2 ELISA kit | Enzo Lifesciences | Cat#ADI-900-023 |
| Prostaglandin D2-MOX ELISA Kit | Cayman Chemicals | Cat#512011 |
| NucView 405 Caspase-3 substrate | Biotium | Cat#10405 |
| RNeasy Mini Kit | Qiagen | Cat#74104 |
| QuantiTect Reverse Transcription Kit | Qiagen | Cat#205311 |
| Experimental Models: Cell Lines | ||
| Human: HT-29 | ATCC | Cat#HTB-38; RRID:CVCL_0320 |
| Human: NCI-H747 | ATCC | Cat#CCL-252; RRID:CVCL_1587 |
| Human: NCI-H508 | ATCC | Cat#CCL-253; RRID:CVCL_1564 |
| Human: SNU-C1 | ATCC | Cat#CRL-5972; RRID:CVCL_1708 |
| Human: MIA PaCa-2 | ATCC | Cat#CRL-1420; RRID:CVCL_0428 |
| Human: PANC-1 | ATCC | Cat#CRL-1469; RRID:CVCL_0480 |
| Human: AsPC-1 | ATCC | Cat#CRL-1682; RRID:CVCL_0152 |
| Human: Capan-2 | ATCC | Cat#HTB-80; RRID:CVCL_0026 |
| Human: Hs 700T | ATCC | Cat#HTB-147; RRID:CVCL_0858 |
| Human: DLD-1 | Laboratory of Mark Philips (Luo J., et al. Cell, 2009a; Shirasawa S., et al. Science. 1993) | Cat# NA |
| Human: DLD-1 K-RASWT/− | Laboratory of Mark Philips (Luo J., et al. Cell, 2009a; Shirasawa S., et al. Science. 1993) | Cat# NA |
| Human: Hela | ATCC | Cat#CCL2; RRID: CVCL_0030 |
| Experimental Models: Organisms/Strains | ||
| Mouse: NCr-Foxn1nu | Taconic | Cat#NCRNU; RRID:IMSR_TA C:ncrnu |
| Mouse: LSL -KrasG12D/+;LSL-Trp53R172H/+;Pdx-1-Cre | Hingorani, S., et al. Cancer Cell. 2005 | Cat#NA |
| Recombinant DNA | ||
| pLenti CMV/TO GFP-Zeo DEST (719-1) | Campeau, E., et al. PLoS One. 2009 | Addgene Cat#17431 |
| pLenti CMV TetR Blast (716-1) | Campeau, E., et al. PLoS One. 2009 | Addgene Cat#17492 |
| pLenti.PGK.H2B-chFP.W | Huss, D., et al., Development. 2015 | Addgene Cat#51007 |
| LV-GFP | Beronja, S., et al., Nature Medicine. 2010 | Addgene Cat#25999 |
| Sequence-Based Reagents | ||
| Kras shRNA V2THS-275818 | Open Biosystems | V2THS-275818 |
| Primer:GAPDH forward AAGGTGAAGGTCGGAGTCAA | This paper | |
| Primer:GAPDHreverseAATGAAGGGGTCATTGATGG | This paper | |
| Primer:COX2 forward GGCTCAAACATGATGTTTGCA | This paper | |
| Primer:COX2reverseCCTCGCTTATGATCTGTCTTGA | This paper | |
| Primer: HPGD forward GAAGGCGGCATCATTATCAA | This paper | |
| Primer: HPGD reverse GCCATGCTTTGAAGCACAA | This paper | |
| Software and Algorithms | ||
| Image J | Abramoff, M.D., Biophotonics International, 2004 | https://imagej.nih.gov/ij; RRID:SCR_003070 |
| UCSC Cancer Browser | Zhu, J., Nature Methods. 2009 | https://genome-cancer.ucsc.edu; RRID:SCR_011796 |
| SurvExpress | Aguirre-Gamboa et al., Plos one. 2013 | http://bioinformatica.mty.itesm.mx:8080/Biomatec/SurvivaX.jsp |
| SoftWoRx version 6.5.2 | http://www.gelifesciences.com/webapp/wcs/stores/servlet/productById/en/GELifeSciences-us/29065728 | |
| Graphpad Prism 7 | http://www.graphpad.com/scientific-software/prism/ | |
Supplementary Material
(A) Top-Whole cell lysates (WCL) from AsPC1, MiaPaCa-2, and Panc-1 cells expressing inducible scramble (Scr) or KRAS shRNA were subjected to immunoblotting with the indicated antibodies. Tubulin serves as a loading control. Blots are representative of at least 3 independent experiments. Bottom-AsPC-1, MiaPaCa-2, and Panc-1 cells expressing inducible scramble (Scr) or KRAS shRNA were treated with SA. SG index based on G3BP immunofluorescence is shown.
(B) SG index in DLD1 Mut and DLD1 KO cells treated with SA (100 μM, 1hr). based on eIF4G immunofluorescence.
C) Hela Tet-ON cells (HTO) and HTO cells that conditionally express mutant KRAS (HTO-KRASV12) were treated with SA (100 μM, 30 min). SG size distribution (left, each dot represents one SG; ●, HTO-KRASV12, ●, HTO) and average number of SGs/SG-positive cell (right) were determined based on G3BP immunofluorescence.
D) HTO-KRASV12 treated −/+ PD0325901 (1uM, 20 hrs) were subjected to SA (100 μM, 1hr). SG index was determined based on G3BP immunofluorescence.
(E–F) DLD1 Mut and DLD1 KO cells were treated with 100 μM sodium arsenate (E) or UV-C (50 mJ/m2) (F). SG index was determined at the indicated time points based on G3BP immunofluorescence.
Data are from a representative experiment out of least 3 independent experiments. Error bars indicate mean −/+ SEM for at least 4 fields of view with at least 50 cells/field of view. **p<0.01, ***p < 0.001, ****p<0.0001.
(A) Sections from two independent human PDAC tissues were immunostained for G3BP and PABP1.
(B) Sections from subcutaneous xenograft tumors of KRAS Mut (PL45, DLD1) and KRAS WT (BxPC-3) cells were immunostained for G3BP and CK8 (epithelial marker). Scale bar 10 μm. Images are representative from 3 animals/cohort. High magnification of boxed areas (3× zoom-in) are shown on the right.
(A) DLD1 Mut cells were treated with SA as in Figure 3A and SGs were detected by immunofluorescence staining for PABP1 and eIF5.
(B) Untreated DLD1 Mut and DLD1 KO cells were immunostained for G3BP (control corresponding to Figure 3C).
(C) DLD1 Mut and DLD1 KO cells were treated with PGE2 (50 μM, 1hr) and immunostained for G3BP.
(D) COX-2 and HPGD mRNA levels in PL45 cells expressing scramble (Scr) and KRAS shRNA were assessed by quantitative RT-PCR. Error bars indicate SEM (n=3).
(E) Levels of COX-2 in Pei pancreatic carcinoma (top) cohorts and the levels of HPGD in Ishikawa pancreatic carcinoma (bottom) cohorts vs. normal pancreas. (Oncomine). Error bars indicate SD.
(F) Level 3 Pan-cancer normalized Illumina HiSeq V2 TCGA LUAD mRNA data -and corresponding clinical data were downloaded from the UCSC Cancer Browser (https://genome-cancer.ucsc.edu). Samples were filtered for those fulfilling the following criteria: primary tumor, KRAS mutational profiling results, tobacco smoking history known, Current smoker and Current reformed smoker for < or = 15 years, for a total of 24 tumors (n= 11 KRAS Mut, n= 13 KRAS WT). The lines indicate the mean.
(G) DLD1 Mut cells were treated as in Figure 3F. SG index based on eIF4G immunofluorescence is shown.
(H) DLD1 Mut and DLD1 KO cells were treated as in Figure 3H. SG index based on eIF4G immunofluorescence is shown.
(C, G–H) Data are from a representative experiment out of least 3 independent experiments. Error bars indicate mean −/+ SEM for at least 4 fields of view with at least 50 cells/field of view. ** p < 0.05, ****p<0.0005.
The levels of 15-d-PGJ2 that were secreted by MiaPaCa-2 and AsPC-1 cells expressing inducible scramble (Scr) or KRAS shRNA were determined by ELISA of the respective cell culture medium. Data are represented as mean −/+ SEM. ** p < 0.05.
(A–B) HTO-KRASV12 and HTO cells were treated with SA (100 μM, 1hr) in the presence or absence of emetine (40 μg/ml). (A) SGs were detected by G3BP immunofluorescence staining. (B) Cell death was assessed by analysis of NucView Alexa 405 positive cells from least 4 fields of view with at least 50 cells/field of view. Scale bar 10 μm. Error bars indicate SEM (n=3). **p<0.05, ***p<0.005.
(C) mCherry-H2B-labeled NCI-H508 cells cultured alone or co-cultured with DLD1 Mut cells were treated with oxaliplatin as in Figure 5D–E. SGs were detected by G3BP immunofluorescence staining. Scale bar 10 μm.
(D) SG index in NCI-H508 cells cultured alone, NCI-H508 cells co-cultured with DLD1 Mut cells, and DLD1 Mut cells alone treated as in A. SG index based on G3BP immunofluorescence is shown. Data are from a representative experiment out of least 3 independent experiments. Error bars indicate mean −/+ SEM for at least 4 fields of view with at least 50 cells/field of view. ****p<0.0001.
Level 3 Pan-cancer normalized Illumina HiSeq V2 COAD mRNA data and corresponding clinical data were downloaded from the UCSC Cancer Browser (https://genome-cancer.ucsc.edu). Samples were filtered for those fulfilling the following criteria: primary tumor and KRAS mutational profiling results, for a total of 48 tumors (n= 23 KRAS Mut, n= 25 KRAS WT). Patients in each cohort (ie. KRAS Mut and WT) were then stratified by PTGS2 tumor expression, into high (top third) and low (bottom third) expression cohorts. Recurrence free survival was plotted using the Kaplan-Meier method and survival curves were compared by Log-rank (Mantel-Cox) tests.
Highlights.
Stress granules (SGs) are markedly elevated in mutant KRAS cells and tumors.
Mutant KRAS upregulates SGs by stimulating the production of 15-d-PGJ2.
15-d-PGJ2 secretion by mutant KRAS cells enables paracrine upregulation of SGs.
Mutant KRAS-dependent upregulation of SGs confers resistance to stress stimuli.
Summary.
By producing a lipid molecule that promotes stress granule formation, tumor cells protect themselves and neighboring cells from the effects of stress stimuli and chemotherapy drugs.
Acknowledgments
We would like to thank Dr. Cristina Hajdu, Department of Pathology, New York University School of Medicine, for providing human pancreatic cancer samples. We are grateful to Dr. Emily Vucic for the genome data analysis of lung and colon adenocarcinoma patients. We thank Dr. Cosimo Commisso and Dr. Yuliya Pulayeva-Gupta for providing tissues samples and technical expertise with animal studies. We thank Dr. Laura Taylor for help with manuscript preparation and the members of the Bar-Sagi lab for discussions.
GRANT SUPPORT
NYULMC Office of Collaborative Science Cytometry Core and Histology Core are shared resources partially supported by the Cancer Center Support Grant, P30CA016087, at the Laura and Isaac Perlmutter Cancer Center. This work was supported by grants from the National Institutes of Health R01CA055360 (DBS) and 1F32CA13922 (EG).
Footnotes
Publisher's Disclaimer: This is a PDF file of an unedited manuscript that has been accepted for publication. As a service to our customers we are providing this early version of the manuscript. The manuscript will undergo copyediting, typesetting, and review of the resulting proof before it is published in its final citable form. Please note that during the production process errors may be discovered which could affect the content, and all legal disclaimers that apply to the journal pertain.
COMPETING FINANCIAL INTERESTS
The authors declare no competing financial interests.
AUTHOR CONTRIBUTIONS
EG and DBS conceived the study and co-wrote the manuscript. EG conceived and conducted the experiments and data analysis.
References
- Abramoff MD, Magalhaes PJ, Ram SJ. Image processing with ImageJ. Biophotonics international. 2004;11:36–42. [Google Scholar]
- Adjibade P, St-Sauveur VG, Quevillon Huberdeau M, Fournier MJ, Savard A, Coudert L, Khandjian EW, Mazroui R. Sorafenib, a multikinase inhibitor, induces formation of stress granules in hepatocarcinoma cells. Oncotarget. 2015;6:43927–43943. doi: 10.18632/oncotarget.5980. [DOI] [PMC free article] [PubMed] [Google Scholar]
- Anderson P, Kedersha N, Ivanov P. Stress granules, P-bodies and cancer. Biochimica et biophysica acta. 2015;1849:861–870. doi: 10.1016/j.bbagrm.2014.11.009. [DOI] [PMC free article] [PubMed] [Google Scholar]
- Aguirre-Gamboa R, Gomez-Rueda H, Martı´nez-Ledesma E, Martı´nez-Torteya A, Chacolla-Huaringa R, Rodriguez-Barrentos A, Tamez-Pen˜ AJG, Trevin˜ OV. SuryExpress: an online biomarker validation tool and database for cancer gene expression data using survival analysis. PloS One. 2013;8:e74250. doi: 10.1371/journal.pone.0074250. [DOI] [PMC free article] [PubMed] [Google Scholar]
- Arimoto K, Fukuda H, Imajoh-Ohmi S, Saito H, Takekawa M. Formation of stress granules inhibits apoptosis by suppressing stress-responsive MAPK pathways. Nature cell biology. 2008;10:1324–1332. doi: 10.1038/ncb1791. [DOI] [PubMed] [Google Scholar]
- Baldus SE, Schaefer KL, Engers R, Hartleb D, Stoecklein NH, Gabbert HE. Prevalence and heterogeneity of KRAS, BRAF, and PIK3CA mutations in primary colorectal adenocarcinomas and their corresponding metastases. Clinical cancer research : an official journal of the American Association for Cancer Research. 2010;16:790–799. doi: 10.1158/1078-0432.CCR-09-2446. [DOI] [PubMed] [Google Scholar]
- Beronja S, Livshits G, Williams S, Fuchs E. Rapid functional dissection of genetic networks via tissue-specific transduction and RNAi in mouse embryos. Nature medicine. 2010;16:821–827. doi: 10.1038/nm.2167. [DOI] [PMC free article] [PubMed] [Google Scholar]
- Bordeleau ME, Matthews J, Wojnar JM, Lindqvist L, Novac O, Jankowsky E, Sonenberg N, Northcote P, Teesdale-Spittle P, Pelletier J. Stimulation of mammalian translation initiation factor eIF4A activity by a small molecule inhibitor of eukaryotic translation. Proceedings of the National Academy of Sciences of the United States of America. 2005;102:10460–10465. doi: 10.1073/pnas.0504249102. [DOI] [PMC free article] [PubMed] [Google Scholar]
- Brûlet P, Babinet C, Kemler R, Jacob F. Monoclonal antibodies against trophectoderm-specific markers during mouse blastocyte formation. Proc Natl Acad Sci USA. 1980;7:4113–4117. doi: 10.1073/pnas.77.7.4113. [DOI] [PMC free article] [PubMed] [Google Scholar]
- Buchan JR, Parker R. Eukaryotic stress granules: the ins and outs of translation. Molecular cell. 2009;36:932–941. doi: 10.1016/j.molcel.2009.11.020. [DOI] [PMC free article] [PubMed] [Google Scholar]
- Campeau E, Ruhl VE, Rodier F, Smith CL, Rahmberg BL, Fuss JO, Campisi J, Yaswen P, Cooper PK, Kaufman PD. A versatile viral system for expression and depletion of proteins in mammalian cells. PloS one. 2009;4:e6529. doi: 10.1371/journal.pone.0006529. [DOI] [PMC free article] [PubMed] [Google Scholar]
- Chin KV, Ueda K, Pastan I, Gottesman MM. Modulation of activity of the promoter of the human MDR1 gene by Ras and p53. Science. 1992;255:459–462. doi: 10.1126/science.1346476. [DOI] [PubMed] [Google Scholar]
- Commisso C, Davidson SM, Soydaner-Azeloglu RG, Parker SJ, Kamphorst JJ, Hackett S, Grabocka E, Nofal M, Drebin JA, Thompson CB, et al. Macropinocytosis of protein is an amino acid supply route in Ras-transformed cells. Nature. 2013;497:633–637. doi: 10.1038/nature12138. [DOI] [PMC free article] [PubMed] [Google Scholar]
- Cooper K, Squires H, Carroll C, Papaioannou D, Booth A, Logan RF, Maguire C, Hind D, Tappenden P. Chemoprevention of colorectal cancer: systematic review and economic evaluation. Health technology assessment. 2010;14:1–206. doi: 10.3310/hta14320. [DOI] [PubMed] [Google Scholar]
- Dewey CM, Cenik B, Sephton CF, Dries DR, Mayer P, 3rd, Good SK, Johnson BA, Herz J, Yu G. TDP-43 is directed to stress granules by sorbitol, a novel physiological osmotic and oxidative stressor. Molecular and cellular biology. 2011;31:1098–1108. doi: 10.1128/MCB.01279-10. [DOI] [PMC free article] [PubMed] [Google Scholar]
- Dieterle CP, Conzelmann M, Linnemann U, Berger MR. Detection of isolated tumor cells by polymerase chain reaction-restriction fragment length polymorphism for K-ras mutations in tissue samples of 199 colorectal cancer patients. Clinical cancer research : an official journal of the American Association for Cancer Research. 2004;10:641–650. doi: 10.1158/1078-0432.ccr-1355-02. [DOI] [PubMed] [Google Scholar]
- Downward J. RAS Synthetic Lethal Screens Revisited: Still Seeking the Elusive Prize? Clinical cancer research: an official journal of the American Association for Cancer Research. 2015;21:1802–1809. doi: 10.1158/1078-0432.CCR-14-2180. [DOI] [PMC free article] [PubMed] [Google Scholar]
- Eberhard DA, Johnson BE, Amler LC, Goddard AD, Heldens SL, Herbst RS, Ince WL, Janne PA, Januario T, Johnson DH, et al. Mutations in the epidermal growth factor receptor and in KRAS are predictive and prognostic indicators in patients with non-small-cell lung cancer treated with chemotherapy alone and in combination with erlotinib. Journal of clinical oncology : official journal of the American Society of Clinical Oncology. 2005;23:5900–5909. doi: 10.1200/JCO.2005.02.857. [DOI] [PubMed] [Google Scholar]
- Edelman MJ, Tan MT, Fidler MJ, Sanborn RE, Otterson G, Sequist LV, Evans TL, Schneider BJ, Keresztes R, Rogers JS, et al. Randomized, double-blind, placebo-controlled, multicenter phase II study of the efficacy and safety of apriCOXib in combination with either docetaxel or pemetrexed in patients with biomarker-selected non-small-cell lung cancer. Journal of clinical oncology : official journal of the American Society of Clinical Oncology. 2015;33:189–194. doi: 10.1200/JCO.2014.55.5789. [DOI] [PMC free article] [PubMed] [Google Scholar]
- Edelman MJ, Watson D, Wang X, Morrison C, Kratzke RA, Jewell S, Hodgson L, Mauer AM, Gajra A, Masters GA, et al. Eicosanoid modulation in advanced lung cancer: cyclooxygenase-2 expression is a positive predictive factor for celeCOXib + chemotherapy–Cancer and Leukemia Group B Trial 30203. Journal of clinical oncology : official journal of the American Society of Clinical Oncology. 2008;26:848–855. doi: 10.1200/JCO.2007.13.8081. [DOI] [PubMed] [Google Scholar]
- Faber AC, Coffee EM, Costa C, Dastur A, Ebi H, Hata AN, Yeo AT, Edelman EJ, Song Y, Tam AT, et al. mTOR inhibition specifically sensitizes colorectal cancers with KRAS or BRAF mutations to BCL-2/BCL-XL inhibition by suppressing MCL-1. Cancer discovery. 2014;4:42–52. doi: 10.1158/2159-8290.CD-13-0315. [DOI] [PMC free article] [PubMed] [Google Scholar]
- Fournier MJ, Gareau C, Mazroui R. The chemotherapeutic agent bortezomib induces the formation of stress granules. Cancer cell international. 2010;10:12. doi: 10.1186/1475-2867-10-12. [DOI] [PMC free article] [PubMed] [Google Scholar]
- Funahashi H, Satake M, Dawson D, Huynh NA, Reber HA, Hines OJ, Eibl G. Delayed progression of pancreatic intraepithelial neoplasia in a conditional Kras(G12D) mouse model by a selective cyclooxygenase-2 inhibitor. Cancer research. 2007;67:7068–7071. doi: 10.1158/0008-5472.CAN-07-0970. [DOI] [PubMed] [Google Scholar]
- Grabocka E, Pylayeva-Gupta Y, Jones MJ, Lubkov V, Yemanaberhan E, Taylor L, Jeng HH, Bar-Sagi D. Wild-type H- and N-Ras promote mutant K-Ras-driven tumorigenesis by modulating the DNA damage response. Cancer cell. 2014b;25:243–256. doi: 10.1016/j.ccr.2014.01.005. [DOI] [PMC free article] [PubMed] [Google Scholar]
- Grana TM, Rusyn EV, Zhou H, Sartor CI, COX AD. Ras mediates radioresistance through both phosphatidylinositol 3-kinase-dependent and Raf-dependent but mitogen-activated protein kinase/extracellular signal-regulated kinase kinase-independent signaling pathways. Cancer research. 2002;62:4142–4150. [PubMed] [Google Scholar]
- Han K, Lee TY, Nikitopoulos DE, Soper SA, Murphy MC. A vertically stacked, polymer, microfluidic point mutation analyzer: rapid high accuracy detection of low-abundance K-ras mutations. Analytical biochemistry. 2011;417:211–219. doi: 10.1016/j.ab.2011.06.030. [DOI] [PMC free article] [PubMed] [Google Scholar]
- Hata AN, Yeo A, Faber AC, Lifshits E, Chen Z, Cheng KA, Walton Z, Sarosiek KA, Letai A, Heist RS, et al. Failure to induce apoptosis via BCL-2 family proteins underlies lack of efficacy of combined MEK and PI3K inhibitors for KRAS-mutant lung cancers. Cancer research. 2014;74:3146–3156. doi: 10.1158/0008-5472.CAN-13-3728. [DOI] [PMC free article] [PubMed] [Google Scholar]
- Hingorani SR, Wang L, Multani AS, Combs C, Deramaudt TB, Hruban RH, Rustgi AK, Chang S, Tuveson DA. Trp53R172H and KrasG12D cooperate to promote chromosomal instability and widely metastatic pancreatic ductal adenocarcinoma in mice. Cancer cell. 2005;7:469–483. doi: 10.1016/j.ccr.2005.04.023. [DOI] [PubMed] [Google Scholar]
- Hoang B, Zhu L, Shi Y, Frost P, Yan H, Sharma S, Sharma S, Goodglick L, Dubinett S, Lichtenstein A. Oncogenic RAS mutations in myeloma cells selectively induce COX-2 expression, which participates in enhanced adhesion to fibronectin and chemoresistance. Blood. 2006;107:4484–4490. doi: 10.1182/blood-2005-09-3926. [DOI] [PMC free article] [PubMed] [Google Scholar]
- Hobor S, Van Emburgh BO, Crowley E, Misale S, Di Nicolantonio F, Bardelli A. TGFalpha and amphiregulin paracrine network promotes resistance to EGFR blockade in colorectal cancer cells. Clinical cancer research : an official journal of the American Association for Cancer Research. 2014;20:6429–6438. doi: 10.1158/1078-0432.CCR-14-0774. [DOI] [PubMed] [Google Scholar]
- Huss D, Benazeraf B, Wallingford A, Filla M, Yang J, Fraser SE, Lansford R. A transgenic quail model that enables dynamic imaging of amniote embryogenesis. Development. 2015;142:2850–2859. doi: 10.1242/dev.121392. [DOI] [PMC free article] [PubMed] [Google Scholar]
- Kaehler C, Isensee J, Hucho T, Lehrach H, Krobitsch S. 5-Fluorouracil affects assembly of stress granules based on RNA incorporation. Nucleic acids research. 2014;42:6436–6447. doi: 10.1093/nar/gku264. [DOI] [PMC free article] [PubMed] [Google Scholar]
- Kedersha N, Anderson P. Mammalian stress granules and processing bodies. Methods in enzymology. 2007;431:61–81. doi: 10.1016/S0076-6879(07)31005-7. [DOI] [PubMed] [Google Scholar]
- Kedersha N, Ivanov P, Anderson P. Stress granules and cell signaling: more than just a passing phase? Trends in biochemical sciences. 2013;38:494–506. doi: 10.1016/j.tibs.2013.07.004. [DOI] [PMC free article] [PubMed] [Google Scholar]
- Kedersha N, Tisdale S, Hickman T, Anderson P. Real-time and quantitative imaging of mammalian stress granules and processing bodies. Methods in enzymology. 2008;448:521–552. doi: 10.1016/S0076-6879(08)02626-8. [DOI] [PubMed] [Google Scholar]
- Kim WJ, Back SH, Kim V, Ryu I, Jang SK. Sequestration of TRAF2 into stress granules interrupts tumor necrosis factor signaling under stress conditions. Molecular and cellular biology. 2005;25:2450–2462. doi: 10.1128/MCB.25.6.2450-2462.2005. [DOI] [PMC free article] [PubMed] [Google Scholar]
- Kim WJ, Kim JH, Jang SK. Anti-inflammatory lipid mediator 15d-PGJ2 inhibits translation through inactivation of eIF4A. The EMBO journal. 2007;26:5020–5032. doi: 10.1038/sj.emboj.7601920. [DOI] [PMC free article] [PubMed] [Google Scholar]
- Kopetz S, Desai J, Chan E, Hecht JR, O’Dwyer PJ, Maru D, Morris V, Janku F, Dasari A, Chung W, et al. Phase II Pilot Study of Vemurafenib in Patients With Metastatic BRAF-Mutated Colorectal Cancer. Journal of clinical oncology : official journal of the American Society of Clinical Oncology. 2015;33:4032–4038. doi: 10.1200/JCO.2015.63.2497. [DOI] [PMC free article] [PubMed] [Google Scholar]
- Luo J, Emanuele MJ, Li D, Creighton CJ, Schlabach MR, Westbrook TF, Wong KK, Elledge SJ. A genome-wide RNAi screen identifies multiple synthetic lethal interactions with the Ras oncogene. Cell. 2009a;137:835–848. doi: 10.1016/j.cell.2009.05.006. [DOI] [PMC free article] [PubMed] [Google Scholar]
- Luo J, Solimini NL, Elledge SJ. Principles of cancer therapy: oncogene and non-oncogene addiction. Cell. 2009b;136:823–837. doi: 10.1016/j.cell.2009.02.024. [DOI] [PMC free article] [PubMed] [Google Scholar]
- McCormick F. KRAS as a Therapeutic Target. Clinical cancer research : an official journal of the American Association for Cancer Research. 2015;21:1797–1801. doi: 10.1158/1078-0432.CCR-14-2662. [DOI] [PMC free article] [PubMed] [Google Scholar]
- Moeller BJ, Cao Y, Li CY, Dewhirst MW. Radiation activates HIF-1 to regulate vascular radiosensitivity in tumors: role of reoxygenation, free radicals, and stress granules. Cancer cell. 2004;5:429–441. doi: 10.1016/s1535-6108(04)00115-1. [DOI] [PubMed] [Google Scholar]
- Molinari F, Felicioni L, Buscarino M, De Dosso S, Buttitta F, Malatesta S, Movilia A, Luoni M, Boldorini R, Alabiso O, et al. Increased detection sensitivity for KRAS mutations enhances the prediction of anti-EGFR monoclonal antibody resistance in metastatic colorectal cancer. Clinical cancer research : an official journal of the American Association for Cancer Research. 2011;17:4901–4914. doi: 10.1158/1078-0432.CCR-10-3137. [DOI] [PubMed] [Google Scholar]
- Nazarian R, Shi H, Wang Q, Kong X, Koya RC, Lee H, Chen Z, Lee MK, Attar N, Sazegar H, et al. Melanomas acquire resistance to BRAF(V600E) inhibition by RTK or N-RAS upregulation. Nature. 2010;468:973–977. doi: 10.1038/nature09626. [DOI] [PMC free article] [PubMed] [Google Scholar]
- Pazarentzos E, Bivona TG. Adaptive stress signaling in targeted cancer therapy resistance. Oncogene. 2015;34:5599–5606. doi: 10.1038/onc.2015.26. [DOI] [PMC free article] [PubMed] [Google Scholar]
- Perez K, Walsh R, Brilliant K, Noble L, Yakirevich E, Breese V, Jackson C, Chatterjee D, Pricolo V, Roth L, et al. Heterogeneity of colorectal cancer (CRC) in reference to KRAS proto-oncogene utilizing WAVE technology. Experimental and molecular pathology. 2013;95:74–82. doi: 10.1016/j.yexmp.2013.01.004. [DOI] [PMC free article] [PubMed] [Google Scholar]
- Pham H, Eibl G, Vincenti R, Chong B, Tai HH, Slice LW. 15-Hydroxyprostaglandin dehydrogenase suppresses K-RasV12-dependent tumor formation in Nu/Nu mice. Molecular carcinogenesis. 2008;47:466–477. doi: 10.1002/mc.20404. [DOI] [PubMed] [Google Scholar]
- Poulikakos PI, Persaud Y, Janakiraman M, Kong X, Ng C, Moriceau G, Shi H, Atefi M, Titz B, Gabay MT, et al. RAF inhibitor resistance is mediated by dimerization of aberrantly spliced BRAF(V600E) Nature. 2011;480:387–390. doi: 10.1038/nature10662. [DOI] [PMC free article] [PubMed] [Google Scholar]
- Richman SD, Chambers P, Seymour MT, Daly C, Grant S, Hemmings G, Quirke P. Intra-tumoral heterogeneity of KRAS and BRAF mutation status in patients with advanced colorectal cancer (aCRC) and cost-effectiveness of multiple sample testing. Analytical cellular pathology. 2011;34:61–66. doi: 10.3233/ACP-2011-0005. [DOI] [PMC free article] [PubMed] [Google Scholar]
- Rosell R, Gonzalez-Larriba JL, Alberola V, Molina F, Monzo M, Benito D, Perez JM, de Anta JM. Single-agent paclitaxel by 3-hour infusion in the treatment of non-small cell lung cancer: links between p53 and K-ras gene status and chemosensitivity. Seminars in oncology. 1995;22:12–18. [PubMed] [Google Scholar]
- Sheng H, Shao J, Dubois RN. K-Ras-mediated increase in cyclooxygenase 2 mRNA stability involves activation of the protein kinase B1. Cancer research. 2001;61:2670–2675. [PubMed] [Google Scholar]
- Sheng H, Williams CS, Shao J, Liang P, DuBois RN, Beauchamp RD. Induction of cyclooxygenase-2 by activated Ha-ras oncogene in Rat-1 fibroblasts and the role of mitogen-activated protein kinase pathway. The Journal of biological chemistry. 1998;273:22120–22127. doi: 10.1074/jbc.273.34.22120. [DOI] [PubMed] [Google Scholar]
- Shirasawa S, Furuse M, Yokoyama N, Sasazuki T. Altered growth of human colon cancer cell lines disrupted at activated Ki-ras. Science. 1993;260:85–88. doi: 10.1126/science.8465203. [DOI] [PubMed] [Google Scholar]
- Silvera D, Formenti SC, Schneider RJ. Translational control in cancer. Nature reviews Cancer. 2010;10:254–266. doi: 10.1038/nrc2824. [DOI] [PubMed] [Google Scholar]
- Solimini NL, Luo J, Elledge SJ. Non-oncogene addiction and the stress phenotype of cancer cells. Cell. 2007;130:986–988. doi: 10.1016/j.cell.2007.09.007. [DOI] [PubMed] [Google Scholar]
- Stephen AG, Esposito D, Bagni RK, McCormick F. Dragging ras back in the ring. Cancer cell. 2014;25:272–281. doi: 10.1016/j.ccr.2014.02.017. [DOI] [PubMed] [Google Scholar]
- Wang L, Chen W, Xie X, He Y, Bai X. CeleCOXib inhibits tumor growth and angiogenesis in an orthotopic implantation tumor model of human colon cancer. Experimental oncology. 2008;30:42–51. [PubMed] [Google Scholar]
- Wang Z, Li Y, Ahmad A, Banerjee S, Azmi AS, Kong D, Sarkar FH. Pancreatic cancer: understanding and overcoming chemoresistance. Nature reviews Gastroenterology & hepatology. 2011;8:27–33. doi: 10.1038/nrgastro.2010.188. [DOI] [PubMed] [Google Scholar]
- Wippich F, Bodenmiller B, Trajkovska MG, Wanka S, Aebersold R, Pelkmans L. Dual specificity kinase DYRK3 couples stress granule condensation/dissolution to mTORC1 signaling. Cell. 2013;152:791–805. doi: 10.1016/j.cell.2013.01.033. [DOI] [PubMed] [Google Scholar]
- Zhu J, Sanborn JZ, Benz S, Szeto C, Hsu F, Kuhn RM, Karolchik D, Archie J, Lenburg ME, Esserman LJ, et al. The UCSC cancer genomics browser. Nature methods. 2009;6:239–240. doi: 10.1038/nmeth0409-239. [DOI] [PMC free article] [PubMed] [Google Scholar]
- Zuber J, Tchernitsa OI, Hinzmann B, Schmitz AC, Grips M, Hellriegel M, Sers C, Rosenthal A, Schafer R. A genome-wide survey of RAS transformation targets. Nature genetics. 2000;24:144–152. doi: 10.1038/72799. [DOI] [PubMed] [Google Scholar]
Associated Data
This section collects any data citations, data availability statements, or supplementary materials included in this article.
Supplementary Materials
(A) Top-Whole cell lysates (WCL) from AsPC1, MiaPaCa-2, and Panc-1 cells expressing inducible scramble (Scr) or KRAS shRNA were subjected to immunoblotting with the indicated antibodies. Tubulin serves as a loading control. Blots are representative of at least 3 independent experiments. Bottom-AsPC-1, MiaPaCa-2, and Panc-1 cells expressing inducible scramble (Scr) or KRAS shRNA were treated with SA. SG index based on G3BP immunofluorescence is shown.
(B) SG index in DLD1 Mut and DLD1 KO cells treated with SA (100 μM, 1hr). based on eIF4G immunofluorescence.
C) Hela Tet-ON cells (HTO) and HTO cells that conditionally express mutant KRAS (HTO-KRASV12) were treated with SA (100 μM, 30 min). SG size distribution (left, each dot represents one SG; ●, HTO-KRASV12, ●, HTO) and average number of SGs/SG-positive cell (right) were determined based on G3BP immunofluorescence.
D) HTO-KRASV12 treated −/+ PD0325901 (1uM, 20 hrs) were subjected to SA (100 μM, 1hr). SG index was determined based on G3BP immunofluorescence.
(E–F) DLD1 Mut and DLD1 KO cells were treated with 100 μM sodium arsenate (E) or UV-C (50 mJ/m2) (F). SG index was determined at the indicated time points based on G3BP immunofluorescence.
Data are from a representative experiment out of least 3 independent experiments. Error bars indicate mean −/+ SEM for at least 4 fields of view with at least 50 cells/field of view. **p<0.01, ***p < 0.001, ****p<0.0001.
(A) Sections from two independent human PDAC tissues were immunostained for G3BP and PABP1.
(B) Sections from subcutaneous xenograft tumors of KRAS Mut (PL45, DLD1) and KRAS WT (BxPC-3) cells were immunostained for G3BP and CK8 (epithelial marker). Scale bar 10 μm. Images are representative from 3 animals/cohort. High magnification of boxed areas (3× zoom-in) are shown on the right.
(A) DLD1 Mut cells were treated with SA as in Figure 3A and SGs were detected by immunofluorescence staining for PABP1 and eIF5.
(B) Untreated DLD1 Mut and DLD1 KO cells were immunostained for G3BP (control corresponding to Figure 3C).
(C) DLD1 Mut and DLD1 KO cells were treated with PGE2 (50 μM, 1hr) and immunostained for G3BP.
(D) COX-2 and HPGD mRNA levels in PL45 cells expressing scramble (Scr) and KRAS shRNA were assessed by quantitative RT-PCR. Error bars indicate SEM (n=3).
(E) Levels of COX-2 in Pei pancreatic carcinoma (top) cohorts and the levels of HPGD in Ishikawa pancreatic carcinoma (bottom) cohorts vs. normal pancreas. (Oncomine). Error bars indicate SD.
(F) Level 3 Pan-cancer normalized Illumina HiSeq V2 TCGA LUAD mRNA data -and corresponding clinical data were downloaded from the UCSC Cancer Browser (https://genome-cancer.ucsc.edu). Samples were filtered for those fulfilling the following criteria: primary tumor, KRAS mutational profiling results, tobacco smoking history known, Current smoker and Current reformed smoker for < or = 15 years, for a total of 24 tumors (n= 11 KRAS Mut, n= 13 KRAS WT). The lines indicate the mean.
(G) DLD1 Mut cells were treated as in Figure 3F. SG index based on eIF4G immunofluorescence is shown.
(H) DLD1 Mut and DLD1 KO cells were treated as in Figure 3H. SG index based on eIF4G immunofluorescence is shown.
(C, G–H) Data are from a representative experiment out of least 3 independent experiments. Error bars indicate mean −/+ SEM for at least 4 fields of view with at least 50 cells/field of view. ** p < 0.05, ****p<0.0005.
The levels of 15-d-PGJ2 that were secreted by MiaPaCa-2 and AsPC-1 cells expressing inducible scramble (Scr) or KRAS shRNA were determined by ELISA of the respective cell culture medium. Data are represented as mean −/+ SEM. ** p < 0.05.
(A–B) HTO-KRASV12 and HTO cells were treated with SA (100 μM, 1hr) in the presence or absence of emetine (40 μg/ml). (A) SGs were detected by G3BP immunofluorescence staining. (B) Cell death was assessed by analysis of NucView Alexa 405 positive cells from least 4 fields of view with at least 50 cells/field of view. Scale bar 10 μm. Error bars indicate SEM (n=3). **p<0.05, ***p<0.005.
(C) mCherry-H2B-labeled NCI-H508 cells cultured alone or co-cultured with DLD1 Mut cells were treated with oxaliplatin as in Figure 5D–E. SGs were detected by G3BP immunofluorescence staining. Scale bar 10 μm.
(D) SG index in NCI-H508 cells cultured alone, NCI-H508 cells co-cultured with DLD1 Mut cells, and DLD1 Mut cells alone treated as in A. SG index based on G3BP immunofluorescence is shown. Data are from a representative experiment out of least 3 independent experiments. Error bars indicate mean −/+ SEM for at least 4 fields of view with at least 50 cells/field of view. ****p<0.0001.
Level 3 Pan-cancer normalized Illumina HiSeq V2 COAD mRNA data and corresponding clinical data were downloaded from the UCSC Cancer Browser (https://genome-cancer.ucsc.edu). Samples were filtered for those fulfilling the following criteria: primary tumor and KRAS mutational profiling results, for a total of 48 tumors (n= 23 KRAS Mut, n= 25 KRAS WT). Patients in each cohort (ie. KRAS Mut and WT) were then stratified by PTGS2 tumor expression, into high (top third) and low (bottom third) expression cohorts. Recurrence free survival was plotted using the Kaplan-Meier method and survival curves were compared by Log-rank (Mantel-Cox) tests.