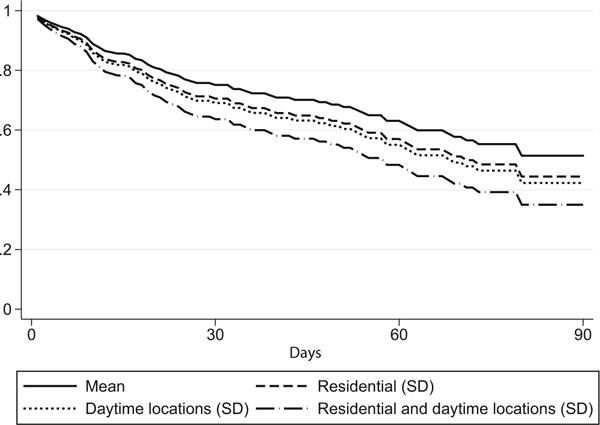
Fig. 3.

Survival curves by job accessibility, holding other factors constant at their means or at their modal value. “Mean” survival curve is based on job accessibility measures for residential and daytime locations at their means and the following sample characteristics: mean age, black, high school graduate/GED, single, one child, mean social support scale, mean self-reported health, mean length of recent incarceration, formal labor market job pre-incarceration, mean age at first incarceration, mean convictions pre-incarceration, one incarceration pre-incarceration, and at least one felony conviction pre-incarceration. “Residential (SD)” curve is based on the above characteristics but the job accessibility measure based on residence is one standard deviation higher than the mean. “Daytime locations (SD)” is based on the above characteristics but the job accessibility measure based on GPS estimates is one standard deviation higher than the mean. “Residential and daytime locations (SD)” is based on the above, with one standard deviation higher than the mean for accessibility measures based on both residence and daytime locations
