Significance
Cellular compartments are specialized for particular functions. In astrocytes, the peripheral, perisynaptic processes contain proteins specialized for reuptake of neurotransmitters and ions, and have been shown to alter their morphology in response to activity. Regulated transport of a specific subset of nuclear-derived mRNAs to specific compartments is thought to support the specialization of these compartments and allow for local regulation of translation. In neurons, local translation near activated synapses is thought to generate the proteins needed for the synaptic alterations that constitute memory. We demonstrate that astrocytes also have sequence-dependent local translation in their peripheral processes, including transcripts with roles in regulating synapses, and identify one mechanism regulating this translation. These findings suggest local translation in astrocyte processes may play a role in synapse modulation.
Keywords: astrocyte, local translation, synapse, TRAP, RNA-sequencing
Abstract
Local translation in neuronal processes is key to the alteration of synaptic strength necessary for long-term potentiation, learning, and memory. Here, we present evidence that regulated de novo protein synthesis occurs within distal, perisynaptic astrocyte processes. Astrocyte ribosomal proteins are found adjacent to synapses in vivo, and immunofluorescent detection of peptide elongation in acute slices demonstrates robust translation in distal processes. We have also developed a biochemical approach to define candidate transcripts that are locally translated in astrocyte processes. Computational analyses indicate that astrocyte-localized translation is both sequence-dependent and enriched for particular biological functions, such as fatty acid synthesis, and for pathways consistent with known roles for astrocyte processes, such as GABA and glutamate metabolism. These transcripts also include glial regulators of synaptic refinement, such as Sparc. Finally, the transcripts contain a disproportionate amount of a binding motif for the quaking RNA binding protein, a sequence we show can significantly regulate mRNA localization and translation in the astrocytes. Overall, our observations raise the possibility that local production of astrocyte proteins may support microscale alterations of adjacent synapses.
Astrocytes are required for the proper development and maintenance of the synapse, a structure described as tripartite because of the critical contribution from peripheral processes of these cells (1). There is evidence that astrocytes determine synapse number (2, 3) and strength (4, 5), and reciprocally, that neurons mediate maturation of astrocyte processes (6), yet our mechanistic understanding of these interactions is incomplete.
The localized synthesis of proteins in neurons is instrumental for synaptic modulation (7) and neurite outgrowth (8, 9). Because neurites must extend great distances to reach a target cell, they have the ability to harbor mRNAs and ribosomes proximal to spines and axons (10, 11), where local translation occurs in a precise spatial, temporal, and activity-dependent manner. Similarly, oligodendrocytes also selectively localize some myelin-associated mRNAs for local translation within their ensheathing processes (12). Outside of the nervous system, localized protein synthesis occurs in a variety of biological systems, including Drosophila oocytes and migrating fibroblasts, suggesting that this phenomenon is a widely used regulatory system (13, 14).
Peripheral astrocyte processes (PAPs) reach lengths comparable to some neurites, and one astrocyte territory can contact up to 100,000 synapses (15). Furthermore, the dynamic nature of PAPs at synapses requires rapid responsiveness to synaptic changes (5, 16). Therefore, we hypothesized that astrocytes also use local translation. We reasoned that several conditions must be met to establish that local translation occurs in astrocytes: First, both ribosomes and mRNA must be present in PAPs. Second, new protein translation must occur in PAPs. Finally, even if protein synthesis is detected, it is only of substantial interest if it is regulated. Specifically, if local translation in astrocytes exists to support either local adaptation or specialization of function, as it does in other cells, then it should be biased toward specific transcripts, and these transcripts should contain specific sequence features. Herein, we provide biochemical and imaging evidence for these criteria and define the peripheral translatome of the astrocyte.
Astrocyte Ribosomes and mRNA Exist in Their Peripheral Processes, in Vivo
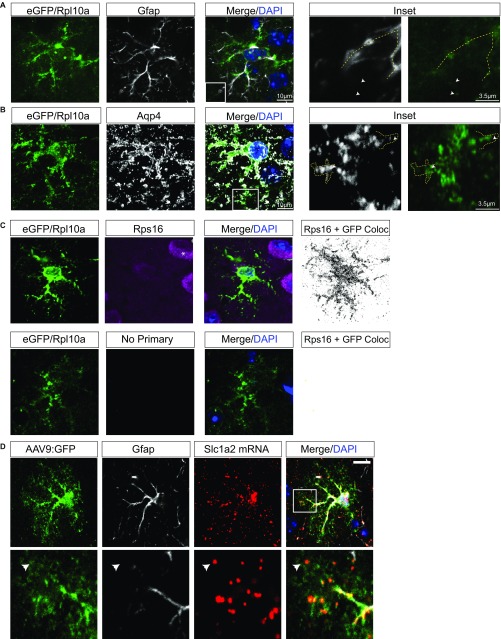
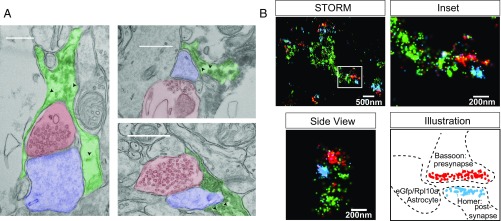
Although previous work using electron microscopy (EM) (17) has suggested that ribosome-like structures exist in PAPs, their identity has never been confirmed. We used transgenic mice, where ribosomal protein RPL10A is fused with EGFP specifically within astrocytes (Aldh1L1-EGFP/RPL10A), to localize the large subunit of ribosomes (18). Using in vivo immunofluorescence (IF) in cortical astrocytes, we found that EGFP/RPL10A extends beyond GFAP+ processes and into peripheral processes surrounded by Aqp4, which marks astrocyte membranes and vascular endfeet (19) (Fig. S1 A and B). We then asked if we could detect tagged ribosomes in perisynaptic PAPs using both immuno-EM and a recently developed approach leveraging stochastic optical reconstruction microscopy (STORM), allowing for ultrastructural-level resolution compatible with multicolor fluorescent labeling (20). Astrocyte EGFP/RPL10A was found surrounding synapses via EM (Fig. 1A) and within 100 nm of synapses, which are defined by apposition of pre- and postsynaptic markers via STORM (Fig. 1B). Because translation requires both large and small subunits, we confirmed peripheral localization of endogenous small ribosomal subunits via RPS16 IF (Fig. S1C), indicating the tagged RPL10A is not mislocalized in the Aldh1L1-EGFP/RPL10A mice. Together, these data provide strong evidence that astrocyte ribosomes are present near cortical synapses.
Fig. S1.
Subcellular localization in cortical astrocytes shows ribosomal proteins and mRNA in peripheral processes. (A and B) Confocal IF of a cortical astrocyte, stained with Gfap (A) or Aqp4 (B) (white). EGFP/RPL10A (green) shows ribosomal tag extending throughout astrocyte, past Gfap+ processes (yellow dashed line) and within fine processes highlighted by Aqp4. Arrowheads in A indicate presence of eGFP-tagged ribosomes beyond GFAP-labeled processes. (Scale bar, 10 μm.) (C) Examination of localization of Rps16 by confocal reveals detectable Rps16 (violet/white) in fine processes. Rps16 is also found robustly in adjacent neurons, as expected (*). Therefore, the presence of GFP signal was used to mask all nonastrocyte pixels, and a binary image created showing GFP+ pixels that also contained Rps16 signal. This approach allows for identification of Rps16 labeling specifically in the astrocyte even in the presence of Rps16-labeling in adjacent cells. A tissue section processed in parallel, but omitting Rps16 primary antibody, demonstrates absence of signal in the astrocyte. (Scale bar, 10 μm.) (D) Confocal IF of a GFP-labeled astrocyte (Fig. S2) shows extension of Slc1a2 (red) FISH into fine, Gfap− (white) peripheral processes. Arrowheads in D indicate colocalization of mRNA and GFP in distal PAPs. (Magnification, 100 ×.)
Fig. 1.
EM and STORM show astrocyte ribosomes in close proximity to synapses, in vivo. (A) Representative electron micrographs of DAB-labeled EGFP/RPL10A (arrowheads) in astrocyte processes (green) near cortical synapses (axon = blue and postsynaptic density = red). (Scale bars, 500 nm.) (B) STORM imaging showing an EGFP/RPL10A (green) filled astrocyte process proximal to synapses [as illustrated, these are defined by apposition of Bassoon (red) and Homer (blue)]. Inset of box on Left, and side view is a 90° rotation of a second synapses, again showing EGFP/RPL10A puncta surrounding a synapse.
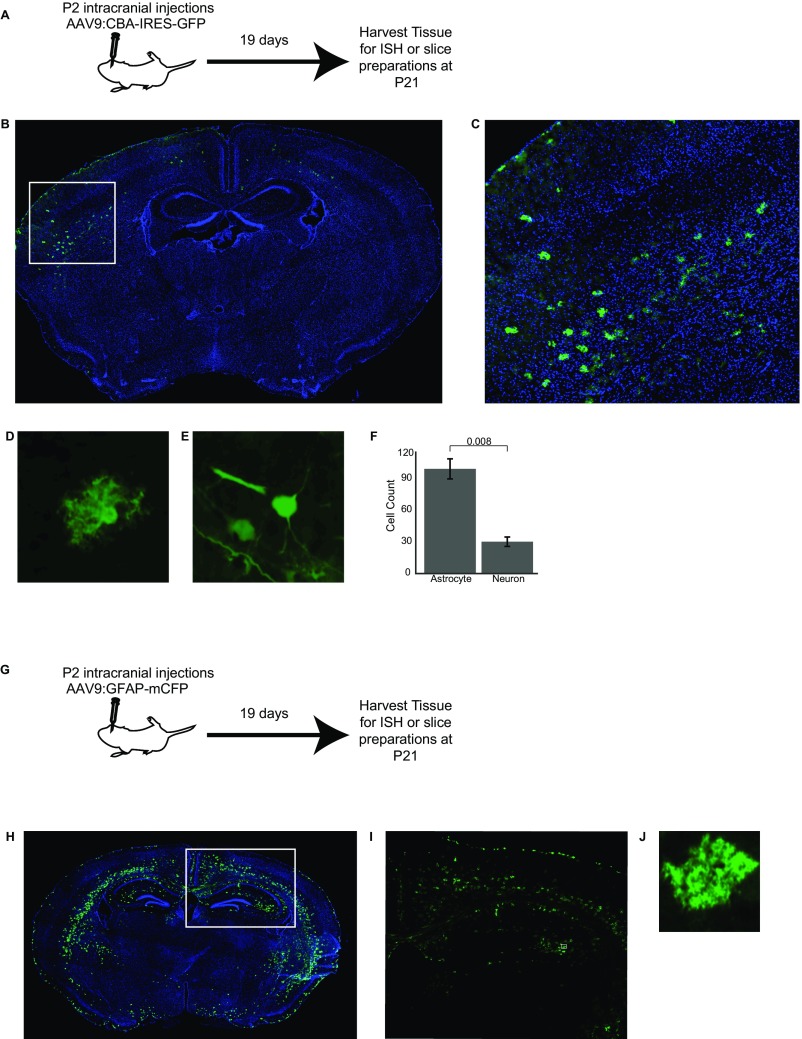
We next sought to confirm the presence of mRNA within PAPs. We chose to focus on the localization of Slc1a2 (GLT-1) for two reasons: first, GLT-1 protein is highly expressed in PAPs (21) and second, previous colorimetric in situ hybridization suggested its peripheral localization (22). Because conventional immunolabeling methods did not allow us to distinguish the peripheral processes of neighboring astrocytes from one another, we developed a viral method to sparsely GFP-label astrocytes in nontransgenic mice (Fig. S2). Using this approach, we confirmed that Slc1a2 mRNA is found throughout the astrocyte, including in distal GFAP− PAPs (Fig. S1D).
Fig. S2.
Viral sparse astrocyte labeling. (A) P2 mice are injected intracranially with AAV9:CBA-IRES-GFP virus (titer 1012) and then returned to the dam until being killed at P21. (B) Sample coronal slice showing GFP virus (green), DAPI (blue). (C) Inset of B, demonstrating the region where only astrocytes are labeled in a sparse manner. (D) Representative filled astrocyte. (E) Representative filled neuron. (F) Quantification of GFP-filled astrocytes and neurons across two mice and three slices; P value shown is the result of a two-sided t test. (G) P2 mice are injected intracranially with AAV9-GFAP-mCFP virus (titer 1012) and then returned to the dam until being killed at P21. (H) Sample coronal slice showing mCFP virus (green), DAPI (blue). (I) Inset of H. (J) Representative filled astrocyte. (Magnification, B, C, H, and I, 10 ×; D, E, and J, 20 ×.)
Astrocyte Processes Synthesize Proteins in Their Distal Tips
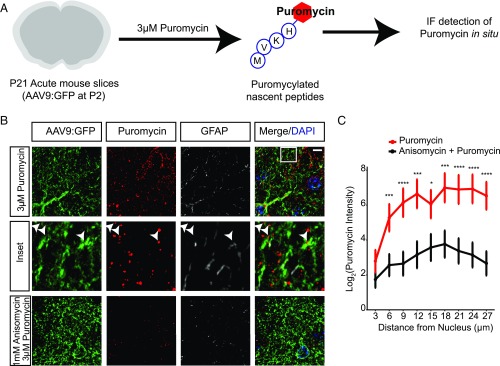
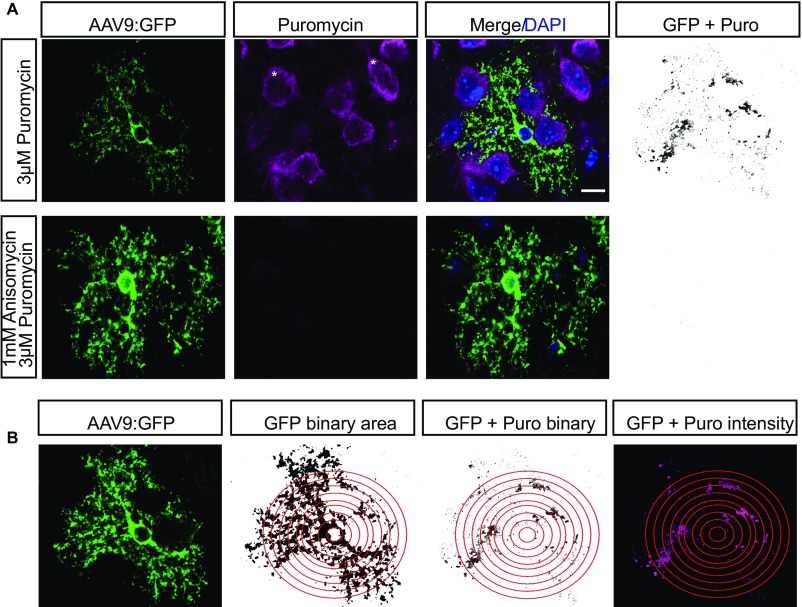
After demonstrating the presence of both ribosomes and mRNA in PAPs, we next tested whether distal translation occurs by using puromycin to label actively translating peptides in acute brain slices (Fig. 2A). Puromycin, a tRNA-structural analog, incorporates into translating ribosomes and puromycylates the growing peptide (23). Using an antibody against puromycin for IF in sparsely labeled astrocytes (Fig. 2A and Fig. S3A), we detected nascent translation within PAPs, which was blocked by pretreatment with the translation inhibitor, anisomycin, indicating that puromycin labeling requires active translation (Fig. 2B). We quantified the total translation occurring throughout the astrocyte by measuring the fluorescence intensity of puromycin within GFP and puromycin double-positive puncta at increasing radii from the nucleus of the astrocyte. We empirically determined that a 27-μm radius captures the majority of the astrocyte, without extending into neighboring astrocyte territories (Fig. S3B), consistent with previous data describing a mean murine astrocyte diameter of 56 μm (15). Given the short duration of incubation, we concluded that puromycylated peptides in PAPs were made locally rather than transported. Quantification of puromycylation in astrocytes indicates that on average 73% of translation in an astrocyte occurs >9 μm from the nucleus center (Fig. 2C), and does not taper significantly as it extends to the periphery.
Fig. 2.
Peripheral ribosomes are actively translating in astrocytes. (A) Cartoon diagram of puromycylation experiments. Acute slices (cartooned in gray) are incubated with puromycin (red hexagon) which attaches to the growing peptide (cartooned by amino acid abbreviations in circles). Slices are then prepared for IF detection of puromycin. (B) Maximum projection superresolution SIM to detect puromycylation (red) of synthesizing proteins in a GFP-labeled astrocyte shows translation occurs in peripheral processes, and is blocked by pretreatment with anisomycin. Arrowheads indicate puromycylated peptides colocalized with GFP-positive peripheral astrocyte processes. (Scale bar, 10 μm.) (Magnification, 100 ×.) (C) Quantification of puromycin intensity (only puromycin pixels that were in astrocytes labeled with GFP were measured) at increasing radii from the nucleus indicates robust translation occurs in PAPs. Repeated-measures ANOVA revealed main effects of condition F(2, 138) = 9.694, P = 0.0001 and distance F(8, 1,104) = 19.023, P < 2E-16 with a significant interaction between condition and distance F(16, 1,104) = 2.019, P = 0.01. Data represented as mean ± SEM. Asterisks represent one-sided t tests, post hoc. ****P < 0.001, ***P < 0.005, *P < 0.05. n (cells) = 54 (puromycin), 48 (anisomycin+puromycin).
Fig. S3.
Puromycylation detection and quantification method. (A) Example of masking for quantification of peripheral puromycylation (confocal IF). As expected, robust translation also occurs in adjacent neurons (*). Therefore, the presence of GFP signal was used to mask all nonastrocyte pixels, and a binary image created showing GFP+ pixels that also contained Puro-IF signal (GFP+Puro) for all downstream quantification. (B) Illustration of method for quantification of relative amount of translation at increasing distance from the astrocyte nucleus. A nucleus of a GFP+ astrocyte is selected and thresholded (Center Left). A series of Sholl-like concentric rings are demarked for quantification (red rings). All Puro-IF outside of GFP+ area is masked, and Puro-IF+ area within each ring is measured (Center Right). Intensity of Puro-IF within each GFP+ pixel is also measured (Right). (Scale bar, 20 μm.)
PAP-Translating Ribosome Affinity Purification Reveals Hundreds of Enriched Ribosome-Bound Transcripts in PAPs
In neurons, local translation appears to be enriched for certain transcripts, often those generating proteins with synaptic roles. If translation in PAPs does indeed have a physiological role, then a specific subset of astrocyte transcripts should show enriched translation there. We hypothesized that local translation is sequence-dependent, and furthermore will be enriched for transcripts consistent with the known roles of the PAP (e.g., glutamate homeostasis).
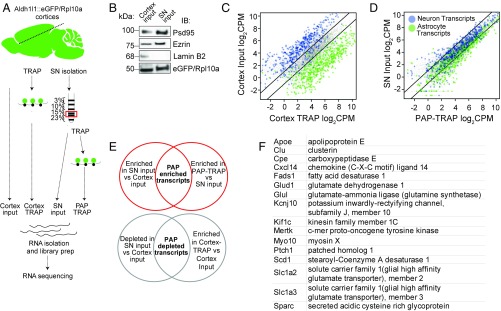
To test this hypothesis, we developed a method to capture ribosome-bound mRNA from PAPs using translating ribosome affinity purification (PAP-TRAP) (Fig. 3A). Synaptoneurosomes (SNs) are translation-competent membrane-enclosed appositions of pre- and postsynaptic specializations that can be purified from brain homogenates by density fractionation. Although the neuronal contents of SN fractions have been well-described, a preliminary RNA-sequencing of the total SN fraction suggested substantial contribution of mRNAs from nonneuronal cells. This finding is in agreement with a prior RT-PCR observation of an astrocyte transcript in SNs (24). Furthermore, immunoblot confirmed SN fractions contain Ezrin, a constituent of PAPs (25), and astrocytic EGFP/RPL10A, as well as the expected enrichment of PSD95 and depletion of nuclear Lamin B2 (Fig. 3B). Therefore, to define the RNAs being translated by astrocytes in the SN, we isolated astrocyte-tagged ribosome-bound RNA from the fraction (Fig. S4), and performed RNA-seq on the PAP-TRAP sample and three-comparison samples (Dataset S1).
Fig. 3.
Identification of peripherally enriched transcripts. (A) Diagram of experimental steps in PAP-TRAP and comparison samples for RNA-seq. (B) Representative immunoblots for input and SN fraction confirms enrichment of synaptic and PAP proteins, depletion of nuclear proteins (LaminB2), and presence of EGFP/RPL10A. (C and D) cpm plots of astrocyte and neuron transcripts after TRAP from the cortex (C) or from the SN fraction (D). Lines denote twofold enrichment/depletion. We detect robust enrichment for sets of ∼200 previously detected (60) astrocyte-enriched transcripts (green dots), and substantial, although not complete, depletion of ∼200 previously detected (60) neuron-enriched transcripts (blue dots) in the current cortex-TRAP experiment. This degree of enrichment and depletion is typical for TRAP (61, 62). (E) Diagram of analytical strategy for defining PAP-enriched/depleted transcripts. (F) Examples of PAP-enriched transcripts, including those related to glutamate metabolism (Slc1a2, Slc1a3, Glul), fatty acid synthesis (Fads, Scd), and interesting signaling molecules (Ptch1, Sparc, Ntsr2).
Fig. S4.
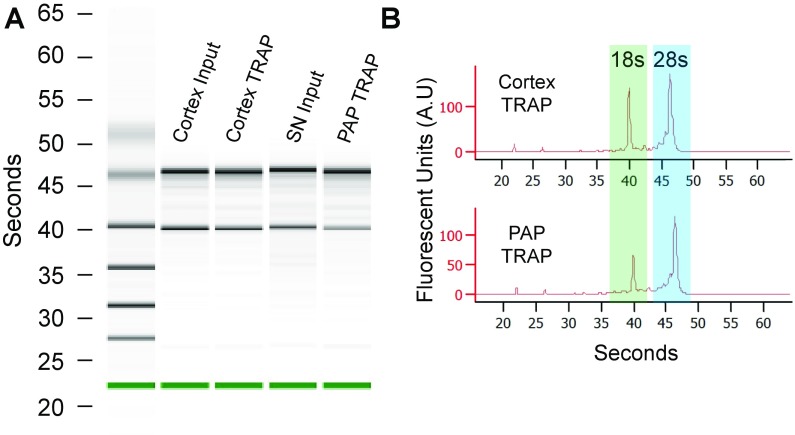
Bioanalyzer confirms RNA quality from cortex-TRAP and PAP-TRAP samples. (A) PicoChip electrophoresis for representative samples, marker is highlighted in green. (B) Fluorescent trace visualization of PicoChip electrophoresis for cortex-TRAP and PAP-TRAP. Ribosomal RNAs from both subunits are captured.
We next leveraged these data to identify those transcripts with enriched ribosome occupancy in the PAP. Because all RNAs must move from the nucleus through the soma to arrive in PAPs, we did not expect to find transcripts that are only found in PAPs and not in the soma. Rather, we used an intersection of two comparisons to derive a stringent list of PAP translated candidates. First, we compared SN RNA-seq to cortex-input RNA-seq to enrich for transcripts localized to the fraction. This, by itself, would identify putatively localized transcripts, but would contain transcripts from many cell types. Thus, we intersected this set with those transcripts enriched on astrocyte ribosomes in the SN (PAP-TRAP/SN). This combined analysis identified 224 transcripts that are significantly enriched on PAP ribosomes (Fig. 3 C–E and Dataset S2), including Slc1a2.
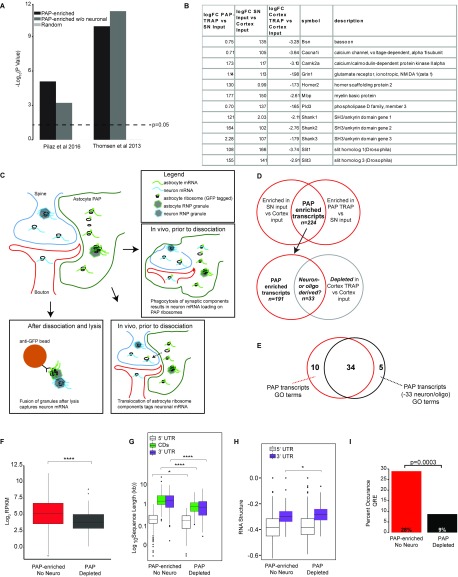
We also tested a direct statistical comparison of PAP-TRAP to TRAP samples as an alternative method of defining locally translated astrocyte transcripts. Whereas the resulting analysis included all 224 discovered transcripts above, it also included several clearly spurious transcripts (e.g., mitochondrial transcripts not translated on the eukaryotic ribosome) that are most clearly attributable to a difference in background levels of contaminating RNA between TRAP and PAP-TRAP. We found that although PAP-TRAP still enriches for known astrocyte transcripts relative to SN samples, there is a blunting of both enrichment of known astrocyte markers and depletion of neuronal markers relative to a control cortex TRAP (Fig. 3 C and D). Although we are interested in further optimizing PAP-TRAP to reduce this background, and thus increase sensitivity to define additional transcripts, our current intersectional analysis appears robust. The analysis includes several canonical astrocyte markers (Fig. 3F), and overlaps with both mRNA detected in astrocyte processes in vitro (26) and those just reported for radial glia in vivo (27) (Fig. S5A). Thus, we proceeded with analysis of the 224 high-confidence transcripts.
Fig. S5.
A small number of neuronal transcripts are bound to peripheral astrocyte ribosomes: in vitro or in vivo mechanism? (A) Overlaps of PAP-TRAP–enriched transcripts with two studies demonstrating selective enrichment of certain mRNAs in astrocyte processes. P values are the result of one-sided Fisher’s exact tests. Random gene lists were selected by randomly picking 200 genes from all counted in the cortex-input samples. (B) From PAP-TRAP–enriched transcripts, shown are examples of many transcripts that are strong candidates to be locally translated in neurons (Camk2a, Shanks), or are known to be locally translated in oligodendrocytes (e.g., Mbp) (66). (C) Illustrations of some of the possible alternate models for these unexpected results. (Left) Interactions in solution between RNA granules originally from neurons with captured granules from astrocytes in vitro, mediated by the disordered nature of domains in many RBPs (67). (Right) Low-level exchange of mRNA or ribosomal components between adjacent processes, or perhaps following astrocyte phagocytosis of synapses (29), in vivo. Regardless, if needed, this 15% can be removed from the PAP-enriched list computationally (provided as Dataset S4), and all of the major conclusions regarding the remaining PAP-enriched genes are still supported. (D) Roughly 15% of PAP-enriched transcripts from Dataset S2, which show clear enrichment by PAP-TRAP, are depleted when examining the cortex-TRAP vs. -input comparison, suggesting they are not present on most astrocyte ribosomes in the cell body, as illustrated by a Venn diagram. (E) 77% of the original PAP GO terms survive at Benjamini–Hochberg-corrected P < 0.005. (F) Quantification of expression of PAP-enriched and PAP-depleted transcripts indicates PAP-depleted transcripts have lower median expression in cortical astrocytes (Wilcoxon test, Benjamini–Hochberg-corrected, *P < 0.0001). (G) Quantification of length of PAP-enriched and depleted transcripts indicates PAP-enriched transcripts are longer (Wilcoxon test, Benjamini–Hochberg-corrected, ****P < 0.0001, *P < 0.05). (H) RNA structure-score (minimum free-energy of most stable predicted structure, normalized to length), indicates PAP-enriched transcripts have more stable 3′UTR secondary structures (Wilcoxon test, Benjamini–Hochberg-corrected, *P < 0.05, lower values are more stable). (I) PAP-TRAP candidates without neuronal-derived transcripts are still significantly enriched for the presence of a QRE, as expected because neurons do not express Qk (43).
For computational analyses, we also generated a contrasting set of transcripts depleted from the PAP using a reciprocal approach: we intersected the transcripts depleted from the SN relative to cortex input, but still enriched on astrocytes ribosomes by TRAP. We identified 116 astrocyte transcripts (“PAP-depleted” transcripts) (Fig. 3E and Dataset S3).
PAP-Enriched Transcripts Suggest Physiological Roles for Local Translation, Including Modulation of Neurotransmitter Metabolism
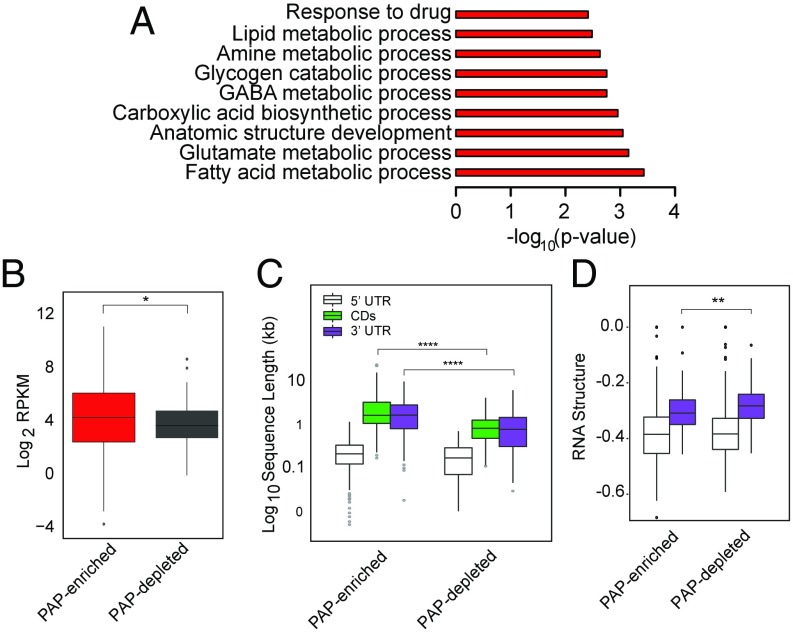
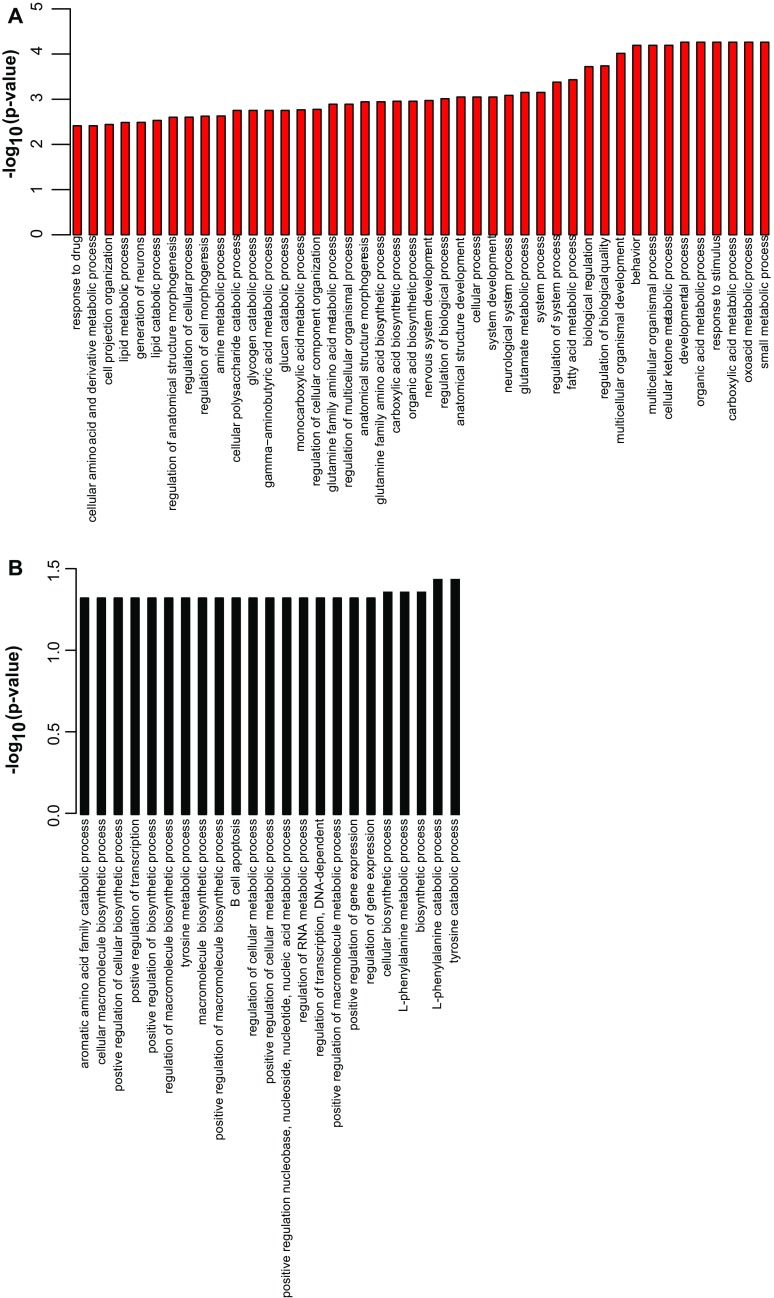
To provide a systems perspective as to functions local translation might serve in astrocytes, we performed pathway analyses on the PAP-enriched transcripts (Fig. 4A and Fig. S6A). We found that PAP-localized transcripts had overrepresentation of genes mediating glutamate and GABA metabolism, consistent with PAP functions of glutamate transport (Slc1a2, Slc1a3) (21, 28) and metabolism (Glul). We also identified a set of enzymes representing multiple steps in a pathway for biosynthesis of unsaturated fatty acids (Scd1, Scd2, Fads1, Fads2, Elovl5, Hadha), suggesting a novel hypothesis that there may be some local regulation of fatty acid production either for signaling or expansion of local membrane. We also identified several motor and cytoskeletal proteins (e.g., Kif1c, Myo1D), local translation of which could play a role in morphological remodeling of astrocyte processes. Finally, we also noticed an enrichment for genes and members of gene families known to regulate synapse number (Mertk, Sparc, Thbs4) (29–31), suggesting that synapse formation and elimination may be mediated in part by local translation of cues from adjacent astrocytes. In contrast, PAP-depleted transcripts have largely nonoverlapping Gene Ontology (GO) categories with PAP-enriched transcripts, and are enriched for transcription regulators and amino acid catabolism (Fig. S6B).
Fig. 4.
Pathway and sequence analysis on PAP-enriched transcripts. (A) Representative significant GO terms for PAP-enriched transcripts, hypergeometric test with Benjamini–Hochberg correction. (B) Quantification of expression of PAP-enriched vs. -depleted transcripts indicates PAP-depleted transcripts have lower median expression in cortical astrocytes (Wilcoxon test, Benjamini–Hochberg-corrected, *P < 0.05). (C) Quantification of length of PAP-enriched and depleted transcripts indicates PAP-enriched transcripts have longer 3′UTRs (Wilcoxon test, Benjamini–Hochberg-corrected, ****P < 0.0001). (D) RNA structure-score (minimum free energy of most stable predicted structure, normalized to length), indicates PAP-enriched transcripts have more stable 3′UTR secondary structures (Wilcoxon test, Benjamini–Hochberg-corrected, **P < 0.01, lower values are more stable).
Fig. S6.
Pathway analysis using GO for PAP enriched transcripts. (A) All enriched GO terms for PAP-enriched transcripts, P < 0.005, hypergeometric test with Benjamini–Hochberg correction. (B) All enriched GO terms for PAP-depleted transcripts, P < 0.05, hypergeometric test with Benjamini–Hochberg correction.
PAP-Enriched Transcripts Have Longer 3′UTRs and Are More Highly Expressed than PAP-Depleted Transcripts
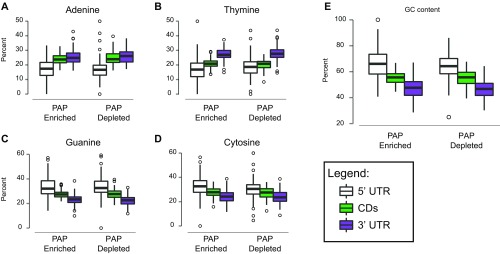
For some well-characterized dendritically localized transcripts, as well as the localization of Actb in fibroblasts, sequence-specific features are commonly found within the 3′UTR that mediate their localization (32–34) or localized translation. Therefore, we tested whether PAP-enriched transcripts contain sequence-specific features. We found no differences in individual nucleotide or GC content (Fig. S7). However, PAP-enriched transcripts were expressed significantly higher in cortical astrocytes compared with PAP-depleted transcripts (Fig. 4B). In neurons, locally translated mRNAs, often sequestered by RNA-binding proteins (RBPs) into granules for transport and protection, have significantly longer 3′UTRs (35). This aspect may enable more sequence motifs or secondary structure for binding RBPs. We found that PAP-enriched transcripts are also significantly longer, specifically in their 3′UTRs (Fig. 4C). Because RBPs may recognize secondary structure rather than specific sequence, we used the RNA-folding algorithm, ViennaRNA (36), to investigate the stability of transcript 3′UTRs in the PAP-enriched/depleted transcripts. Interestingly, we found that PAP-enriched 3′UTRs are predicted to have more stable secondary structures (Fig. 4D). The greater length and structure suggests that sequences in 3′ UTRs may also serve to regulate the localized enrichment of specific mRNAs in PAPs, perhaps because of the presence of specific motifs.
Fig. S7.
Nucleotide composition does not differ between PAP-enriched and depleted transcripts. (A–D) Percent composition of each nucleotide for 5′UTR (white), coding sequence (CDs, green), and 3′UTR (purple) in PAP-enriched and depleted lists. P > 0.05, Wilcoxon test with Benjamini–Hochberg. (E) GC percentage. P > 0.05, Wilcoxon test with Benjamini–Hochberg correction.
Evidence for Multiple Mechanisms of Regulation of Localized Translation
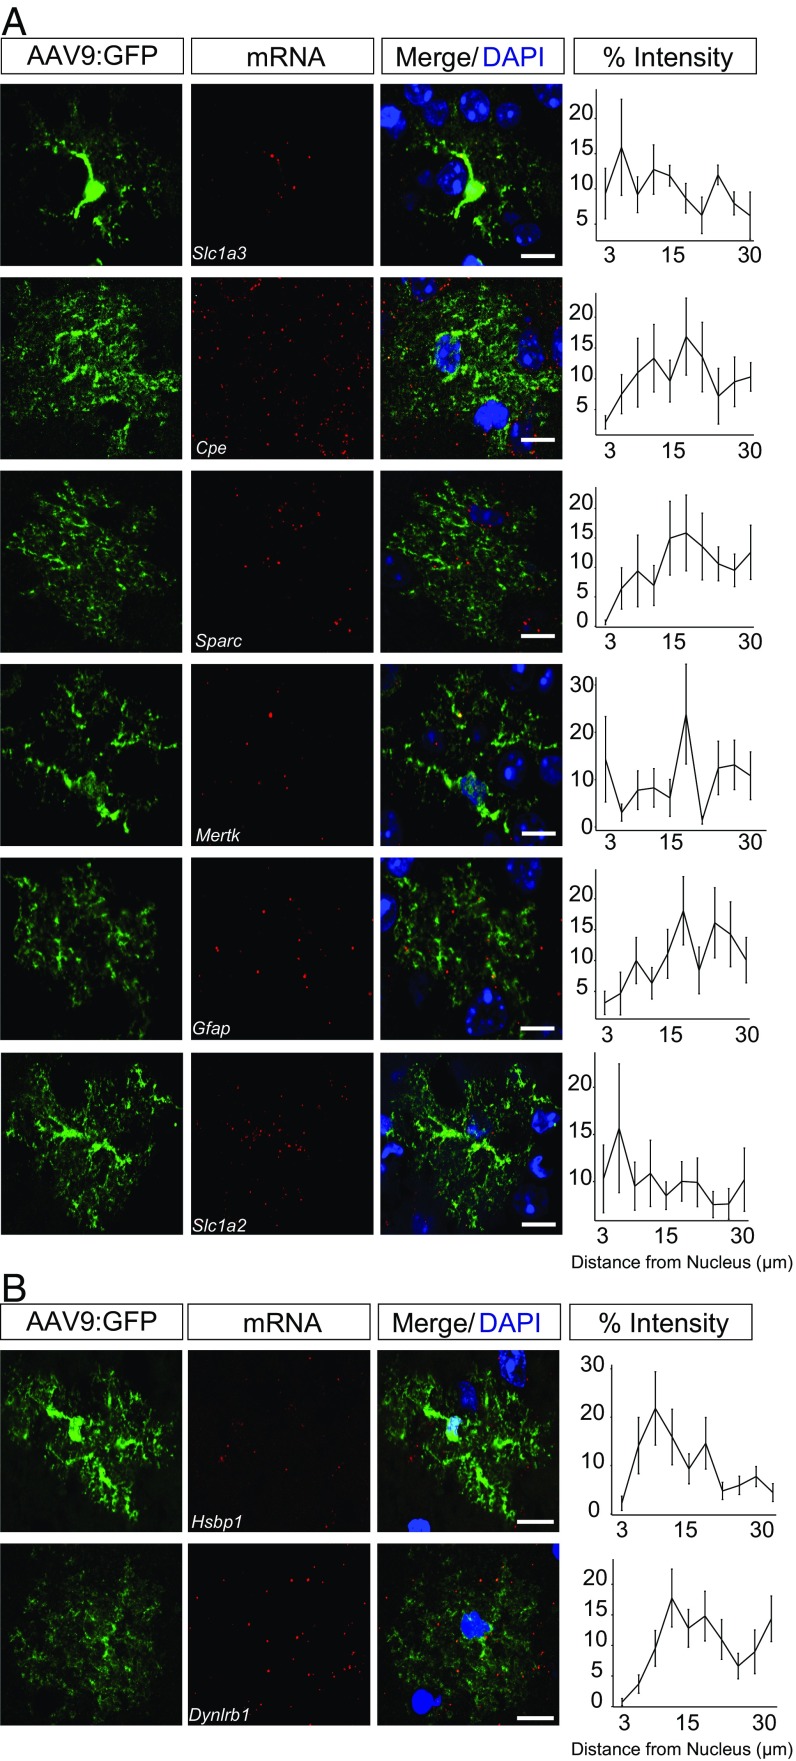
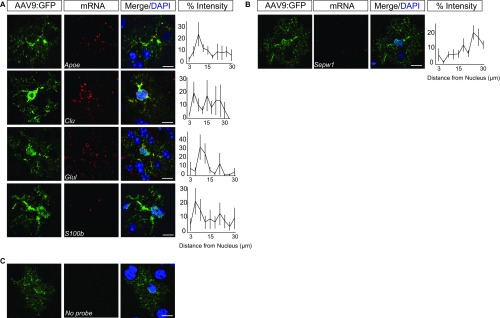
There are at least two mutually nonexclusive mechanisms by which particular transcripts could show increased translation at the PAP. First, the mRNAs could have motifs that enrich their localization, in particular subcellular compartments; second, they could have motifs that control their interactions with ribosomes in certain compartments. To assess the possibility of the first mechanism, we surveyed mRNA localization, in vivo, of six PAP-enriched and two PAP-depleted mRNAs, via FISH (Fig. 5). Similar to the puromycylation experiments (Fig. 2 and Fig. S3), we quantified the FISH intensity in astrocytes at increasing distances away from the nucleus. Because synapses can be found at a range of distances from the nucleus (37, 38), and PAPs lack IF markers in vivo, it is difficult to determine which FISH puncta might localize to PAPs. Nonetheless, using our simple metric, we found that subcellular mRNA localization patterns vary significantly between probes [repeated-measures ANOVA, F(7, 144) = 2.175, P = 0.04], supporting substantial sequence-dependent regulation of RNA localization within astrocytes. Some transcripts, like Sparc, Cpe, and Dynlrb1, appeared to have a relative depletion of mRNA from the perinuclear compartment, whereas others had a more even distribution (Slc1a2, Slc1a3) or a distal depletion (Hsbp1). A diversity of patterns was also apparent in an additional five transcripts (Fig. S8). Overall, this finding is consistent with different transcripts using multiple distinct mechanisms to mediate their PAP-enriched translation, some functioning at the level of RNA localization, whereas others may regulate interactions with the ribosome.
Fig. 5.
mRNA localization of PAP-TRAP candidates, in vivo. FISH on GFP-labeled astrocytes demonstrates nonsimilar patterns within and between PAP-enriched (A) and depleted (B) mRNAs. Percent intensity at increasing distances from the nucleus is plotted for each probe. (Scale bars, 10 µm.) Error bars represent ± SEM. Cortical astrocytes were labeled as described in Fig. S2. n = Cpe (19 cells), Dynlrb1 (17 cells), Gfap (29 cells), Hsbp1 (17 cells), Mertk (15 cells), Slc1a2 (14 cells), Slc1a3 (25 cells), Sparc (16 cells), with cells collected across three independent animals.
Fig. S8.
mRNA localization of additional PAP-TRAP candidates, in vivo. (A and B) FISH on GFP-labeled astrocytes demonstrates nonsimilar patterns within and between PAP-enriched (A) and -depleted (B) mRNAs. Percent intensity at increasing distances from the nucleus is plotted for each probe. Error bars represent ± SEM. Cortical astrocytes were labeled as described in Fig. S2. Images are representative of three independent experiments with each probe. n = Apoe (9 cells), Clu (8 cells), Glul (8 cells), S100b (11 cells), Sepw1 (10 cells). (C) Representative image of “no probe” condition shows no background FISH signal. (Scale bars, 10 µm.)
The Quaking RBP Response Element Is Enriched in PAP Transcripts and Regulates RNA Location and Protein Stability
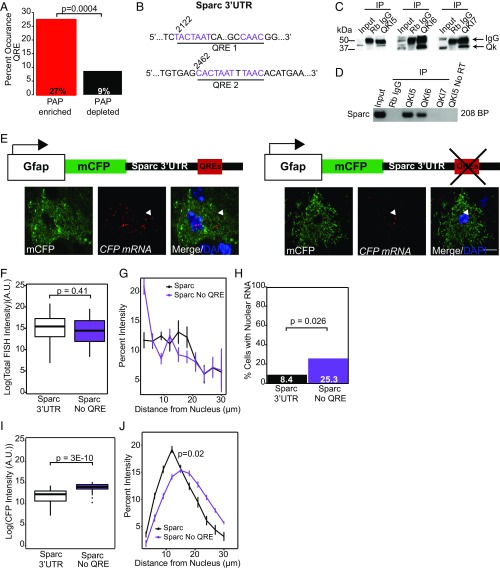
In neurons and oligodendrocytes, motifs regulating local translation are also often found in the 3′UTR (33). To test the hypotheses that specific 3′UTR sequences might also mediate mRNA localization or local protein production in astrocytes, we scanned for enriched motifs using analysis of motif enrichment (AME) (39) and identified a significant enrichment of the core site of Quaking (Qk) RBP response element (QRE; Fisher’s exact test, P = 1.2E-05). The QRE is comprised of a core site NACUAAY and a half site YAAY, where Y is a pyrimidine (40), and the half site may lie upstream or downstream of the core. Thus, to confirm the results from AME, we independently searched for the complete motif and found that a significantly higher percentage of PAP transcripts contain a QRE, compared with PAP-depleted transcripts (Fig. 6A). Interestingly, Qk has a known role in mRNA export from the nucleus. In oligodendrocytes of Qk viable mice, myelin basic protein mRNA is restricted to the nucleus and thus cannot be locally synthesized, inevitably causing dysmyelination and a quaking phenotype (41, 42). Therefore, we hypothesized that QREs may play a role in local translation of PAP transcripts. Qk is present in astrocytes and is known to regulate Gfap in primary human astrocytes (43, 44). Here, we chose to focus on the Sparc 3′UTR that has two putative QREs (Fig. 6B), is secreted from astrocytes, and has been shown to specifically antagonize the synaptogenic effects of the protein Hevin, thus suggesting a physiological role for local translation (30, 45). We first asked whether Sparc is bound by Qk in vivo by immunoprecipitating (IP) the three Qk isoforms, QKI-5, -6, and -7 (Fig. 6C). We found that Sparc co-IPs with the nuclear isoform, QKI-5 and one cytoplasmic isoform, QKI-6, but not QKI-7 (Fig. 6D).
Fig. 6.
Qk promotes nuclear export of Sparc mRNA and controls its translational efficiency. (A) Percent of transcripts in PAP-enriched/depleted lists that contain the QRE core and half sites NACUAAY-N(1,20)-YAAY, one-tailed Fisher’s exact test. (B) Sparc 3′UTR cDNA sequences that contain putative QREs, numbers indicate position (NM_001290817). (C) Qk isoforms 5, 6, and 7 were immunoprecipitated from adult mouse brain and isolated material was analyzed on a Western blot with Qk antibodies. Total mouse IgG was used in negative IP controls. (D) RT-PCR of Sparc after isolation of Qk or mouse IgG-bound RNA. (E) Cartoon schematic of viral constructs with representative confocal images from each condition. Arrows indicate representative examples of RNA localized in the periphery (Sparc 3′UTR) vs. soma/nucleus (Sparc no QRE) of the cell. (Scale bar, 10 µm.) (F) Boxplots of FISH intensity throughout the entire cell, student’s two-tailed t test. (G) Percent intensity of FISH signal across distance, normalized within cell. Repeated-measures ANOVA main effect of distance: F(1, 1,240) = 47.132, P = 1.05E-11. (H) Number of cells containing nuclear RNA foci, one-tailed Fisher’s exact test. (I) CFP protein intensity in each cell, Wilcoxon rank-sum test. (F–H) n = = 67 (Sparc), 71 (Sparc no QRE); (I) n = 53 (Sparc), 46 (Sparc no QRE). (J) Percent intensity of CFP protein across distance, normalized within cell. Repeated-measures ANOVA main effects of condition F(1, 97) = 6.025, P = 0.0159 and distance F(1, 97) = 11.21, P = 0.0012 and a significant interaction between them F(1, 97) = 30.08, P = 3.29E-7.
To directly probe whether RNA localization is altered with the loss of the QREs, we designed astrocyte-specific viral reporter constructs in which a membrane-bound cerulean fluorescent protein (mCFP) is followed by the Sparc 3′UTR, with or without both QREs (Fig. 6E and Fig. S2), under the control of a GFAP promoter to sparsely label astrocytes as above. Quantification of total FISH intensity in each cell was not different between conditions (Fig. 6F); however, we did notice an increase in nuclear localized CFP mRNA intensity (Fig. 6G) when we deleted the QREs from Sparc, in a subset of the astrocytes. When we quantified the number of cells in each condition with nuclear RNA foci, we found that significantly more cells contained nuclear RNA when we deleted Sparc’s QREs (Fig. 6H). We confirmed this is not the result of an artifactual hybridization to viral episomal DNA because a nuclear RNA remained after treatment with RNase H. Additionally, we noticed that CFP protein appeared consistently brighter in cells that were transduced with Sparc 3′UTR without the QREs. We quantified the IF signal intensity of cells in each condition and found that cells transduced with Sparc 3′UTR without QREs had significantly more CFP protein (Fig. 6I). Finally, to determine whether these aspects of QRE function will result in a different subcellular distribution of the translated protein, we examined distribution of mCFP after normalizing for expression levels. We found QREs altered the relative concentration of mCFP in the distal compartments (Fig. 6J). Overall, these data indicate that the QREs promote nuclear export of Sparc and, without affecting RNA abundance, also serve to suppress translation and shift the relative proportion of proteins.
Discussion
Here we present evidence of localized translation of specific transcripts in astrocytes. We have provided evidence that ribosomes and mRNA are localized throughout the astrocyte, and by labeling of new protein synthesis with a brief pulse with puromycin have confirmed new peptide synthesis throughout the cell. We also use a biochemical method to enrich for ribosome-bound transcripts in PAPs. Our data indicate that these PAP-enriched candidates have a median higher expression and a significantly longer and more stable 3′UTR than those transcripts not enriched in the PAP. The higher median expression suggests one mechanism that prevents distal translation for some transcripts might be destabilizing elements that lead to a short half-life, and indeed many proteins with roles in transcription regulation have such elements (46). The 3′UTR length and structure differences suggest that localization information exists in the 3′UTR, as is the case with many dendritically translated transcripts (33). As proof of this concept, we found that the QRE is enriched in PAP transcripts and in the context of the Sparc 3′UTR, promotes nuclear export and decreases translational efficiency. Although we did not find a difference in peripherally localized RNA in the absence of QREs, mRNA export is a key first step in localization and may contribute to a multistep mechanism of peripheral localization. Additionally, it is thought that translational repression of locally translated mRNAs is a critical step in proper spatial expression of the protein (47, 48). Thus, Qk may bind PAP-localized mRNAs and suppress translation during transport or to keep the mRNA in a poised state at the PAP until receipt of an unknown cue. When tested with a reporter gene, the consequence of removing the QREs was to increase the relative protein abundance in the periphery, consistent with other motifs in the RNA regulating peripheralization of the mRNA, whereas the QRE suppresses translation. Understanding of additional mechanisms governing astrocyte local translation will provide insight to the phenomenon and opportunities to test the physiological relevance.
We also demonstrate the complexity of mRNA localization in astrocytes, in vivo, with FISH. These data motivate the development of tools for labeling PAPs, as we demonstrated that mRNA localization does not follow simple patterns based on distance from the nucleus. We hypothesize that the subcellular domains in astrocytes may rather be specified by their proximity to CNS structures, such as synapses and blood vessels, and this likely contributes to the variability in mRNA distribution within and across probes when using our current proxy measure (Fig. 5). Finding RNA or protein markers of any such domains would advance the field, as would application of methods like merFISH (49), to determine which mRNA species are coenriched in particular puncta within an astrocyte.
Interestingly, we detected a few neuron-derived transcripts copurifying and enriched with SN-localized astrocyte ribosomes (Dataset S2), but we conclude that the removal of these transcripts from the data does not change the overall conclusions presented herein (Fig. S5 and Dataset S4). However, the possible mechanisms for this signal may reveal interesting biology and are of interest for future study.
We note that our current list of locally translated candidates includes several disease genes; most notably, the Alzheimer’s-associated gene Apoe appears to be robustly enriched in the PAP. Furthermore, at least two dysregulated transcripts identified via TRAP in astrocytes in amyotrophic lateral sclerosis (ALS) models (Heyl and Vim) (50), as well as Slc1a2, which is downregulated in the motor cortex of ALS patients (51), are enriched in the PAP. It is possible that dysregulation of local translation may contribute to disease progression and vulnerability of adjacent neurons. The PAP-TRAP method should be readily adaptable to study such possibilities in mouse models of neurological disorders.
Whereas local translation in neurons has been described for decades, only a few studies have been able to address its physiological role. Although we do not yet have the tools to directly probe the physiological role of peripheral astrocyte translation, our pathway analyses provide interesting clues. We found that the transcripts for secreted protein precursors are found in PAPs (Clu, Cpe, and Sparc), all of which have been identified as enriched in astrocyte-conditioned media by mass spectrometry (45). This finding suggests that these glial-derived soluble signaling molecules are locally synthesized before their extracellular release. Furthermore, we noted several peripherally enriched transcripts for proteins with known roles in synapse maintenance, including Sparc, and Mertk. It has been shown that Sparc negatively regulates excitatory synaptogenesis by antagonizing Hevin (30). Furthermore, Mertk is a required engulfment receptor for astrocyte-mediated synapse elimination, in vitro and in vivo (29). Together, these findings provide evidence consistent with the exciting possibility that localized translation might have a role in a localized astrocyte-mediated synaptic modulation. Overall our data indicate that astrocytes are capable of a sequence-regulated localized translation. We posit here that, whereas neurons are thought to require localized translation to compensate for the great length of their dendrites and axons, astrocytes contacting multiple synapses may use local translation to allow for them to respond to or modulate the activity of specific synapses.
Materials and Methods
Animals.
All procedures were approved by the Institutional Animal Care and Use Committee at Washington University in St. Louis.
Viral Delivery.
AAV9 GFAP-mCFP or AAV9 CBA-IRES-GFP and was delivered by intracranial injections in postnatal day (P)2 pups, and tissues were harvested at P21.
Acute Slice Preparation and Drug Treatment.
Acute cortical slices (300 µm) were prepared as described previously (52). Slices were incubated with 3 μM puromycin (Tocris #40–895-0) for 10 min at 37 °C. In controls, 1 mM anisomycin (Sigma #A9789) was added to slices 30 min before puromycin.
IF.
For IF, 40-μm sections were cryosectioned after 4% paraformaldehyde (PFA) perfusions. Sections were incubated with primary antibodies (Table S1) followed by Alexa-conjugated secondary antibodies (Invitrogen) and DAPI. For STORM, Jackson Immunoresearch secondary antibodies were conjugated with acceptor (Cy2, Cy3, or Alexa 405) and reporter (Alexa 647) fluorophore dye pairs and imaged as described previously (53). Representative images are from triplicate experiments.
Table S1.
Primary antibodies
| Antibody | Source | Concentration | Application |
| Rabbit GFAP | DAKO | 1:1,000 | IF |
| Mouse puromycin | Kerafast | 1:1,000 | IF |
| Rabbit Rps16 | Sigma | 1:1,000 | IF |
| Chicken GFP | Aves | 1:1,000 (IF/Western blot), 1:2,000 (STORM IF) | IF, STORM-IF, Western blot |
| Mouse bassoon | Novus | 1 µg/mL | STORM-IF |
| Rabbit homer-1 | Synaptic Systems | 1 µg/mL | STORM-IF |
| Goat biotinylated GFP | Abcam | 1:2,000 | DAB/EM |
| Rabbit QKI-5 | Millipore | 5 μL (IP), 1:500 (Western blot) | IP/Western blot |
| Rabbit QKI-6 | Millipore | 5 μL (IP), 1:500 (Western blot) | IP/Western blot |
| Rabbit QKI-7 | Millipore | 5 μL (IP), 1:500 (Western blot) | IP/Western Blot |
| Mouse PSD95 | Enzo | 1:1,000 | Western blot |
| Mouse Ezrin | Abcam | 1:500 | Western blot |
| Mouse laminB2 | Sigma | 1:500 | Western blot |
FISH.
FISH was performed on 14-μm slide-mounted cryosections after 4% PFA fixation of virally injected animals. Custom digoxigenin-labeled antisense probes were hybridized overnight, washed, H2O2-blocked, Dig-antibody–labeled, and detected via Tyramide Signal Amplification Cyanine 3 Tyramide (PerkinElmer #NEL704A001KT) as described previously (54). IF was subsequently performed. See Table S2 for primers for FISH probe templates.
Table S2.
Primers for FISH probe templates and RT-PCR
| Gene | Forward 5′ → 3′ | Reverse 5′ → 3′ | Application |
| Slc1a2 | GTTCCCTCCCAATCTGGTAGA | TAATACGACTCACTATAGGGCCGTGGCTGTGATGCTTATT | FISH |
| Cpe | TTTTCCAAAGCTTGGCTCGC | TAATACGACTCACTATAGGGTGTGATTGCCAGGTAGCCAG | FISH |
| Clu | GCTCTGGAGGACACTAGGGA | TAATACGACTCACTATAGGGCCCATAGTGGGAGGGAGACA | FISH |
| Glul | CGGGCCTGCTTGTATGCTG | TAATACGACTCACTATAGGGTCTTCTCCTGGCCGACAGTCC | FISH |
| Sparc | GCCTGGATTCCGAGCTG | TAATACGACTCACTATAGGGCCTCCAGGGCAATGTACTTGT | FISH |
| Mcfp | TGAAGTTCATCTGCACCACCG | TAATACGACTCACTATAGGGGACCATGTGATCGCGCTTCT | FISH |
| Apoe | ATGAAGGCTCTGTGGGCCGT | TAATACGACTCACTATAGGGGCTAGGCGCTTCTGCAGATCC | FISH |
| Mertk | TGACCTCCACAGCATCAAA | TAATACGACTCACTATAGGGGCTATTTTGAACCCAGAAGATA | FISH |
| S100b | ATGTCCGAGCTGGAGAAGG | TAATACGACTCACTATAGGGATGGCAGGCCGTGGTCA | FISH |
| Gfap | ATGGAGCGGAGACGCATC | TAATACGACTCACTATAGGGCCTCCAGCCTCAGGTTGG | FISH |
| Slc1a3 | GTTCCCTCCCAATCTGGTAGA | TAATACGACTCACTATAGGGCCGTGGCTGTGATGCTTATT | FISH |
| Dynlrb1 | GCAGGGCATCATCGTGGTG | TAATACGACTCACTATAGGGCTGCAAGGGCGAACTGATTCC | FISH |
| Hsbp1 | GGAGAAGAATATCGCTGAC | TAATACGACTCACTATAGGGAGTACTCTGCCACTTTATCAC | FISH |
| Sepw1 | CGCCGTTCGAGTCGTGTATTG | TAATACGACTCACTATAGGGGCAGCTTTGATGGCGGTCAC | FISH |
| Sparc | TGGGAGAATTTGAGGACGGTG | GAGTCGAAGGTCTTGTTGTCAT | RT-PCR |
Microscopy.
Confocal microscopy used an UltraVIEW VoX spinning disk (PerkinElmer) or an AxioImager Z2 (Zeiss). Structured illumination microscopy (SIM) microscopy was performed on a Nikon n-SIM. STORM images were acquired on a custom-built microscope.
Quantification.
We drew concentric rings around the nucleus with increasing radii of 3 μm, in ImageJ, and quantified intensity of CFP; the extent of FISH or puromycin intensity and area overlapping with GFP/CFP were quantified for each ring.
EM.
Mice were perfused with 37 °C Ringer’s solution, then 37 °C 4% PFA, then postfixed. Next, 100-µm coronal vibratome sections were cut, rinsed, H2O2-blocked, washed, incubated in 1% sodium borohydride, washed then incubated with anti-GFP, then Vectastain ABC elite (Vector Laboratories, PK-6100), and washed in 0.1 M sodium acetate, then labeled with nickel-enhanced DAB before postfixation. Samples were then prepared for EM, as described previously (55). The 70-nm-thin sections were imaged on a JEOL JEM-1400 Plus at 80 KeV.
IP.
Qk was immunoprecipitated by coupling QKI antibody to Biotinylated-Protein G (Pierce) on Streptavidin M280 Dynabeads (Invitrogen). C57bl6/j brains were homogenized, lysed, and incubated with beads at 4 °C. Beads were washed and split for RNA isolation (75%) and Western blotting (25%).
SN Preparation.
Three cortices (including hippocampi) per replicate were homogenized from Aldh1l1:EGFP/RPL10A mice and homogenate was spun at 1,000 × g for 10 min at 4 °C, layered onto a sucrose-Percoll gradient as described previously (56), and spun at 32,500 × g for 5 min. The SN band was collected by puncturing the bottom of the tube to collect the SN fractions.
Western Blots.
For three independent replicates, lysates were separated on 4–12% polyacrylamide gel (Bio-Rad), transferred to PVDF, and probed with primary antibodies (Table S1) and HRP-coupled secondaries (Bio-Rad).
TRAP-seq.
TRAP was performed on three replicates of SN fraction (PAP-TRAP sample) and cortex homogenate (cortex-TRAP sample), modified from protocols as described previously (18, 57). RNA quality and concentration were assessed using PicoChips on the Agilent BioAnalyzer (Fig. S4). Double-stranded cDNA was prepared using the Nugen Ovation RNA-seq System V2. Illumina sequencing libraries using the NEBNext Ultra DNA Library Prep Kit for Illumina (#E7370S). Libraries were sequenced on an Illumina HiSEq. 2500, for a total of 195 M 50-bp reads across the 12 samples. Reads were analyzed as described previously (54). Raw and analyzed RNA-sequencing data are also available at the Gene Expression Omnibus, accession no. GSE74456.
GO Analysis.
PAP-enriched and -depleted lists (Fig. 3E) were analyzed using the BiNGO plugin (v3.0.3) in Cytoscape (v3.2.1). Mouse genome informatics IDs and descriptions were obtained from the biomaRt package from Bioconductor in R. Overrepresented biological processes were identified using a hypergeometric test with Benjamini–Hochberg. Lists were compared with a background list of genes detected at counts per million (cpm) > 2 in the cortex-input sample.
Sequence Features.
For each gene, the sequence of the longest isoform was used. All comparisons between lists were made with Wilcoxon rank-sum test with Benjamini–Hochberg correction. For RNA structure, we used the ViennaRNA RNAfold (58) program, and normalized for length. AME used the MEME-suite (59) webtool on PAP-enriched transcripts, using PAP-depleted transcripts as control sequences, with default parameters and Fisher’s exact test. The QRE (40) motif was independently validated with a custom R script.
SI Materials and Methods
Animals.
Mice were maintained in standard housing conditions with food and water provided ad libitum. B6.FVB-Tg(Aldh1L1-EGFP/RPL10A)JD130Htz/J animals (18) were bred to pure C57BL/6J mice (Jackson strain # 000664) to obtain litters of GFP+ and GFP− animals.
Viral Packaging and Injection.
GFAP-mCFP plasmid was made by adding 10 amino acids of human Lck (63) to the N-terminal of CFP. CBA-IRES-GFP (64) and GFAP-mCFP viruses were packaged using the AAV9 serotype by the Hope Center Viral Vectors Core at Washington University in St. Louis. HEK293T are cultured in DMEM, supplemented with 5% FBS, 100 units/mL penicillin, 100 µg/mL streptomycin in a 37 °C incubator with 5% CO2 and plated at 30–40% confluence in CellSTACS (Corning) 24 h before transfection (70–80% confluence). Next, 730 µg pAAV2/9, 1,180 µg pHelper, and 590 µg rAAV transfer plasmid was cotransfected using the calcium phosphate precipitation procedure (65). The cells were incubated at 37 °C for 3 d before harvesting and lysis by three freeze/thaw cycles. Lysate was treated with 25 U/mL of Benzonaze at 37 °C for 30 min. After centrifugation at 10,000 × g for 20 min, the supernatant was collected and precipitated in 8% PEG overnight. After centrifugation at 2,600 × g for 30 min, the supernatant was discarded and the pellet resuspended in lysis buffer (150 mM NaCl, 50 mM Tris⋅HCl, pH 8.5). In a 38.5-mL polyallomer tube, 5 mL 1.5 g/mL CsCl was added and 12 mL 1.37 g/mL CsCl was overlaid along the side of the tube. A 15-mL sample was then gently added along the side of the tube. The sample was centrifuged with SW28 rotor, at 24,000 rpm (182,000 × g), 20 °C for 24 h. A 21-gauge needle was inserted through the bottom side of the centrifuge tube. Next, 1-mL fractions were collected. Vector-containing fractions were pooled and diluted with 1.37 g/mL CsCl. The sample was loaded to a 13.5 mL Quick-seal tube and centrifuged with an ultracentrifuge (Beckman LE-80K), 90 Ti rotor, at 67,000 rpm (384,000 × g), 20 °C for 16–20 h. The 0.5-mL fractions were collected. Vector-containing fractions were pooled and then concentrated with Vivaspin 20 100K concentrator (Sartorius Stedim). Vector titer was determined by Dot blot assay.
Two microliters of 1012 vector genome (vg)/mL virus was injected bilaterally in the cortex, 1.5 mm from the midline in two regions: 1-mm caudal to bregma and 2-mm rostral to lambda. Injections were performed with a 33-gauge needle (Hamilton #7803–05) with a 50-μL Hamilton syringe (#7655-01). Mice were aged until P21 before being killed with CO2 and transcardial perfusion with PBS, followed by 4% PFA in PBS.
Acute Slice Preparation and Drug Treatment.
Acute cortical slices (300 µm) were prepared as described previously (52). Slices were incubated in artificial cerebrospinal fluid: 125 mM NaCl, 25 mM glucose, 25 mM NaHCO3, 2.5 mM KCl, 1.25 mM NaH2PO4, equilibrated with 95% oxygen-5% CO2 plus 0.5 mM CaCl2, 3 mM MgCl2; 320 mosmol. Next, 3 μM puromycin (Tocris #40-895-0) was added to slices and allowed to incubate for 10 min at 37 °C. In controls, 1 mM anisomycin (Sigma #A9789) was added to slices 30 min before puromycin.
FISH.
FISH was performed on 14-μm slide-mounted cryosections after 4% PFA fixation of AAV9-CBA-IRES-GFP or AAV9-GFAP-mCFP animals. Digoxigenin-labeled antisense probes were made from purified PCR products containing a T7 promoter site in the appropriate orientation. In vitro transcription was performed using T7 polymerase (Promega #P2075) and Dig RNA labeling Mix (Roche #11277073910) according to the manufacturer’s instructions. Primers for the probe template can be found in Table S2. Hybridization was performed at 65 °C overnight in a humid chamber, followed by washes and H2O2 block as described previously (54). Detection was performed using Sheep anti–Dig-POD (Roche #11207733910) followed by Tyramide Signal Amplification Cyanine 3 Tyramide (PerkinElmer #NEL704A001KT) as per the manufacturer’s instructions. Slides were then incubated with antibodies against additional specific proteins (see discussion of IF, below) for dual FISH/IF. Quantification was carried out in ImageJ using custom macros to measure intensity of RNA foci, at different radii from nucleus center as in puromycin quantification. Repeated-measures ANOVA analysis was done in R.
IF.
For IF, 40-μm sections were cryosectioned after 4% PFA transcardial perfusions. Sections were incubated primary antibodies followed by detection with appropriate Alexa-conjugated secondary antibodies (Invitrogen) and nuclei were counterstained with DAPI. For STORM IF, 14-μm sections were cryosectioned after flash-freezing on dry ice and immunolabeled with primary antibodies, then secondary antibodies raised in donkey (Jackson Immunoresearch) as described previously (20). Secondary reagents were custom-conjugated with acceptor (Cy2, Cy3, or Alexa 405) and reporter (Alexa 647) fluorophore dye pairs. The imaging buffer was added as described previously (53). Representative images are from triplicate experiments. Confocal microscopy was performed on an UltraVIEW VoX spinning-disk microscope (PerkinElmer) or an AxioImager Z2 (Zeiss). SIM microscopy was performed on a Nikon n-SIM.
Quantification of Imaging Data.
To determine the distribution of translation and RNA in the astrocyte, we drew concentric rings around the nucleus with increasing radii of 3 μm, in ImageJ. We empirically determined that a circle with a radius of 27–30 μm encompasses the entire cell, without approaching another astrocyte’s territory (Fig. S3). For Fig. 6I, quantification of the CFP protein was done by measuring the entire cell and was done independently of FISH experiments. Experiments were conducted in triplicate. Cells counted are reported in the legends.
STORM Imaging.
The imaging rig was constructed on an active dampening vibration isolation table (Newport) and around a Nikon TiE inverted microscope. Lasers, 642 nm (Vortran laser), 561 nm, 488 nm (Sapphire, Coherent Inc.), and 405 nm (Cube, Coherent Inc.) were shuttered individually via mechanical shutters, as well as an Acousto-Optical Tunable Filter (Crystal Technologies). The amount of activation lasers was adjusted to ensure sparse single-molecule events in each camera frame. Lasers were combined, expanded, collimated, and focused at the back focal plane of the microscope. The diameter of the laser beam was cut using a field diaphragm to just cover a 256 × 256-pixel area of the CCD camera. A mechanical translation stage enabled objective type total internal reflection illumination via a 100×, 1.4 NA objective (UPlanSApo, Olympus). The Nikon perfect focus system was used to lock the focus at the coverslip surface during imaging. A quad-band dichroic mirror zt/zet-405/488/561/640rpc (Chroma Technology) was used to excite with laser light and the fluorescence collected by the same objective was filtered using et705/72m emission filter for Alexa 647. Images were acquired on a back-illuminated EM-CCD camera (DU-897, iXon+, Andor Technology), using custom software. Three-dimensional astigmatism imaging was performed as described previously (20) by placing a cylindrical lens in front of the camera. Sparse single-molecule images were acquired at 60-Hz frequency using an imaging and activator laser sequence: one frame of weak activator laser (561/488/405) followed by three frames of 642-nm laser at 560 W/cm2, repeated as a train for each activator dye–antibody combination.
DAB Staining and EM.
Mice were perfused with warmed (37 °C) mammalian Ringer’s solution for 2 min followed by warmed 4% PFA in 1× PBS for 5 min. The brain was gently removed and fixed overnight in fresh 4% PFA in PBS at 4 °C. The following day, 100-µm coronal vibratome sections were cut into PBS. The slices were rinsed in PBS three times for 10 min each and incubated in 0.3% hydrogen peroxide in PBS for 15 min to block endogenous peroxidase activity. The slices were again rinsed in PBS three times for 10 min each and incubated in 1% sodium borohydride in PBS for 5 min to quench aldehydes and permeabilize the tissue. The slices were rinsed in PBS three times for 10 min each and incubated in antibody in 2% BSA in PBS overnight at 4 °C with agitation. Samples were then rinsed in PBS five times for 10 min each and incubated in a solution of Vectastain ABC elite (Vector Laboratories, PK-6100) in PBS for 45 min with agitation. Slices were washed in PBS three times for 10 min each followed by 0.1 M sodium acetate buffer two times for 5 min each. The samples were nickel-enhanced DAB labeled with the following mixture: 20 mg β-D(+)-glucose, 4 mg ammonium chloride, 250 mg nickel ammonium sulfate, 5 mg 3,3′-diaminobenzidine, and 1 mg glucose oxidase in 0.1 M acetate buffer. The overall reaction took 3 min and was stopped by washing the slices in 0.1 M acetate buffer two times for 5 min when a dark reaction product was visualized by light microscopy. Tissues were rinsed in PBS three times for 10 min each and placed into fixative solution of 2.5% glutaraldehyde + 2% paraformaldehyde in PBS at 4 °C overnight. The following day, samples were rinsed in PBS three times for 10 min each, and fixed for 1 h on ice in 1% osmium tetroxide/1.5% potassium ferrocyanide in PBS. Following this process, samples were washed in ultrapure water three times for 10 min each and en bloc-stained for 1 h with 2% aqueous uranyl acetate. After staining, samples were briefly washed in ultrapure water, dehydrated in a graded ethanol series (50%, 70%, 90%, 100% 2×) for 10 min in each step, infiltrated with microwave assistance (Pelco BioWave Pro) into LX112 resin, and flat-embedded between two Teflon-coated slides. Samples were cured at 60 °C for 48 h. Once the resin was cured, a small region of the cortex was excised out and glued onto a blank stub with epoxy. Next, 70-nm-thin sections were then cut and imaged on a transmission electron microscope (JEOL JEM-1400 Plus) at 80 KeV.
IP of Qk.
Brains were homogenized in lysis buffer [50 mM Tris⋅HCl pH 7.4, 10 mM NaCl, 1% Nonidet P-40, 1× EDTA-free Protease Inhibitor (Roche), 1 U/µL rRNAsin (Promega), 10 mM Na3VO4, and 10 mM NaF] and added to antibody-coupled beads for 3 h of end-over-end incubation at 4 °C. Beads were washed four times, 5 min each, in high-salt buffer (50 mM Tris⋅HCl pH 7.4, 350 mM NaCl, 1% Nonidet P-40 and 1 U/µL rRNAsin) and split for RNA isolation and Western blotting. Representative images (Fig. 6) represent three independent experiments. Twenty nanograms of RNA from IP was added to the reverse-transcriptase reaction using qScript Reverse Transcriptase (Quantabio) according to the manufacturer’s recommendations.
SN Preparation.
SN fractions were isolated using a modified protocol (56). Three cortices (including hippocampi) were pooled from Aldh1l1:EGFP/RPL10A mice and homogenized in 3.5 mL of: 5 mM Tris pH 7.5 and 250 mM sucrose supplemented with 0.5 mM DTT, 100 μg/mL cycloheximide, 1 mM tetrodotoxin (Tocris #1069), 40 units/mL rRNAsin (Promega #N2511), 20 units/mL SUPERaseIn (Ambion #AM2694), and 1 tablet/10 mL cOmplete Mini EDTA-free protease inhibitor mixture (Roche #4693159001). Homogenization was performed in a glass Dounce homogenizer (7-mL maximum volume) with 10 strokes each of the loose and tight pestles. The homogenate was first spun at 1,000 × g in a Sorvall RT7 plus centrifuge for 10 min at 4 °C without brake. Next, 2 mL of the 2.5-mL supernatant was layered onto a sucrose-Percoll gradient as described previously (56) in Seton open-top tubes (#5042) and spun at 32,500 × g for 5 min in a Sorvall RC-5C without brake. The SN band was collected by puncturing the bottom of the tube, allowing the bottom milliliter to drip out, and collecting the next 3.5 mL, which are the combined SN fractions as described previously (56). Next, 200 μL of the SN fraction was used as the SN input sample. The remaining homogenate supernatant (∼500 μL) was spun at 20,000 × g for 15 min at 4 °C after incubation with 1% Nonidet P-40 (Sigma) and 30 mM DHPC (Avanti). Sixty microliters of the supernatant was added to 140 μL of 0.15 M KCl supplemented as the homogenization buffer, and was set aside for use as the cortex-input sample. The remaining supernatant and the SN fraction were used for either TRAP or Western blotting.
Western Blots.
Three independent replicates of the cortex and SN input samples were obtained. Crude lysate was run on a 4–12% polyacrylamide gel (Bio-Rad) and transferred to PVDF membranes using a semidry transblot apparatus (Bio-Rad) and probed with primary antibodies (Table S1) and HRP-coupled secondaries (Bio-Rad). Qk IPs were performed on three independent mice per IP.
TRAP.
TRAP was performed on three replicates of SN fraction (PAP-TRAP sample) and cortex homogenate (cortex-TRAP sample), modified from protocols as previously described (18, 57). RNA quality and concentration was assessed using PicoChips on the Agilent BioAnalyzer (Fig. S4). Biotinylated-protein l-coated streptavidin magnetic beads were coupled with two monoclonal mouse Anti-EGFP antibodies (18). Then, 500 µL of the homogenate (see above) was spun at 20,000 × g for 15 min at 4 °C after incubation with 1% Nonidet P-40 (Sigma) and 30 mM DHPC (Avanti). Sixty-microliters of the supernatant was added to 140 μL of 0.15 M KCl supplemented as the homogenization buffer, and was set aside for use as the cortex-input sample. Samples were added to conjugated beads and incubated on an inverted mixer for 3–4 h at 4 °C. Beads were then washed three times with a high-salt buffer (10 mM Hepes at pH 7.4, 350 mM KCl, 5 mM MgCl2, 1% Nonidet P-40, 0.5 mM DTT, 100 μg/mL cycloheximide). RNA purification was performed on eluted beads and the respective input samples in parallel using Qiagen RNEasy MinElute kit. RNA quality and concentration was assessed using PicoChips on the Agilent BioAnalyzer. A large subunit was tagged, and representative traces (Fig. S4) containing both 18S (small subunit) and 28S (large subunit) ribosomal RNA confirm that 80S ribosomes were harvested from the SN fraction and comparison groups. All samples used in this experiment had RNA integrity number (scores > 8 for RNA-seq library preparation.
Library Preparation.
Double-stranded cDNA was prepared from 2 ng of RNA using the Nugen Ovation RNA-seq System V2. Illumina sequencing libraries were generated from 600 ng of amplified cDNA, after shearing to ∼200 bp using a Covaris sonicator (New England Biolabs Next Ultra DNA Library Prep Kit for Illumina, #E7370S).
RNA-Sequencing.
Libraries were sequenced on an Illumina HiSEq. 2500, for a total of 195 M 50-bp reads across the 12 samples. Reads were analyzed as previously described (54). Raw and analyzed RNA-sequencing data are also available at the Gene Expression Omnibus, accession no. GSE74456.
Reads were trimmed using Trimmomatic (v0.32) and rRNA reads were depleted with bowtie2. Surviving reads were aligned to Ensembl release 75 of the mouse genome using STAR and then counted using HTSeq. Differential expression analysis was performed using the edgeR package; cpms of all 12 reads are in Dataset S1.
PAP-enriched transcripts were determined by the intersection of transcripts enriched in SN input/cortex input [false-discovery rate (FDR) < 0.1, log2 (fold-change) > 1.5] and transcripts enriched in PAP TRAP/SN input [FDR < 0.1, log2 (fold-change) > 1.5]. These transcripts are listed in Dataset S2.
PAP-depleted transcripts were determined by the intersection of transcripts depleted in SN input/cortex input [FDR < 0.1, log2 (fold-change) < 1.5] and transcripts enriched in cortex TRAP/cortex input [FDR < 0.1, log2 (fold-change) > 1.5]. These transcripts are listed in Dataset S3.
GO Analysis.
PAP-enriched and -depleted lists (Fig. 3E) were analyzed using the BiNGO plugin (v3.0.3) in Cytoscape (v3.2.1). Mouse genome informatics IDs and descriptions were obtained from the biomaRt package from Bioconductor in R. Overrepresented biological processes were identified using a hypergeometric test with Benjamini–Hochberg. Lists were compared with a background list of genes detected at cpm > 2 in the cortex-input sample.
Sequence Feature Analysis.
For each gene, the sequence of the longest isoform was obtained using the biomaRt package in R and used in subsequent analyses. We analyzed sequence length, GC content, and individual base content of the 5′UTR, CDS, and 3′UTR. All comparisons between lists were made with Wilcoxon rank-sum test with Benjamini–Hochberg correction. To predict RNA structure complexity, we used the ViennaRNA RNAfold (58) program, which calculates the minimum free-energy secondary structure of the input RNA sequence. Because longer sequences are more likely by chance to have more complex secondary structures, we normalized this free-energy value by the length of the sequence.
Motif Enrichment.
AME analyses were done using the MEME-suite (59) webtool. RNA motifs were identified in PAP-enriched transcripts, using PAP-depleted transcripts as control sequences. Default parameters were used, with Fisher’s exact test for the motif enrichment. To independently verify these findings, a custom R script was written to search for the QRE motif strings (40). A one-sided Fisher’s exact test was done to test enrichment of the motif in the sequences.
Supplementary Material
Acknowledgments
We thank Dr. Joshua Dearborn, Dr. Min-Yu Sun, Dr. Dennis Oakley, Dr. Matt Joens, and Dr. James Fitzpatrick for training and support; Dr. Kelly Monk, Kayla Nygaard, and Bernard Mulvey for comments; and the members of the J.D.D. laboratory for advice. This work was supported by the Children’s Discovery Institute (CDI) (MD-II-2013-269), the NIH (DA038458-01, MH099798-01, NS086741, 5T32 GM081739, T32 GM008151), and a CDI microgrant (CDI-CORE-2015-505), the Foundation for Barnes-Jewish Hospital (3770), the Hope Center by the Viral Vectors Core, and the Genome Technology Resource Center at Washington University in St. Louis (NIH P30CA91842 and UL1TR000448).
Footnotes
Conflict of interest statement: J.D.D. has received royalties for the translating ribosome affinity purification (TRAP) method.
This article is a PNAS Direct Submission.
Data deposition: The data reported in this paper have been deposited in the Gene Expression Omnibus (GEO) database, https://www.ncbi.nlm.nih.gov/geo (accession no. GSE74456).
This article contains supporting information online at www.pnas.org/lookup/suppl/doi:10.1073/pnas.1617782114/-/DCSupplemental.
References
- 1.Araque A, Parpura V, Sanzgiri RP, Haydon PG. Tripartite synapses: Glia, the unacknowledged partner. Trends Neurosci. 1999;22:208–215. doi: 10.1016/s0166-2236(98)01349-6. [DOI] [PubMed] [Google Scholar]
- 2.Ullian EM, Sapperstein SK, Christopherson KS, Barres BA. Control of synapse number by glia. Science. 2001;291:657–661. doi: 10.1126/science.291.5504.657. [DOI] [PubMed] [Google Scholar]
- 3.Mauch DH, et al. CNS synaptogenesis promoted by glia-derived cholesterol. Science. 2001;294:1354–1357. doi: 10.1126/science.294.5545.1354. [DOI] [PubMed] [Google Scholar]
- 4.Pfrieger FW, Barres BA. Synaptic efficacy enhanced by glial cells in vitro. Science. 1997;277:1684–1687. doi: 10.1126/science.277.5332.1684. [DOI] [PubMed] [Google Scholar]
- 5.Jourdain P, et al. Glutamate exocytosis from astrocytes controls synaptic strength. Nat Neurosci. 2007;10:331–339. doi: 10.1038/nn1849. [DOI] [PubMed] [Google Scholar]
- 6.Swanson RA, et al. Neuronal regulation of glutamate transporter subtype expression in astrocytes. J Neurosci. 1997;17:932–940. doi: 10.1523/JNEUROSCI.17-03-00932.1997. [DOI] [PMC free article] [PubMed] [Google Scholar]
- 7.Kang H, Schuman EM. A requirement for local protein synthesis in neurotrophin-induced hippocampal synaptic plasticity. Science. 1996;273:1402–1406. doi: 10.1126/science.273.5280.1402. [DOI] [PubMed] [Google Scholar]
- 8.Kislauskis EH, Li Z, Singer RH, Taneja KL. Isoform-specific 3′-untranslated sequences sort alpha-cardiac and beta-cytoplasmic actin messenger RNAs to different cytoplasmic compartments. J Cell Biol. 1993;123:165–172. doi: 10.1083/jcb.123.1.165. [DOI] [PMC free article] [PubMed] [Google Scholar]
- 9.Zhang HL, et al. Neurotrophin-induced transport of a beta-actin mRNP complex increases beta-actin levels and stimulates growth cone motility. Neuron. 2001;31:261–275. doi: 10.1016/s0896-6273(01)00357-9. [DOI] [PubMed] [Google Scholar]
- 10.Steward O, Levy WB. Preferential localization of polyribosomes under the base of dendritic spines in granule cells of the dentate gyrus. J Neurosci. 1982;2:284–291. doi: 10.1523/JNEUROSCI.02-03-00284.1982. [DOI] [PMC free article] [PubMed] [Google Scholar]
- 11.Burgin KE, et al. In situ hybridization histochemistry of Ca2+/calmodulin-dependent protein kinase in developing rat brain. J Neurosci. 1990;10:1788–1798. doi: 10.1523/JNEUROSCI.10-06-01788.1990. [DOI] [PMC free article] [PubMed] [Google Scholar]
- 12.Colman DR, Kreibich G, Frey AB, Sabatini DD. Synthesis and incorporation of myelin polypeptides into CNS myelin. J Cell Biol. 1982;95:598–608. doi: 10.1083/jcb.95.2.598. [DOI] [PMC free article] [PubMed] [Google Scholar]
- 13.Martin KC, Ephrussi A. mRNA localization: Gene expression in the spatial dimension. Cell. 2009;136:719–730. doi: 10.1016/j.cell.2009.01.044. [DOI] [PMC free article] [PubMed] [Google Scholar]
- 14.Jung H, Gkogkas CG, Sonenberg N, Holt CE. Remote control of gene function by local translation. Cell. 2014;157:26–40. doi: 10.1016/j.cell.2014.03.005. [DOI] [PMC free article] [PubMed] [Google Scholar]
- 15.Oberheim NA, et al. Uniquely hominid features of adult human astrocytes. J Neurosci. 2009;29:3276–3287. doi: 10.1523/JNEUROSCI.4707-08.2009. [DOI] [PMC free article] [PubMed] [Google Scholar]
- 16.Mennerick S, Zorumski CF. Glial contributions to excitatory neurotransmission in cultured hippocampal cells. Nature. 1994;368:59–62. doi: 10.1038/368059a0. [DOI] [PubMed] [Google Scholar]
- 17.Špaček J. Ribosome-associated membrane contacts between astrocytes in the anoxic brain. Acta Neuropathol. 1982;57:270–274. doi: 10.1007/BF00692182. [DOI] [PubMed] [Google Scholar]
- 18.Doyle JP, et al. Application of a translational profiling approach for the comparative analysis of CNS cell types. Cell. 2008;135:749–762. doi: 10.1016/j.cell.2008.10.029. [DOI] [PMC free article] [PubMed] [Google Scholar]
- 19.Nielsen S, et al. Specialized membrane domains for water transport in glial cells: High-resolution immunogold cytochemistry of aquaporin-4 in rat brain. J Neurosci. 1997;17:171–180. doi: 10.1523/JNEUROSCI.17-01-00171.1997. [DOI] [PMC free article] [PubMed] [Google Scholar]
- 20.Dani A, Huang B, Bergan J, Dulac C, Zhuang X. Superresolution imaging of chemical synapses in the brain. Neuron. 2010;68:843–856. doi: 10.1016/j.neuron.2010.11.021. [DOI] [PMC free article] [PubMed] [Google Scholar]
- 21.Danbolt NC, Storm-Mathisen J, Kanner BI. An [Na+ + K+]coupled L-glutamate transporter purified from rat brain is located in glial cell processes. Neuroscience. 1992;51:295–310. doi: 10.1016/0306-4522(92)90316-t. [DOI] [PubMed] [Google Scholar]
- 22.Berger UV, DeSilva TM, Chen W, Rosenberg PA. Cellular and subcellular mRNA localization of glutamate transporter isoforms GLT1a and GLT1b in rat brain by in situ hybridization. J Comp Neurol. 2005;492:78–89. doi: 10.1002/cne.20737. [DOI] [PMC free article] [PubMed] [Google Scholar]
- 23.Schmidt EK, Clavarino G, Ceppi M, Pierre P. SUnSET, a nonradioactive method to monitor protein synthesis. Nat Methods. 2009;6:275–277. doi: 10.1038/nmeth.1314. [DOI] [PubMed] [Google Scholar]
- 24.Gerstner JR, et al. Time of day regulates subcellular trafficking, tripartite synaptic localization, and polyadenylation of the astrocytic Fabp7 mRNA. J Neurosci. 2012;32:1383–1394. doi: 10.1523/JNEUROSCI.3228-11.2012. [DOI] [PMC free article] [PubMed] [Google Scholar]
- 25.Derouiche A, Frotscher M. Peripheral astrocyte processes: Monitoring by selective immunostaining for the actin-binding ERM proteins. Glia. 2001;36:330–341. doi: 10.1002/glia.1120. [DOI] [PubMed] [Google Scholar]
- 26.Thomsen R, Pallesen J, Daugaard TF, Børglum AD, Nielsen AL. Genome wide assessment of mRNA in astrocyte protrusions by direct RNA sequencing reveals mRNA localization for the intermediate filament protein nestin. Glia. 2013;61:1922–1937. doi: 10.1002/glia.22569. [DOI] [PubMed] [Google Scholar]
- 27.Pilaz L-J, Lennox AL, Rouanet JP, Silver DL. Dynamic mRNA transport and local translation in radial glial progenitors of the developing brain. Curr Biol. 2016;26:3383–3392. doi: 10.1016/j.cub.2016.10.040. [DOI] [PMC free article] [PubMed] [Google Scholar]
- 28.Rothstein JD, et al. Knockout of glutamate transporters reveals a major role for astroglial transport in excitotoxicity and clearance of glutamate. Neuron. 1996;16:675–686. doi: 10.1016/s0896-6273(00)80086-0. [DOI] [PubMed] [Google Scholar]
- 29.Chung W-S, et al. Astrocytes mediate synapse elimination through MEGF10 and MERTK pathways. Nature. 2013;504:394–400. doi: 10.1038/nature12776. [DOI] [PMC free article] [PubMed] [Google Scholar]
- 30.Kucukdereli H, et al. Control of excitatory CNS synaptogenesis by astrocyte-secreted proteins Hevin and SPARC. Proc Natl Acad Sci USA. 2011;108:E440–E449. doi: 10.1073/pnas.1104977108. [DOI] [PMC free article] [PubMed] [Google Scholar]
- 31.Christopherson KS, et al. Thrombospondins are astrocyte-secreted proteins that promote CNS synaptogenesis. Cell. 2005;120:421–433. doi: 10.1016/j.cell.2004.12.020. [DOI] [PubMed] [Google Scholar]
- 32.Mayford M, Baranes D, Podsypanina K, Kandel ER. The 3′-untranslated region of CaMKII alpha is a cis-acting signal for the localization and translation of mRNA in dendrites. Proc Natl Acad Sci USA. 1996;93:13250–13255. doi: 10.1073/pnas.93.23.13250. [DOI] [PMC free article] [PubMed] [Google Scholar]
- 33.Andreassi C, Riccio A. To localize or not to localize: mRNA fate is in 3'UTR ends. Trends Cell Biol. 2009;19:465–474. doi: 10.1016/j.tcb.2009.06.001. [DOI] [PubMed] [Google Scholar]
- 34.Condeelis J, Singer RH. How and why does beta-actin mRNA target? Biol Cell. 2005;97:97–110. doi: 10.1042/BC20040063. [DOI] [PubMed] [Google Scholar]
- 35.Han TW, et al. Cell-free formation of RNA granules: bound RNAs identify features and components of cellular assemblies. Cell. 2012;149:768–779. doi: 10.1016/j.cell.2012.04.016. [DOI] [PubMed] [Google Scholar]
- 36.Gruber AR, Lorenz R, Bernhart SH, Neuböck R, Hofacker IL. The Vienna RNA websuite. Nucleic Acids Res. 2008;36:W70–W74. doi: 10.1093/nar/gkn188. [DOI] [PMC free article] [PubMed] [Google Scholar]
- 37.Halassa MM, Fellin T, Takano H, Dong J-H, Haydon PG. Synaptic islands defined by the territory of a single astrocyte. J Neurosci. 2007;27:6473–6477. doi: 10.1523/JNEUROSCI.1419-07.2007. [DOI] [PMC free article] [PubMed] [Google Scholar]
- 38.Medvedev N, et al. Glia selectively approach synapses on thin dendritic spines. Philos Trans R Soc Lond B Biol Sci. 2014;369:20140047. doi: 10.1098/rstb.2014.0047. [DOI] [PMC free article] [PubMed] [Google Scholar]
- 39.McLeay RC, Bailey TL. Motif enrichment analysis: A unified framework and an evaluation on ChIP data. BMC Bioinformatics. 2010;11:165. doi: 10.1186/1471-2105-11-165. [DOI] [PMC free article] [PubMed] [Google Scholar]
- 40.Galarneau A, Richard S. Target RNA motif and target mRNAs of the Quaking STAR protein. Nat Struct Mol Biol. 2005;12:691–698. doi: 10.1038/nsmb963. [DOI] [PubMed] [Google Scholar]
- 41.Sidman RL, Dickie MM, Appel SH. Mutant mice (quaking and jimpy) with deficient myelination in the central nervous system. Science. 1964;144:309–311. doi: 10.1126/science.144.3616.309. [DOI] [PubMed] [Google Scholar]
- 42.Larocque D, et al. Nuclear retention of MBP mRNAs in the quaking viable mice. Neuron. 2002;36:815–829. doi: 10.1016/s0896-6273(02)01055-3. [DOI] [PubMed] [Google Scholar]
- 43.Hardy RJ, et al. Neural cell type-specific expression of QKI proteins is altered in quaking viable mutant mice. J Neurosci. 1996;16:7941–7949. doi: 10.1523/JNEUROSCI.16-24-07941.1996. [DOI] [PMC free article] [PubMed] [Google Scholar]
- 44.Radomska KJ, et al. RNA-binding protein QKI regulates glial fibrillary acidic protein expression in human astrocytes. Hum Mol Genet. 2013;22:1373–1382. doi: 10.1093/hmg/dds553. [DOI] [PubMed] [Google Scholar]
- 45.Greco TM, Seeholzer SH, Mak A, Spruce L, Ischiropoulos H. Quantitative mass spectrometry-based proteomics reveals the dynamic range of primary mouse astrocyte protein secretion. J Proteome Res. 2010;9:2764–2774. doi: 10.1021/pr100134n. [DOI] [PMC free article] [PubMed] [Google Scholar]
- 46.Sharova LV, et al. Database for mRNA half-life of 19 977 genes obtained by DNA microarray analysis of pluripotent and differentiating mouse embryonic stem cells. DNA Res. 2009;16:45–58. doi: 10.1093/dnares/dsn030. [DOI] [PMC free article] [PubMed] [Google Scholar]
- 47.Lie YS, Macdonald PM. Apontic binds the translational repressor Bruno and is implicated in regulation of oskar mRNA translation. Development. 1999;126:1129–1138. doi: 10.1242/dev.126.6.1129. [DOI] [PubMed] [Google Scholar]
- 48.Huang Y-S, Carson JH, Barbarese E, Richter JD. Facilitation of dendritic mRNA transport by CPEB. Genes Dev. 2003;17:638–653. doi: 10.1101/gad.1053003. [DOI] [PMC free article] [PubMed] [Google Scholar]
- 49.Chen KH, Boettiger AN, Moffitt JR, Wang S, Zhuang X. RNA imaging. Spatially resolved, highly multiplexed RNA profiling in single cells. Science. 2015;348:aaa6090. doi: 10.1126/science.aaa6090. [DOI] [PMC free article] [PubMed] [Google Scholar]
- 50.Sun S, et al. Translational profiling identifies a cascade of damage initiated in motor neurons and spreading to glia in mutant SOD1-mediated ALS. Proc Natl Acad Sci USA. 2015;112:E6993–E7002. doi: 10.1073/pnas.1520639112. [DOI] [PMC free article] [PubMed] [Google Scholar]
- 51.Rothstein JD, Van Kammen M, Levey AI, Martin LJ, Kuncl RW. Selective loss of glial glutamate transporter GLT-1 in amyotrophic lateral sclerosis. Ann Neurol. 1995;38:73–84. doi: 10.1002/ana.410380114. [DOI] [PubMed] [Google Scholar]
- 52.Sun M-Y, Izumi Y, Benz A, Zorumski CF, Mennerick S. Endogenous 24S-hydroxycholesterol modulates NMDAR-mediated function in hippocampal slices. J Neurophysiol. 2016;115:1263–1272. doi: 10.1152/jn.00890.2015. [DOI] [PMC free article] [PubMed] [Google Scholar]
- 53.Bates M, Huang B, Dempsey GT, Zhuang X. Multicolor super-resolution imaging with photo-switchable fluorescent probes. Science. 2007;317:1749–1753. doi: 10.1126/science.1146598. [DOI] [PMC free article] [PubMed] [Google Scholar]
- 54.Reddy AS, et al. A comprehensive analysis of cell type-specific nuclear RNA from neurons and glia of the brain. Biol Psychiatry. 2017;81:252–264. doi: 10.1016/j.biopsych.2016.02.021. [DOI] [PMC free article] [PubMed] [Google Scholar]
- 55.Lo HG, et al. A single transcription factor is sufficient to induce and maintain secretory cell architecture. Genes Dev. 2017;31:154–171. doi: 10.1101/gad.285684.116. [DOI] [PMC free article] [PubMed] [Google Scholar]
- 56.Westmark PR, Westmark CJ, Jeevananthan A, Malter JS. Preparation of synaptoneurosomes from mouse cortex using a discontinuous Percoll-sucrose density gradient. J Vis Exp. 2011;55:3196. doi: 10.3791/3196. [DOI] [PMC free article] [PubMed] [Google Scholar]
- 57.Heiman M, et al. A translational profiling approach for the molecular characterization of CNS cell types. Cell. 2008;135:738–748. doi: 10.1016/j.cell.2008.10.028. [DOI] [PMC free article] [PubMed] [Google Scholar]
- 58.Lorenz R, et al. ViennaRNA Package 2.0. Algorithms Mol Biol. 2011;6:26. doi: 10.1186/1748-7188-6-26. [DOI] [PMC free article] [PubMed] [Google Scholar]
- 59.Bailey TL, Johnson J, Grant CE, Noble WS. The MEME suite. Nucleic Acids Res. 2015;43:W39–W49. doi: 10.1093/nar/gkv416. [DOI] [PMC free article] [PubMed] [Google Scholar]
- 60.Dougherty JD, et al. Candidate pathways for promoting differentiation or quiescence of oligodendrocyte progenitor-like cells in glioma. Cancer Res. 2012;72:4856–4868. doi: 10.1158/0008-5472.CAN-11-2632. [DOI] [PMC free article] [PubMed] [Google Scholar]
- 61.Okaty BW, Sugino K, Nelson SB. A quantitative comparison of cell-type-specific microarray gene expression profiling methods in the mouse brain. PLoS One. 2011;6:e16493. doi: 10.1371/journal.pone.0016493. [DOI] [PMC free article] [PubMed] [Google Scholar]
- 62.Dougherty JD, Schmidt EF, Nakajima M, Heintz N. Analytical approaches to RNA profiling data for the identification of genes enriched in specific cells. Nucleic Acids Res. 2010;38:4218–4230. doi: 10.1093/nar/gkq130. [DOI] [PMC free article] [PubMed] [Google Scholar]
- 63.Ike H, et al. Mechanism of Lck recruitment to the T-cell receptor cluster as studied by single-molecule-fluorescence video imaging. ChemPhysChem. 2003;4:620–626. doi: 10.1002/cphc.200300670. [DOI] [PubMed] [Google Scholar]
- 64.Klein RL, King MA, Hamby ME, Meyer EM. Dopaminergic cell loss induced by human A30P alpha-synuclein gene transfer to the rat substantia nigra. Hum Gene Ther. 2002;13:605–612. doi: 10.1089/10430340252837206. [DOI] [PubMed] [Google Scholar]
- 65.Zolotukhin S, et al. Production and purification of serotype 1, 2, and 5 recombinant adeno-associated viral vectors. Methods. 2002;28:158–167. doi: 10.1016/s1046-2023(02)00220-7. [DOI] [PubMed] [Google Scholar]
- 66.Li Z, Zhang Y, Li D, Feng Y. Destabilization and mislocalization of myelin basic protein mRNAs in quaking dysmyelination lacking the QKI RNA-binding proteins. J Neurosci. 2000;20:4944–4953. doi: 10.1523/JNEUROSCI.20-13-04944.2000. [DOI] [PMC free article] [PubMed] [Google Scholar]
- 67.Calabretta S, Richard S. Emerging roles of disordered sequences in RNA-binding proteins. Trends Biochem Sci. 2015;40:662–672. doi: 10.1016/j.tibs.2015.08.012. [DOI] [PubMed] [Google Scholar]
Associated Data
This section collects any data citations, data availability statements, or supplementary materials included in this article.


