Significance
Death-driven compensatory proliferation to repair tissue defects is an important promoter of inflammation-associated carcinogenesis. Our work using a mouse model demonstrates that a biliary epithelial injury-induced regenerative response mediated by IL-33 accelerates development of extrahepatic cholangiocarcinoma (ECC) from peribiliary glands, an effect that was suppressed by anti–IL-33 treatment. Thus, IL-33 is a potential therapeutic target for ECC, and the mouse model reported in this study will enable identification of the mechanisms of biliary injury-based carcinogenesis.
Keywords: extrahepatic cholangiocarcinoma, IL-33, organoid, ILC2, amphiregulin
Abstract
The carcinogenic mechanism of extrahepatic cholangiocarcinoma (ECC) is unclear, due at least in part to the lack of an appropriate mouse model. Because human studies have reported frequent genetic alterations in the Ras- and TGFβ/SMAD-signaling pathways in ECC, mice with tamoxifen-inducible, duct-cell–specific Kras activation and a TGFβ receptor type 2 (TGFβR2) deletion were first generated by crossing LSL-KrasG12D, Tgfbr2flox/flox, and K19CreERT mice (KT-K19CreERT). However, KT-K19CreERT mice showed only mild hyperplasia of biliary epithelial cells (BECs) in the extrahepatic bile duct (EHBD) and died within 7 wk, probably a result of lung adenocarcinomas. Next, to analyze the additional effect of E-cadherin loss, KT-K19CreERT mice were crossed with CDH1flox/flox mice (KTC-K19CreERT). Surprisingly, KTC-K19CreERT mice exhibited a markedly thickened EHBD wall accompanied by a swollen gallbladder within 4 wk after tamoxifen administration. Histologically, invasive periductal infiltrating-type ECC with lymphatic metastasis was observed. Time-course analysis of EHBD revealed that recombined BECs lining the bile duct lumen detached due to E-cadherin loss, whereas recombined cells could survive in the peribiliary glands (PBGs), which are considered a BEC stem-cell niche. Detached dying BECs released high levels of IL-33, as determined by microarray analysis using biliary organoids, and stimulated inflammation and a regenerative response by PBGs, leading eventually to ECC development. Cell lineage tracing suggested PBGs as the cellular origin of ECC. IL-33 cooperated with Kras and TGFβR2 mutations in the development of ECC, and anti–IL-33 treatment suppressed ECC development significantly. Thus, this mouse model provided insight into the carcinogenic mechanisms, cellular origin, and potential therapeutic targets of ECC.
Cholangiocarcinoma (CC) is a highly malignant tumor with features of bile duct (BD) epithelial differentiation, the incidence of which is increasing worldwide (1). CC is classified according to anatomical location—intrahepatic and extrahepatic cholangiocarcinoma (ICC and ECC, respectively). ECC is further divided into hilar and distal CC, depending on the insertion site of the cystic duct. Further classification of ICC and ECC is based on tumor morphology: mass-forming (nodular), periductal-infiltrating (sclerosing), and intraductal-growing (papillary) CC (2). Although most CC cases arise sporadically, several risk factors have been established, including primary sclerosing cholangitis (PSC), liver flukes, hepatitis viral infection, hepatolithiasis, and congenital abnormalities of the pancreatic and biliary ducts (1). Most of these conditions create chronic inflammation in the biliary tree and liver; therefore, chronic inflammation plays a key role in CC development. However, the exact mechanism of inflammation-associated cholangiocarcinogenesis is unclear.
Recent next-generation sequencing technology has enabled comprehensive mutational profiling of CC and has shown that the mutational spectrum differs according to anatomical subtype and underlying etiology (3, 4). In the embryonic stage, the extrahepatic bile duct (EHBD) develops from the embryonic hepatic diverticulum, whereas the intrahepatic bile duct (IHBD) originates within the liver from the ductal plate (5). Therefore, the IHBD and EHBD may exhibit distinct properties and different carcinogenetic processes. Although at present, the same chemotherapeutic strategy is used for CC irrespective of the underlying etiology and anatomical subtype, personalized approaches should be explored.
The cellular origin of CC is also a topic of interest. Although CC is considered to originate from biliary epithelial cells (BECs), recent studies have suggested that multiple cell types could develop into CC (6–8). For example, hepatocytes can transdifferentiate into biliary cells through activation of Notch signaling and eventually give rise to ICC (6, 7). With regard to the EHBD, recent anatomical and immunohistochemical (IHC) analyses revealed that peribiliary glands (PBGs), clusters of epithelial cells residing in the submucosal compartment of the EHBD, form epithelial networks within the walls of EHBDs and might function as BEC stem-cell niches. Therefore, PBGs have attracted attention as a candidate for the origin of ECC (9, 10). However, no conclusive evidence is available.
An appropriate mouse model is indispensable for understanding the molecular pathogenesis and identifying the cellular origin of cancer, as well as for exploring new therapeutic targets. Several useful mouse models of ICC have been established recently (6–8, 11, 12). However, because most of these models were generated by liver-specific gene manipulation or application of hepatotoxins, CC was limited to the intrahepatic or perihilar area. The lack of an appropriate mouse model has hampered investigation of ECC carcinogenesis. Therefore, in this study, a mouse model of inflammation-based ECC was established by duct-cell–specific gene manipulation and was used to investigate carcinogenic mechanisms and identify therapeutic targets.
Results
Generation of Mice Exhibiting Duct-Cell–Specific Kras Activation and TGFβ Receptor Type 2 Inactivation.
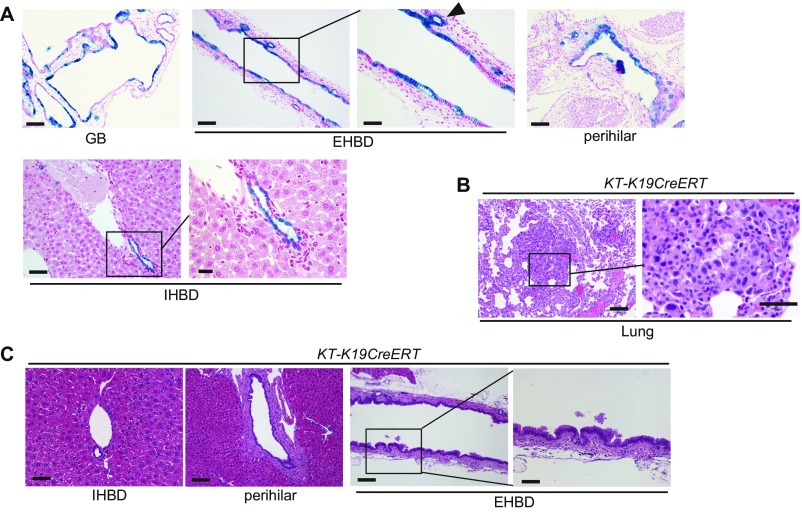
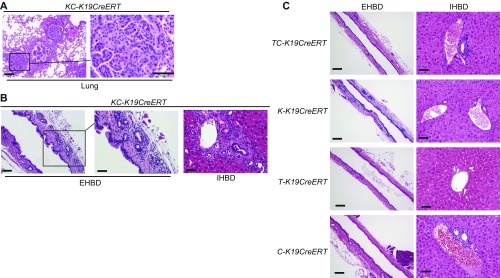
To induce duct-cell–specific gene manipulation, we used K19CreERT mice, in which tamoxifen (TAM)-inducible Cre ERT was knocked into the endogenous K19 locus (13). K19CreERT mice were crossed with Rosa26-Lox-Stop-Lox(LSL)-LacZ reporter mice (LacZ-K19CreERT), and oral administration of 200 mg/kg TAM for 3 consecutive days was confirmed to induce efficient gene recombination (∼40%) in all parts of the biliary tree, including the EHBD, PBGs, gallbladder (GB), perihilar BD, and IHBD, on day 7 (Fig. S1A). Because recent human studies have reported frequent genetic alterations of Ras and TGFβ/SMAD-signaling pathways in ICC and ECC (4), mice exhibiting duct-cell–specific Kras activation and TGFβ receptor type 2 (TGFβR2) inactivation were generated by crossing LSL-KrasG12D, Tgfbr2flox/flox, and K19CreERT mice (KT-K19CreERT) (14). However, all KT-K19CreERT mice died within 7 wk after TAM administration, probably due to respiratory failure caused by lung adenocarcinomas (n = 15) (Fig. S1B), and only mild hyperplasia of BECs in the EHBD was observed in the biliary tree at this time point (Fig. S1C). Thus, additional hits were deemed necessary to induce ECC in vivo.
Fig. S1.
Mice with duct-cell–specific Kras activation and TGFβR2 inactivation do not develop CC. (A) LacZ-stained images of the liver and biliary tree of LacZ-K19CreERT mice on day 7 after TAM administration. (Scale bar: GB, 100 μm; EHBD Left panel, 100 μm; EHBD Right panel, 50 μm; perihilar, 100 μm; IHBD Left panel, 50 μm; IHBD Right panel, 20 μm.) The arrowhead indicates a PBG. (B) H&E-stained images of the lung from KT-K19CreERT mice 6.5 wk after TAM administration. (Scale bar: Left panel, 100 μm; Right panel, 50 μm.) (C) H&E-stained images of the IHBD, perihilar BD, and EHBD of KT-K19CreERT mice at 6.5 wk after TAM administration. (Scale bar: IHBD and high-magnification view of the EHBD, 50 μm; perihilar and low-magnification view of the EHBD, 100 μm.)
Loss of E-Cadherin in Combination with Mutation of Kras and TGFβR2 Results in the Development of ECC.
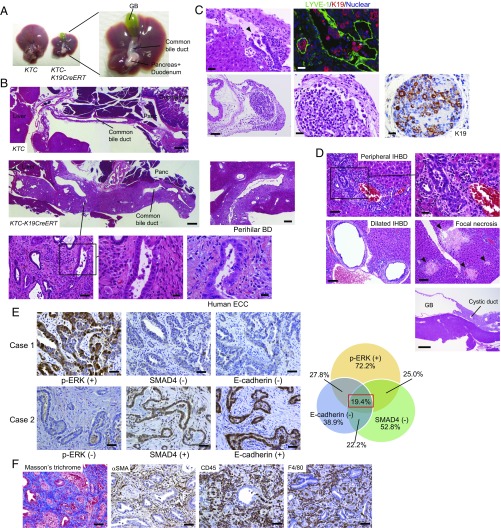
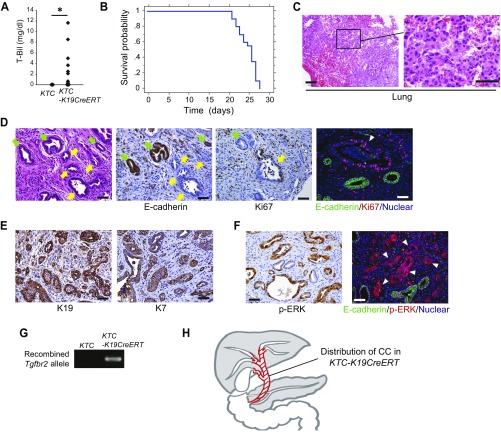
E-cadherin, encoded by the CDH1 gene, is an important adhesion molecule whose loss is associated with poor prognosis in various cancers, including ECC (15, 16). We reported previously that liver-specific deletion of E-cadherin significantly promoted liver cancer development in mice (17). Thus, the effect of E-cadherin deletion in addition to Kras activation and TGFβR2 deletion on the biliary tree was analyzed by crossing KT-K19CreERT mice with CDH1flox/flox mice (KTC-K19CreERT). Surprisingly, 90% of KTC-K19CreERT mice (18/20) exhibited a markedly thickened EHBD wall accompanied by a swollen GB within 4 wk after TAM administration (Fig. 1A). In addition, 30% of KTC-K19CreERT mice showed apparent jaundice, sometimes accompanied by hepatic atrophy, and serum levels of total bilirubin were significantly elevated compared with those of TAM-administered control Cre-negative LSL-KrasG12D;Tgfbr2flox/flox;CDH1flox/flox (KTC) mice (Fig. 1A and Fig. S2A). All KTC-K19CreERT mice died within 4 wk after TAM administration, mainly from liver failure or respiratory failure caused by lung adenocarcinomas (Fig. S2 B and C). Because this EHBD phenotype was more stable in male (10/10, 100%) than in female mice (8/10, 80%), male mice were used in subsequent experiments.
Fig. 1.
Loss of E-cadherin in combination with mutation of Kras and TGFβR2 results in the development of ECC. (A) Representative images of the liver and bile duct of KTC and KTC-K19CreERT mice at 3.5 wk after TAM administration. (B) H&E-stained images of sagittal sections of the EHBD of KTC and KTC-K19CreERT mice. (Scale bar: low magnification, 500 μm; middle magnification, 100 μm; high magnification, 20 μm.) H&E-stained images of sagittal sections of the perihilar BD of KTC-K19CreERT mice. (Scale bar: 200 μm.) H&E-stained image of human ECC is also shown. (Scale bar: 20 μm.) (C) Upper panels show invasion by poorly differentiated cancer cells of the lymphatic vessels (Left: H&E-staining; Right: double IF staining of LYVE-1 and K19). (Scale bar: 20 μm.) Lower panels show H&E and IHC images of K19 in regional lymph node metastasis. (Scale bar: Left panel, 100 μm; two Right panels, 20 μm.) Arrowhead indicates lymphatic invasion by cancer cells. (D) H&E-stained images of the peripheral IHBD (scale bar: Left panel, 50 μm; Right panel, 20 μm), dilated IHBD, focal necrosis of the liver parenchyma (Scale bar: 100 μm), and the GB and cystic duct (Scale bar: 500 μm) of KTC-K19CreERT mice. (E) IHC analyses of expression of phospho-ERK, SMAD4, and E-cadherin using 36 surgically resected human ECC samples. Representative images of two patients are shown. (Scale bar: 50 μm.) Case 1 exhibits an expression pattern similar to the mouse model. Venn diagram shows the overlap among indicated categories. (F) ECC microenvironment in KTC-K19CreERT mice. (Left) Masson’s trichrome staining. The other panels show IHC analyses of the indicated proteins. (Scale bar: 50 μm.)
Fig. S2.
Characterization of ECC developed in KTC-K19CreERT mice. (A) Serum levels of total bilirubin in KTC mice at 3.5 wk after TAM administration and in KTC-K19CreERT mice euthanized because of severe sickness (KTC, n = 10; KTC-K19CreERT, n = 20). *P < 0.05. (B) Survival curve of KTC-K19CreERT mice after TAM administration (n = 20). (C) H&E-stained images of the lung from KTC-K19CreERT mice 3.5 wk after TAM administration. (Scale bar: Left panel, 100 μm; Right panel, 50 μm.) (D) The left three panels show H&E staining and IHC staining of E-cadherin and Ki67 expression in serial sections of ECC tissue from KTC-K19CreERT mice. (Scale bar: 50 μm.) Yellow arrows indicate cancer glands, and green arrows indicate normal PBGs. The Right panel shows double IF staining of E-cadherin and Ki67. (Scale bar: 50 μm.) Arrowhead indicates an E-cadherin–negative/Ki67-positive cancer gland. (E) IHC of K19 and K7 in ECC tissue from KTC-K19CreERT mice. (Scale bar: 50 μm.) (F) IHC of phospho-ERK and double IF staining of E-cadherin and phospho-ERK in ECC tissue from KTC-K19CreERT mice. (Scale bar: 50 μm.) (G) PCR detection of floxed Tgfbr2 allele recombination in the ECC tissue of KTC-K19CreERT mice, but not EHBD in Cre-negative control mice. (H) The figure shows the distribution of CC in KTC-K19CreERT mice (red area).
Histologically, moderately differentiated adenocarcinoma cells resembling human ECC expanded along the EHBD wall, and infiltration of adenocarcinoma extended to the intrahepatic hilar area including a large IHBD (Fig. 1B). Cancer glands and normal PBGs coexisted in the thickened EHBD tissue, and cancer glands were negative for E-cadherin and frequently positive for the proliferative marker Ki67, unlike normal PBGs (Fig. S2D), suggesting that cancer glands spread through the PBG network. Cancer cells were positive for the biliary markers K7 and K19 and positive for phospho-ERK, which was in line with Kras activation (Fig. S2 E and F). Recombination of the Tgfbr2 allele in ECC tissue was confirmed by PCR (Fig. S2G). Additionally, poorly differentiated adenocarcinomas were observed frequently, and such cells invaded lymphatic vessels, as confirmed by double staining of K19 and the lymphatic marker LYVE-1, and metastasized to regional lymph nodes (Fig. 1C). In contrast, the peripheral small IHBD revealed dysplastic changes in cholangiocytes with inflammatory cell infiltration and ductular reaction, but mass-forming peripheral-type ICC, as reported in other mouse models of ICC, did not develop (8, 11) (Fig. 1D). KTC-K19CreERT mice with biliary obstruction by ECC revealed markedly dilated IHBDs and focal necrosis of the liver parenchyma as seen in a mouse model of common bile duct (CBD) ligation (18) (Fig. 1D). Interestingly, the cystic duct showed wall thickening due to adenocarcinoma infiltration, whereas the GB was almost intact (Fig. 1D), suggesting that the sensitivity to these mutations differs depending on the location in the biliary tree (Fig. S2H). Thus, KTC-K19CreERT mice exhibited periductal infiltrating-type ECC with lymphatic metastasis.
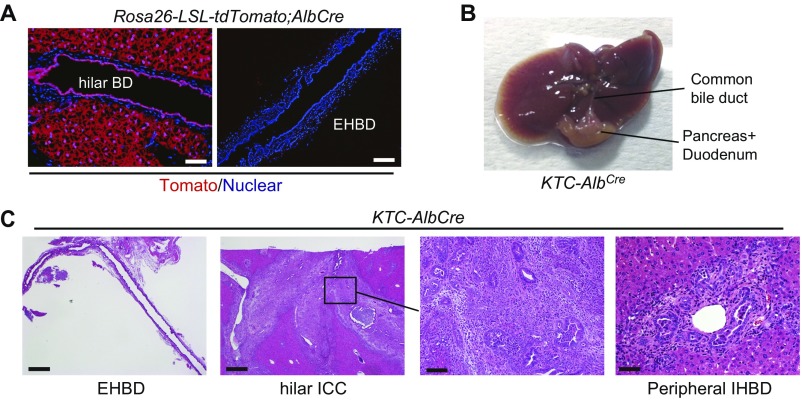
To confirm that ECC in KTC-K19CreERT mice was not due to infiltration of hilar ICC but originated from the EHBD, KTC mice were crossed with Albumin-Cre mice (KTC-AlbCre) in which Cre was expressed in hepatocytes and intrahepatic BECs but not in extrahepatic BECs (Fig. S3A). KTC-AlbCre mice exhibited hilar CC and dysplastic changes in the peripheral IHBD with inflammation at 8 wk of age, whereas the EHBD was intact until 4 mo of age (Fig. S3 B and C). Therefore, ECC in KTC-K19CreERT mice originated from the EHBD.
Fig. S3.
KTC-AlbCre mice develop hilar CC but not ECC. (A) Cre expression in AlbCre mice was confirmed by crossing AlbCre mice with LSL-Rosa26-tdTomato reporter mice. (Scale bar: Left panels, 50 μm; Right panels, 100 μm.) (B) Representative macroscopic images of the liver and bile duct of 8-wk-old KTC-AlbCre mice. (C) H&E-stained images of the EHBD, hilar BD, and peripheral IHBD of KTC-AlbCre mice. (Scale bar: Left panels, 500 μm; higher magnification of hilar ICC, 100 μm; peripheral IHBD, 50 μm.)
We also analyzed the expression of phospho-ERK, SMAD4, and E-cadherin using IHC in 36 surgically resected human ECC samples, and 19.4% (7/36) of patients exhibited a similar expression pattern as that of our mouse model (phospho-ERK–positive, SMAD4-negative, and E-cadherin–negative) (Fig. 1E).
Human CC is frequently accompanied by a desmoplastic reaction and inflammatory cell infiltration, which support carcinogenesis through release of humoral factors from cancer-associated fibroblasts and macrophages (1). Masson’s trichrome staining showed collagen deposition in the tumor tissue of KTC-K19CreERT mice, and IHC analysis of α-smooth muscle actin confirmed the accumulation of fibroblasts (Fig. 1F). Many CD45-positive immune cells, including F4/80-positive macrophages, also infiltrated the tumor stroma (Fig. 1F). Thus, ECC in KTC-K19CreERT mice mimicked the human tumor microenvironment.
Mutations of Kras, TGFβR2, and E-Cadherin Are All Required for ECC Development.
The phenotypes of LSL-KrasG12D;CDH1flox/flox;K19CreERT mice (KC-K19CreERT) and Tgfbr2flox/flox;CDH1flox/flox;K19CreERT mice (TC-K19CreERT) were evaluated (n = 10, each). All KC-K19CreERT mice died within 15 wk after TAM administration, probably because of lung adenocarcinomas (Fig. S4A). At this time point, KC-K19CreERT mice revealed dysplastic changes in the hilar and peripheral IHBD with inflammatory cell infiltration, whereas only slightly increased numbers of PBGs with mild inflammation were found in the EHBD (Fig. S4B). TC-K19CreERT mice also died within 5 mo after TAM administration for unknown reasons and did not develop biliary tumors during their lifetimes (Fig. S4C). Moreover, mice with a single genetic manipulation, i.e., LSL-KrasG12D;K19CreERT mice (K-K19CreERT), Tgfbr2flox/flox;K19CreERT mice (T-K19CreERT), and CDH1flox/flox;K19CreERT mice (C-K19CreERT), were monitored for up to 6 mo after TAM administration (n = 10, each), but no biliary tumor of any type was observed (Fig. S4C). Thus, genetic manipulations of Kras, TGFβR2, and E-cadherin are all required for ECC development.
Fig. S4.
Histology of the biliary tree of KC-K19CreERT mice. H&E-stained images of the lung (A) and of the EHBD and IHBD (B) of KC-K19CreERT mice at 15 wk after TAM administration. (Scale bar in A: Left panel, 100 μm; Right panel, 50 μm; in B: Left panel, 100 μm; Middle and Right panels, 50 μm.) (C) H&E-stained images of the EHBD and IHBD of TC-K19CreERT mice (5 mo after TAM administration), K-K19CreERT mice, T-K19CreERT mice, and C-K19CreERT mice (6 mo after TAM administration). (Scale bar: EHBD, 100 μm; IHBD, 50 μm.)
E-Cadherin–Deleted Biliary Cells Are Lost from the Surface of the EHBD Lumen but Remain in PBGs.
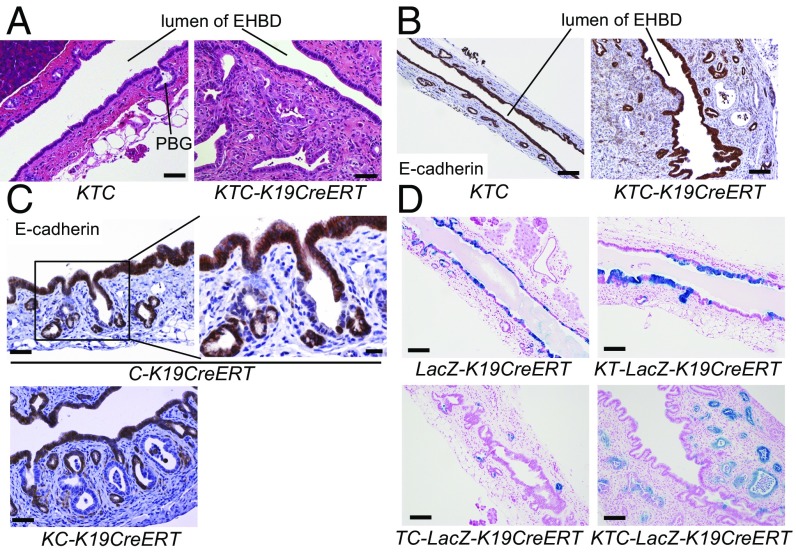
Interestingly, in KTC-K19CreERT mice, cancer cells extended laterally through the subepithelial connective tissue of the EHBD, whereas most surface BECs lining the EHBD lumen were intact (Fig. 2A). In fact, IHC analysis of E-cadherin revealed that E-cadherin–deleted BECs were no longer present among surface BECs at 3.5 wk after TAM administration (Fig. 2B). Of note, in C-K19CreERT and KC-K19CreERT mice, E-cadherin–deleted cells were not present among the surface BECs of the EHBD but were detected in the PBGs at 3.5 wk after TAM administration (Fig. 2C). Furthermore, Rosa26-LSL-LacZ mice were crossed with KTC-K19CreERT mice (KTC-LacZ-K19CreERT) or TC-K19CreERT mice (TC-LacZ-K19CreERT), and recombined cells were labeled with LacZ. At 3.5 wk after TAM administration in KTC-LacZ-K19CreERT mice, LacZ was expressed in most cancer cells but in few surface BECs (Fig. 2D). Also in TC-LacZ-K19CreERT mice, LacZ+ cells were few in the surface BECs but remained in the PBGs (Fig. 2D). In contrast, LacZ-K19CreERT mice and KT-K19CreERT mice crossed with Rosa26-LSL-LacZ mice (KT-LacZ-K19CreERT), in which E-cadherin was not deleted in BECs, retained many LacZ+ cells in the surface BECs at the same time point (Fig. 2D). Based on these findings, we considered that E-cadherin–deleted surface BECs might not survive for long periods and that the remaining recombined cells in the PBGs might give rise to ECC.
Fig. 2.
E-cadherin–deleted biliary cells are lost from the luminal surface of the EHBD but remain in PBGs. H&E staining (A) and IHC of E-cadherin (B) in the EHBD in KTC and KTC-K19CreERT mice at 3.5 wk after TAM administration. (Scale bar: A, 50 μm; B, 100 μm.) (C) IHC analysis of E-cadherin in the EHBD of C-K19CreERT and KC-K19CreERT mice at 3.5 wk after TAM administration. (Scale bar: Left panels, 50 μm; Right panel, 20 μm.) (D) LacZ-stained image of the EHBD from the indicated mice at 3.5 wk after TAM administration. (Scale bar: 100 μm.)
Time Course of Histological Progression of ECC.
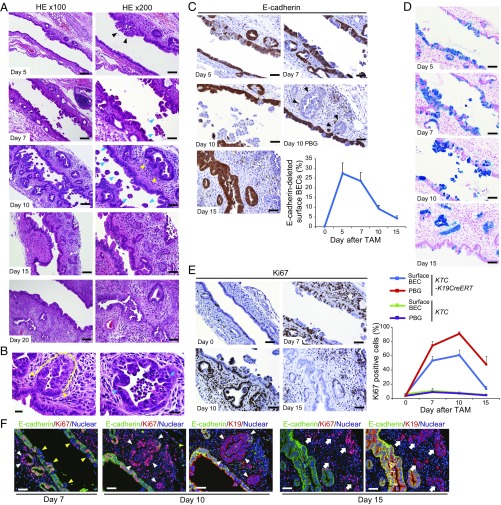
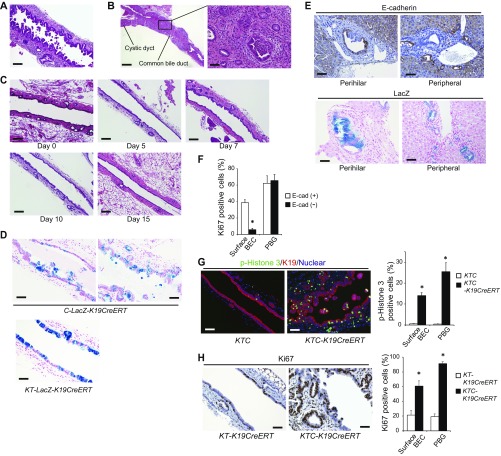
To assess this hypothesis, the time course of histological changes in the EHBD of KTC-K19CreERT mice after TAM administration was analyzed. On day 5, although the EHBD was mostly normal, the alignment of the surface BECs was partially disrupted (Fig. 3A). On day 7, surface BECs started to detach from the BD wall, and on day 10, many shedding BECs were observed in the BD lumen, and inflammatory cells had infiltrated the subepithelial connective tissue (Fig. 3A). The inflammatory reaction was seen throughout the entire EHBD but was slightly dominant in the upper CBD. (Fig. 3A and Fig. S5A). Notably, the PBGs were enlarged and morphologically dysplastic and accompanied by mitotic figures (Fig. 3 A and B). On day 15, although the shedding of surface BECs had subsided, the cancerous glands spread through the subepithelial area, accompanied by a fibrotic response (Fig. 3A). Wall thickening due to cancerous glands was dominantly seen around the insertion site of the cystic duct, where PBGs are abundant (Fig. S5B). Most of the histological features of periductal infiltrating-type ECC were completed by day 20 (Fig. 3A). In contrast, TAM-administered Cre-negative KTC mice did not show histological changes in the EHBD during this period (Fig. S5C).
Fig. 3.
Histological progression of ECC. (A) H&E-stained images of the EHBD (middle to upper area of CBD) of KTC-K19CreERT mice after TAM administration at the indicated time points. (Scale bar: Left panels, 100 μm; Right panels, 50 μm.) Black arrowheads, disrupted epithelial alignment; blue arrowheads, BECs detaching from the bile duct epithelium; yellow arrowheads, enlarged and dysplastic PBGs. (B) High-magnification images of PBGs in KTC-K19CreERT mice on day 10. (Scale bar: 20 μm.) Yellow dashed line represents dysplastic cells in the PBGs, and yellow arrowheads indicate the border between the dysplastic PBG cells and normal surface BECs. Blue arrowheads indicate mitotic cells. (C) Time course of E-cadherin expression in the EHBD of KTC-K19CreERT mice after TAM administration. (Scale bar: 50 μm.) Black arrowheads indicate E-cadherin–negative PBGs. Line graph shows percentage of E-cadherin–deleted BECs on the luminal surface of the EHBD of KTC-K19CreERT mice after TAM administration (means ± SD, n = 3 per time point). (D) LacZ-stained images of the EHBD of KTC-LacZ-K19CreERT mice at various time points after TAM administration. (Scale bar: 50 μm.) (E) Ki67 expression in the EHBD of KTC-K19CreERT mice at various time points after TAM administration. (Scale bar: 50 μm.) Line graph shows percentage of Ki67-positive cells in the EHBD of KTC and KTC-K19CreERT mice after TAM administration (means ± SD, n = 3 per time point). Surface BECs and PBGs were analyzed separately. (F) Double IF-stained images of E-cadherin and Ki67 in the EHBD of KTC-K19CreERT mice after TAM administration. (Scale bar: 50 μm.) To locate the E-cadherin–deleted duct cells, double IF-stained images of E-cadherin and K19 in serial sections from mice killed on days 10 and 15 are shown. Yellow arrowheads, E-cadherin–deleted nonproliferating surface BECs; white arrowheads, E-cadherin–deleted proliferating cells in PBGs; white arrows, E-cadherin–deleted proliferating cancerous glands.
Fig. S5.
Histology of the EHBD after TAM administration. (A) H&E-stained image of the lower area of the CBD of KTC-K19CreERT mice on day 10 after TAM administration. (Scale bar: 100 μm.) (B) Representative H&E-stained images of the EHBD of KTC-K19CreERT mice on day 15 after TAM administration. (Scale bar: Left panel, 500 μm; Right panel, 50 μm). Wall thickening due to cancerous glands was evident predominantly around the insertion site of the cystic duct. (C) H&E-stained images of the EHBD of KTC mice after TAM administration at the indicated time points. (Scale bar: 100 μm.) (D) LacZ-stained images of the EHBD of C-LacZ-K19CreERT and KT-LacZ-K19CreERT mice on day 10 after TAM administration. (Scale bar: 50 μm.) (E) Upper panels show IHC staining of E-cadherin in the hilar BD and peripheral IHBD of KTC-K19CreERT mice, and Lower panels show LacZ staining in the hilar BD and peripheral IHBD of KTC-LacZ-K19CreERT mice at 3.5 wk after TAM administration. (Scale bar: 50 μm.) (F) Quantitative analysis of Ki67-positive cells among E-cadherin–positive and –negative cells in the EHBD of KTC-K19CreERT mice on day 7. Bar graph shows the frequencies of Ki67-positive cells (means ± SD; n = 3 per group). *P < 0.05. (G) Double IF staining of phospho-histone 3 and K19 in the EHBD of KTC and KTC-K19CreERT mice on day 10 after TAM administration. (Scale bar: 50 μm.) Bar graph shows the frequencies of phospho-Histone 3-positive cells among the surface BECs and in PBGs (n = 3 per group). Data are means ± SD. *P < 0.05. (H) IHC staining of Ki67 in the EHBD from KT-K19CreERT and KTC-K19CreERT mice on day 10 after TAM administration. (Scale bar: 50 μm.) Bar graph shows the frequencies of Ki67-positive cells among the surface BECs and in PBGs (n = 3 per group).
Next, the time course of E-cadherin expression in BECs was assessed by IHC. E-cadherin was deleted in ∼30% of surface BECs and PBGs on day 5 and efficiently deleted in the area with disrupted epithelial alignment (Fig. 3C). On day 10, many E-cadherin–deleted surface BECs were falling into the BD lumen, and as a consequence, the number of E-cadherin–deleted surface BECs was decreased (Fig. 3C). In contrast, the PBGs retained many E-cadherin–deleted cells, and some PBGs were replaced completely by E-cadherin–negative cells (Fig. 3C). On day 15, most surface BECs had been replaced by E-cadherin–positive cells, whereas E-cadherin–negative cancerous glands had spread in the subepithelial area (Fig. 3C). Additionally, recombined cells were monitored by LacZ staining using KTC-LacZ-K19CreERT mice. As expected, the timing of the series of events in LacZ+ cells was similar to that in E-cadherin–negative cells (Fig. 3D). Furthermore, C-K19CreERT mice crossed with Rosa26-LSL-LacZ mice (C-LacZ-K19CreERT) showed detachment of LacZ+ BECs on day 10, whereas KT-LacZ-K19CreERT mice did not, indicating that loss of E-cadherin was responsible for the detachment of BECs (Fig. S5D). On the other hand, the perihilar and peripheral IHBD in KTC-K19CreERT mice retained E-cadherin–deleted/LacZ+ surface BECs at 3.5 wk after TAM administration (Fig. S5E), although the reason for the difference between the EHBD and IHBD was unclear.
Next, cell proliferation was analyzed by Ki67 staining. On day 7, the number of Ki67-positive cells among both the surface BECs and PBGs increased significantly, probably reflecting a regenerative response to the biliary epithelial injury (Fig. 3E). Double staining of E-cadherin and Ki67 revealed that cells in the PBGs were highly proliferative irrespective of their E-cadherin expression, whereas the majority of proliferating surface BECs were E-cadherin–positive (Fig. 3F and Fig. S5F). Furthermore, on day 10, a more marked proliferative response was observed, especially in PBGs, including E-cadherin–deleted PBGs (Fig. 3 E and F). Hyperproliferative response in KTC-K19CreERT mice was confirmed by immunostaining of the mitotic marker phospho-histone 3 (Fig. S5G). Additionally, the number of Ki67-positive cells in KTC-K19CreERT mice was much higher than that in KT-K19CreERT mice at the same time point (Fig. S5H), further supporting the contribution of E-cadherin loss-induced biliary epithelial injury to the hyperproliferative response in KTC-K19CreERT mice. On day 15, the number of Ki67-positive BECs decreased significantly, whereas E-cadherin–negative cancerous glands were highly proliferative (Fig. 3 E and F). Thus, E-cadherin–deleted surface BECs detached from the wall of the EHBD, which induced a regenerative response by PBGs. Recombined cells survived among PBGs, which were thus likely the cellular origins of ECC.
Establishment of Biliary Organoid-Derived Cancer Model.
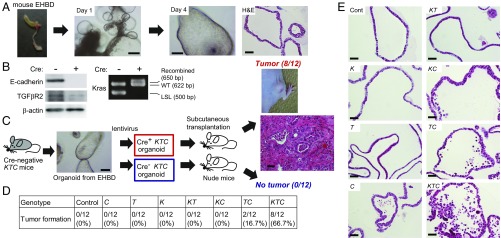
To further elucidate the molecular mechanisms of ECC development in KTC-K19CreERT mice, we cultured the biliary organoid from the EHBD of Cre-negative KTC mice (19) and induced gene recombination using a lentivirus expressing Cre-recombinase (Cre+ KTC organoid) or a control lentivirus (Cre− KTC organoid) (Fig. 4A). As shown in Fig. 4B, lentivirus efficiently induced gene recombination. Then Cre+ KTC organoids and Cre− KTC organoids were transplanted subcutaneously into nude mice. Two months later, 66.7% (8/12) of Cre+ KTC organoids formed s.c. tumors with a histology similar to that of ECC in KTC-K19CreERT mice, whereas none (0/12) of the Cre− KTC organoids formed tumors (Fig. 4C), indicating that Cre+ KTC organoids possess a tumorigenic ability similar to that of the in vivo model. Furthermore, the tumorigenic abilities of the biliary organoids derived from K, T, C, KT, KC, and TC mice, in which recombination was induced by lentivirus infection, were evaluated in the same way. As shown in Fig. 4D, none of the organoids, with the exception of 2/12 (16.7%) TC organoids, produced s.c. tumors, suggesting that mutations in Kras, TGFβR2, and E-cadherin cooperatively promote tumorigenesis also in the organoid-derived cancer model. Cre+ KTC organoids also formed s.c. tumors in syngeneic C57BL/6 mice (5/8, 62.5%) (Fig. S6A). Of particular interest, as was the case in vivo, hematoxylin and eosin (H&E) staining of organoids revealed loss of E-cadherin–induced BECs shedding, which was most evident in KTC organoids (Fig. 4E). Thus, this system recreates the in vivo conditions and facilitates analysis of carcinogenesis induced by genetic manipulations in BECs separately from the tumor microenvironment.
Fig. 4.
Establishment of biliary organoid-derived cancer. (A) Micrograph and H&E-stained image of biliary organoids cultured from the EHBD of mice. (Scale bar: micrographs, 250 μm; H&E staining, 50 μm.) (B) Confirmation of recombination by Cre-expressing lentivirus in organoids from KTC mice. The indicated proteins were assessed by Western blot. Cre-mediated recombination of the LSL-Kras allele was confirmed by PCR. (C) Biliary organoids from the EHBD of KTC mice were infected with Cre-expressing or control lentivirus and then transplanted subcutaneously into nude mice. An H&E-stained image of an organoid-derived tumor is shown. (Scale bar: 50 μm.) (D) EHBD organoids from the indicated mice were infected with lentivirus and then transplanted subcutaneously into nude mice. Tumor formation was assessed 2 mo after transplantation. (E) H&E-stained images of EHBD organoids from the indicated mice after gene recombination. (Scale bar: 50 μm.)
Fig. S6.
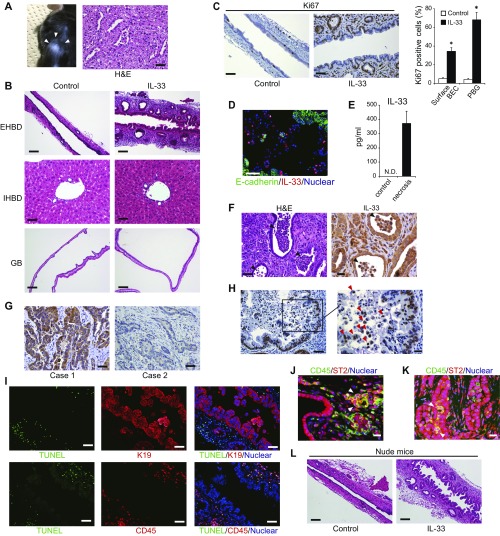
Effects of IL-33 on BEC proliferation. (A) Photograph and H&E-stained image of the KTC organoid-derived s.c. tumor that developed in C57BL/6 mice. (B) H&E-stained images of the EHBD, IHBD, and GB of WT mice on day 5 after IL-33 administration. (Scale bar: EHBD and GB, 100 μm; IHBD, 50 μm.) (C) IHC of Ki67 in the EHBD of WT mice on day 5 after IL-33 administration. (Scale bar: 50 μm.) (D) Double IF staining of E-cadherin and IL-33 in the EHBD from KTC-K19CreERT mice on day 10 after TAM administration. (Scale bar: 50 μm.) (E) IL-33 protein concentrations in culture supernatants of KTC-BO cells were measured by ELISA. Supernatants were collected from control cells or cells undergoing necrosis caused by repeated freeze–thaw cycles. (F) H&E-stained image and IHC of IL-33 of ECC exhibiting luminal necrosis in KTC-K19CreERT mice. (Scale bar: Left, 50 μm; Right, 20 μm.) Arrowheads indicate luminal necrosis. (G) IHC staining of IL-33 of human ECC samples analyzed in Fig. 1E. (Scale bar: 50 μm.) Case 1 and Case 2 correspond, respectively, to Case 1 and Case 2 in Fig. 1E. (H) IHC staining of IL-33 of human ECC exhibiting luminal necrosis. (Scale bar: Left, 50 μm; Right, 20 μm.) Red arrowheads indicate luminal necrotic cells expressing IL-33. (I) Double IF staining of TUNEL and K19 (Upper panels) or CD45 (Lower panels) in the EHBD from KTC-K19CreERT mice on day 10 after TAM administration. (Scale bar: 50 μm.) (J and K) Double IF staining of CD45 and ST2 in the EHBD of KTC-K19CreERT mice on day 15 after TAM administration (J) and a xenograft derived from a Cre+ KTC organoid (K). (Scale bar: 20 μm.) Arrowheads indicate CD45+, ST2+ cells. (L) H&E-stained images of the EHBD of nude mice on day 5 after i.p. administration of IL-33 (1 μg) or vehicle control for 3 d. (Scale bar: 100 μm.)
IL-33 Links Biliary Epithelial Injury, Regeneration, and Cholangiocarcinogenesis in KTC-K19CreERT Mice.
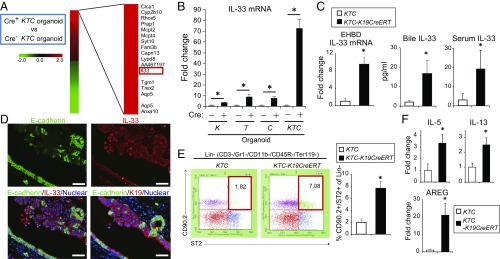
Next, a cDNA microarray analysis was conducted using Cre+ KTC and Cre− KTC organoids. A total of 1,096 genes were up- or down-regulated at least twofold in Cre+ KTC organoids compared with Cre− KTC organoids (Fig. 5A). Among these genes, we focused on IL-33, which exhibited the 13th highest magnitude of up-regulation. IL-33 is a member of the IL-1 family originally described as an inducer of type 2 innate immunity (20), and it was recently reported to promote BEC proliferation particularly in the EHBD (21). Real-time PCR revealed an ∼75-fold increase in IL-33 mRNA levels in Cre+ KTC organoids compared with Cre− KTC organoids. IL-33 expression was mildly increased by Kras activation (∼2-fold), moderately increased by deletion of TGFβR2 or E-cadherin (∼10-fold), and markedly increased by all three manipulations combined (Fig. 5B), suggesting that three genes cooperatively up-regulated IL-33.
Fig. 5.
IL-33 links biliary epithelial injury, regeneration, and cholangiocarcinogenesis. (A) cDNA microarray analysis of Cre+ KTC and Cre− KTC organoids. A total of 1,096 genes were at least twofold up- or down-regulated in Cre+ KTC organoids. The top 20 up-regulated genes are shown. (B) EHBD organoids from the indicated mice were infected with control or Cre-expressing lentivirus, and relative IL-33 mRNA levels were determined by real-time PCR. Bar graph shows the relative IL-33 mRNA levels after infection with Cre-expressing lentivirus compared with the control lentivirus (means ± SD, n = 3 per group). *P < 0.05. (C) Relative IL-33 mRNA levels in EHBDs obtained from KTC and KTC-K19CreERT mice at 3.5 wk after TAM administration were determined by real-time PCR (n = 3 per group), and IL-33 protein levels in the bile and serum of KTC and KTC-K19CreERT mice at 3.5 wk after TAM administration were measured by ELISA (bile, n = 5 per group; serum, n = 8 per group). Data are means ± SD. *P < 0.05. (D) Double IF staining of E-cadherin and IL-33 in the EHBD of KTC-K19CreERT mice on day 5. (Scale bar: 50 μm.) To locate E-cadherin–deleted duct cells, double IF staining of E-cadherin and K19 in serial sections is also shown. (E) Numbers of hepatic ILC2s in KTC and KTC-K19CreERT mice on day 20 after TAM administration were analyzed by flow cytometry. Representative dot plots and numbers from three independent experiments (bar graph) are shown (means ± SD; n = 3 per group). *P < 0.05. (F) Relative IL-5, IL-13, and AREG mRNA levels were determined by real-time PCR in EHBDs from KTC and KTC-K19CreERT mice at 3.5 wk after TAM administration (means ± SD; n = 3 per group). *P < 0.05.
Consistent with a previous report (21), i.p. administration of IL-33 (1 μg) for 3 d to C57BL/6 wild-type (WT) mice induced hyperplasia of surface BECs and expansion of PBGs in the EHBD on day 5 but had little effect on the peripheral IHBD or GB (Fig. S6B). Ki67 staining revealed marked proliferation of BECs in the EHBD, especially in PBGs (Fig. S6C).
KTC-K19CreERT mice revealed increased IL-33 mRNA levels in ECC tissues and increased IL-33 protein levels in the bile and serum compared with control KTC mice (Fig. 5C). Immunofluorescence (IF) analysis of KTC-K19CreERT mice on day 5 after TAM administration revealed increased expression of IL-33 in the nucleus of E-cadherin–deleted BECs, especially those in the area of disrupted alignment (Fig. 5D), and on day 10, some E-cadherin–negative detached BECs also strongly expressed nuclear IL-33 (Fig. S6D). Of note, IL-33 also functions as an “alarmin,” released from dying cells as an indicator of infection or tissue injury (20). Actually, although cell lines established from Cre+ KTC biliary organoids (termed “KTC-BO cells”) did not secrete IL-33, necrosis due to repeated freeze–thaw cycles led to release of IL-33 (Fig. S6E). Therefore, release of excess IL-33 from dying BECs may play a key role in regeneration of the EHBD and subsequent carcinogenesis in KTC-K19CreERT mice. Additionally, cancer glands in KTC-K19CreERT mice exhibited abundant luminal necrosis, and necrotic cells expressed IL-33 (Fig. S6F), suggesting that luminal necrosis might contribute to persistent IL-33 release even after ECC development in KTC-K19CreERT mice. Furthermore, we examined the expression of IL-33 in human ECC samples analyzed in Fig. 1E; 71.4% (5/7) of samples with an expression pattern similar to the mouse model (phospho-ERK–positive, SMAD4-negative, and E-cadherin–negative) expressed IL-33, whereas 24.2% (7/29) of the remaining patients were IL-33–positive (P = 0.028) (Fig. S6G). Additionally, cancer cells undergoing luminal necrosis expressed IL-33 (Fig. S6H). These findings are consistent with those in mice. We also performed terminal deoxynucleotidyl transferase-mediated dUTP nick end labeling (TUNEL) staining in EHBD tissue from KTC-K19CreERT mice on day 10 after TAM administration. Many TUNEL-positive cells were found in the subepithelial areas and were identified as K19−/CD45+ immune cells (Fig. S6I). However, most of the detached BECs were TUNEL-negative, suggesting that the detached BECs were undergoing a form of cell death other than apoptosis. In fact, it has been shown that IL-33 is released during necrosis and cellular stress, but during apoptosis, caspase-mediated cleavage of IL-33 diminishes the biological activity of IL-33 (22).
A previous study reported that IL-33–induced proliferation of BECs was mediated by type 2 innate lymphoid cells (ILC2s) (21). Thus, the number of hepatic ILC2s in KTC-K19CreERT mice was determined by flow cytometry. As expected, the number of ILC2s, defined as lineage− (CD3−, Gr1−, CD11b−, CD45R−, Ter119−), ST2+, and CD90.2+ cells, was significantly increased in KTC-K19CreERT mice compared with KTC mice (Fig. 5E). IF analysis confirmed the accumulation of CD45+, ST2+ cells in the subepithelial tissue of the EHBD of TAM-administered KTC-K19CreERT mice (Fig. S6J). In addition, infiltration of CD45+, ST2+ cells was seen in xenografts derived from Cre+ KTC organoids, and we confirmed that the IL-33–induced proliferative response of BECs was conserved in nude mice (Fig. S6 K and L).
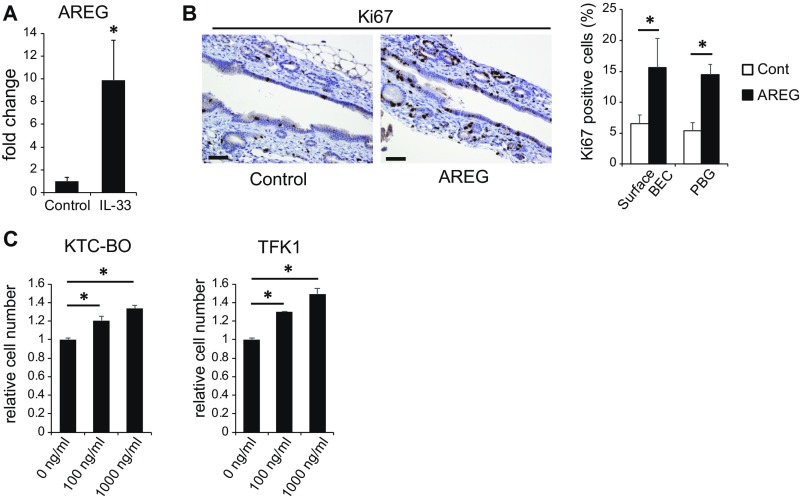
ILC2s have been reported to produce the effector cytokines IL-4, IL-5, IL-9, IL-13, and amphiregulin (AREG) in response to IL-33 (20), among which IL-13 was reported to contribute to proliferation of BECs (21). Although IL-4 and IL-9 mRNAs were not detected by real-time PCR, the expression levels of IL-5, IL-13, and AREG mRNA were significantly increased in the ECC tissues of KTC-K19CreERT mice compared with control EHBD tissues of KTC mice (Fig. 5F). In particular, AREG expression was markedly increased in KTC-K19CreERT mice. Administration of IL-33 to WT mice also significantly increased the expression of AREG in the EHBD (Fig. S7A). AREG is a ligand for epidermal growth factor receptor and has been reported to be involved in the repair of intestinal and lung tissues as an effector of the IL-33–ILC2 axis (23, 24). In fact, i.p. administration of AREG (10 μg for 3 consecutive days) to WT mice significantly increased the number of Ki67-positive cells among surface BECs and in the PBGs (Fig. S7B). Additionally, AREG promoted proliferation of KTC-BO cells and the human ECC TFK1 cells in vitro (Fig. S7C). These findings suggest that AREG contributes to proliferation of BECs as effectors of the IL-33 pathway.
Fig. S7.
AREG contributes to proliferation of BECs. (A) Relative AREG mRNA levels in the EHBDs of vehicle control or IL-33–administered WT mice were determined by real-time PCR (n = 3 per group). EHBDs were harvested on day 5. Data are means ± SD. *P < 0.05. (B) IHC staining of Ki67 in EHBDs from vehicle control or AREG-administered WT mice. EHBDs were harvested on day 5. (Scale bar: 50 μm.) Bar graph shows the frequencies of Ki67-positive cells among surface BECs and in the PBGs (n = 3 per group). Data are means ± SD. *P < 0.05. (C) KTC-BO cells and TFK1 cells were treated with the indicated concentrations of AREG for 4 d. Cells were enumerated using the Cell Counting Kit-8. Data are means ± SD (n = 3 per group). *P < 0.05.
IL-33 Can Substitute for Loss of E-Cadherin in the Development of ECC and Be a Therapeutic Target.
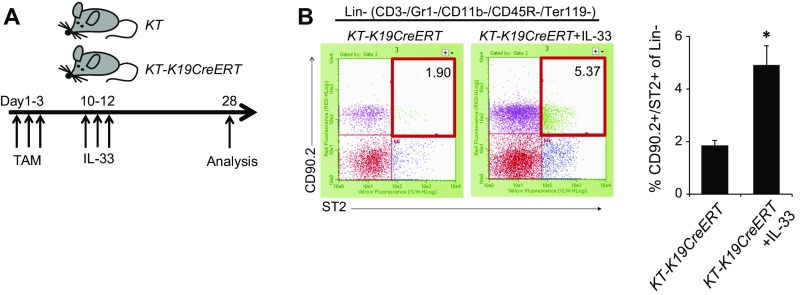
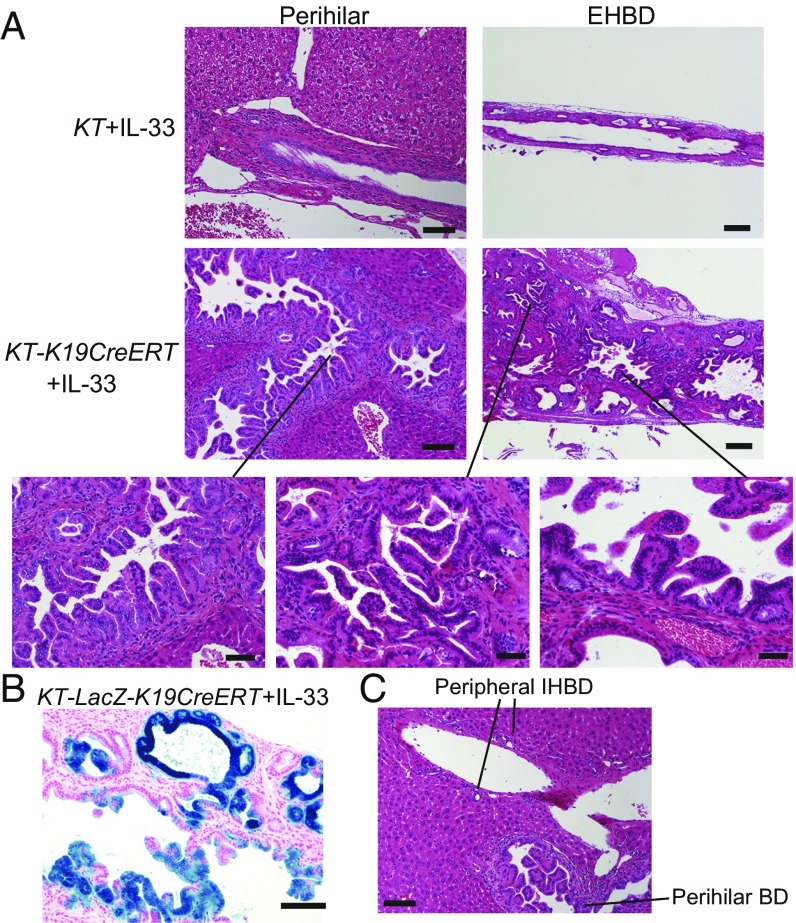
If IL-33 released from dying BECs as a result of E-cadherin loss plays a critical role in ECC development, administration of IL-33 may be able to substitute for loss of E-cadherin. To test this hypothesis, IL-33 was administered to TAM-administered KT-K19CreERT mice or Cre-negative KT mice on days 10, 11, and 12, and the histology of the liver and BD was analyzed on day 28 (Fig. S8A). Surprisingly, IL-33–administered KT-K19CreERT (KT-K19CreERT+IL-33) mice exhibited a markedly thickened EHBD, whereas IL-33–administered Cre-negative KT mice showed only mild expansion of PBGs at this time point (Fig. 6A). KT-K19CreERT+IL-33 mice revealed not only proliferation of dysplastic glands in the subepithelial tissue of the EHBD but also papillary tumors arising from surface BECs, probably because E-cadherin was not deleted in the BECs of KT-K19CreERT mice (Fig. 6A). In fact, in contrast to KTC-LacZ-K19CreERT mice, both dysplastic PBGs and papillary tumors occurring in IL-33–administered KT-LacZ-K19CreERT mice expressed LacZ (Fig. 6B). Additionally, we confirmed that the number of hepatic ILC2s in KT-K19CreERT+IL-33 mice was increased significantly compared with control KT-K19CreERT mice even 1 wk after initial IL-33 administration (Fig. S8). Thus, IL-33 cooperates with Kras and TGFβR2 mutations in the development of biliary tumors. Notably, neoplastic changes in BECs extended to the intrahepatic hilar area but not to the peripheral IHBD in KT-K19CreERT+IL-33 mice (Fig. 6C). Such a distribution was consistent with that in KTC-K19CreERT mice. Therefore, differences in the reactivity to IL-33 among the components of the biliary tree may explain the distribution of CC in KTC-K19CreERT mice.
Fig. S8.
Increased hepatic ILC2 numbers by IL-33 administration in KT-K19CreERT mice. (A) The protocol for exogenous IL-33 administration to KT and KT-K19CreERT mice. (B) Numbers of hepatic ILC2s in vehicle control- or IL-33–administered KT-K19CreERT mice were analyzed by flow cytometry 1 wk after initial IL-33 administration. Representative dot plots and numbers from three independent experiments (bar graph) are shown (means ± SD; n = 3 per group). *P < 0.05.
Fig. 6.
IL-33 cooperates with Kras and TGFβR2 mutations in the development of biliary tumors. (A) H&E-stained images of EHBDs and perihilar BDs from IL-33–administered KT and KT-K19CreERT mice. (Scale bar: Left panels, 100 μm; Right panels, 200 μm; Lower panels, 50 μm.) (B) LacZ-stained image of the EHBD of KT-LacZ-K19CreERT mice administered IL-33 using the protocol described in Fig. S8A. (Scale bar: 100 μm.) (C) H&E staining of the liver, including the perihilar and peripheral BD, of KT-K19CreERT+IL-33 mice. (Scale bar: 100 μm.)
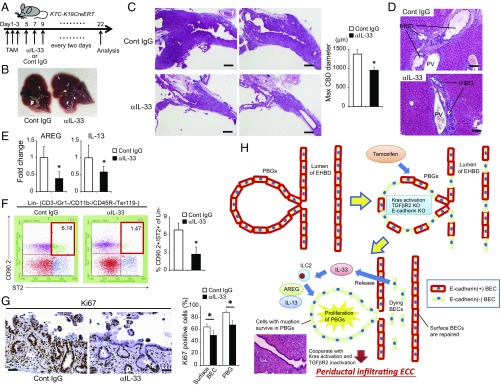
Next, we treated KTC-K19CreERT mice with a neutralizing anti–IL-33 antibody (Fig. 7A) (25). Anti–IL-33 treatment significantly attenuated the thickening of the EHBD wall (Fig. 7 B and C) and decreased the frequency of mice with a serum total bilirubin level greater than 2 mg/mL (30% vs. 0%) and IHBD dilatation (Fig. 7D). AREG and IL-13 mRNA levels and the number of hepatic ILC2s were also decreased by anti–IL-33 treatment (Fig. 7 E and F). Additionally, anti–IL-33 treatment significantly suppressed the hyperproliferative response of BECs on day 10 (Fig. 7G). These results indicate that the excess IL-33–mediated hyperproliferative response to biliary epithelial injury contributes to ECC development in KTC-K19CreERT mice (Fig. 7H). Furthermore, anti–IL-33 treatment suppressed the growth of KTC-BO tumors xenografted into C57BL/6 mice (Fig. S9 A‒C). Thus, IL-33 may be a potential therapeutic target for ECC.
Fig. 7.
Blocking IL-33 suppresses ECC development. (A) Protocol of anti–IL-33 treatment of KTC-K19CreERT mice. (B and C) Representative macroscopic (B) and H&E-stained (C) images of EHBDs from KTC-K19CreERT mice treated with anti–IL-33 antibody or control IgG. (Scale bar: 500 μm.) Bar graph shows maximum diameter of the CBD (means ± SEM; n = 10 per group). *P < 0.05. (D) H&E-stained images of the IHBDs of anti–IL-33- or control IgG-administered KTC-K19CreERT mice. (Scale bar: 100 μm.) (E) Relative AREG and IL-13 mRNA levels in EHBDs from anti–IL-33 or control IgG-administered KTC-K19CreERT mice were determined by real-time PCR (means ± SD; n = 6 per group). *P < 0.05. (F) Numbers of hepatic ILC2s in anti–IL-33- or control IgG-administered KTC-K19CreERT mice on day 20 after TAM administration were analyzed by flow cytometry. Representative dot plots and numbers from three independent experiments (bar graph) are shown (means ± SD; n = 3 per group). *P < 0.05. (G) Representative Ki67-stained image of anti–IL-33 or control IgG-administered KTC-K19CreERT mice on day 10 after TAM administration. (Scale bar: 50 μm.) Bar graph shows the frequencies of Ki67-positive cells among the surface BECs and in PBGs (means ± SD; n = 5 per group). *P < 0.05. (H) Proposed mechanism of ECC development in KTC-K19CreERT mice.
Fig. S9.
Anti–IL-33 treatment suppressed the growth of tumor xenografts. (A) Photograph and H&E-stained image of the KTC-BO cell-derived s.c. tumor that developed in C57BL/6 mice. (B and C) C57BL/6 mice were transplanted subcutaneously with KTC-BO cells and then treated with anti–IL-33 antibody or control IgG every other day from day 8 to day 20. Tumor weights were analyzed on day 21. Photograph of the tumors (B) and tumor weights (C) are shown (n = 12 per group). *P < 0.05.
Loss of E-Cadherin–Mediated Yes-Associated Protein Activation Promotes ECC Proliferation and Invasion.
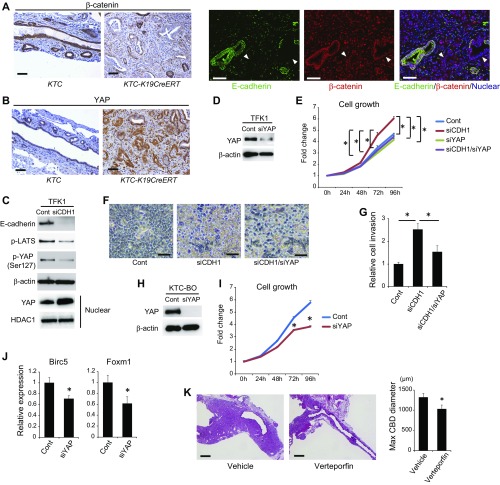
Although the above findings demonstrate that IL-33 can promote cholangiocarcinogenesis and substitute for loss of E-cadherin in the development of ECC, tumors in KT-K19CreERT+IL-33 mice were less aggressive than were those in KTC-K19CreERT mice and did not show lymphatic invasion or metastasis. Thus, whether loss of E-cadherin contributes to cholangiocarcinogenesis through not only biliary epithelial injury but also activation of the intrinsic oncogenic pathway was evaluated next. Loss of E-cadherin has been reported to induce nuclear translocation of β-catenin (26), which promotes carcinogenesis. However, expression of nuclear β-catenin was not increased despite decreased membranous β-catenin in the ECC cells of KTC-K19CreERT mice (Fig. S10A). In contrast, Yes-associated protein (YAP) expression, which plays an important role in cholangiocarcinogenesis (27) and is reportedly activated by loss of E-cadherin (28), was significantly increased in ECC cells (Fig. S10B). Microarray analysis of the biliary organoids performed in Fig. 5 also showed increased expression of YAP downstream oncogenes in Cre+ KTC organoids, such as Birc5 (4.75-fold), Foxm1 (4.38-fold), and Cyclin D1 (2.08-fold). In fact, knockdown of E-cadherin in TFK1 cells inactivated the Hippo-signaling cascade, which induces YAP degradation, resulting in increased nuclear accumulation of YAP (Fig. S10C). Knockdown of E-cadherin in TFK1 cells promoted their proliferation and accumulation without contact inhibition, but those effects were attenuated by knockdown of YAP (Fig. S10 D–F). Furthermore, the invasion capacity was significantly increased by knockdown of E-cadherin in TFK1 cells, which was inhibited by additional knockdown of YAP (Fig. S10G). Knockdown of YAP in KTC-BO cells also significantly attenuated their proliferation and down-regulated the expression of Birc5 and Foxm1 (Fig. S10 H–J). The YAP inhibitor verteporfin significantly suppressed ECC development in KTC-K19CreERT mice in vivo (Fig. S10K). Thus, loss of E-cadherin–mediated YAP activation is also implicated in ECC development.
Fig. S10.
Loss of E-cadherin–induced YAP activation increases ECC proliferation and invasion. (A and B) IHC staining of β-catenin (A) and YAP (B) in ECC tissues from KTC and KTC-K19CreERT mice. Double IF staining of E-cadherin and β-catenin in ECC tissue from KTC-K19CreERT mice is also shown in A. (Scale bar: 50 μm.) Arrowheads in A indicate E-cadherin–negative cancer glands. (C) Expression levels of the indicated proteins in whole-cell and nuclear extracts of TFK1 cells were assessed by WB at 72 h after transfection of control or CDH1 siRNA. (D) WB analysis of YAP expression in TFK1 cells 72 h after transfection of control or YAP siRNA. (E) Growth curve of TFK1 cells after transfection of control siRNA, CDH1 siRNA, YAP siRNA, or CDH1 and YAP siRNAs. Data are means ± SD (n = 3). *P < 0.05. (F) TFK1 cells were photographed 72 h after transfection of control siRNA, CDH1 siRNA, or CDH1 and YAP siRNAs. (Scale bar: 100 μm.) (G) Invasion capacity of TFK1 cells transfected with control siRNA, CDH1 siRNA, or CDH1 and YAP siRNAs. Data are means ± SD (n = 3). *P < 0.05. (H) WB analysis of YAP expression in KTC-BO cells 72 h after transfection of control or YAP siRNA. (I) Growth curve of KTC-BO cells after transfection of control or YAP siRNA. Data are means ± SD (n = 3). *P < 0.05. (J) Relative Birc5 and Foxm1 mRNA levels were determined by real-time PCR in KTC-BO cells 72 h after transfection of control or YAP siRNA. Data are means ± SD (n = 3). *P < 0.05. (K) Representative H&E-stained images of EHBDs from KTC-K19CreERT mice treated with verteporfin or vehicle control. (Scale bar: 500 μm.) Bar graph shows maximum diameter of the common bile duct in verteporfin- or vehicle-administered KTC-K19CreERT mice (n = 10 per group). Data are means ± SEM. *P < 0.05.
Discussion
In the present study, a mouse model of biliary injury-related ECC was established through duct-cell–specific activation of Kras and deletion of TGFβR2 and E-cadherin. To our knowledge, two genetically engineered mouse models have been reported to develop extrahepatic biliary tumors: ErbB-2 transgenic mice and duct-cell–specific Kras-activation and PTEN-deletion mice (11, 29). Although these mice were reported as models of GB cancer and ICC, respectively, they also developed well-differentiated papillary tumors in the EHBD. In contrast, ECC in KTC-K19CreERT mice spread laterally along the biliary tree, and cancer cells were highly malignant and metastasized to the regional lymph nodes. Periductal infiltrating growth and lymph node metastasis are characteristics of human ECC and responsible for its poor prognosis. Therefore, our mouse model is clinically relevant and will facilitate investigation of the pathogenesis of human ECC.
Death-driven compensatory proliferation to repair tissue defects is an important promoter of inflammation-associated carcinogenesis (30), and the mechanism underlying this process has been well analyzed in hepatocellular carcinoma (31, 32). However, although CC also occurs in the presence of chronic biliary injury and inflammation (2), the mechanism is unclear. In KTC-K19CreERT mice, the surface BECs detached from the wall of the EHBD due to loss of E-cadherin, which subsequently induced inflammation and a regenerative response by the remaining BECs, especially in PBGs. However, cells harboring mutations survived in the PBGs; therefore, the regenerative response to biliary injury resulted in ECC development from PBGs. Importantly, significant proliferation and hyperplasia of PBGs in response to biliary injury were observed in patients with primary sclerosing cholangitis and liver fluke infection (33, 34). Furthermore, the PBGs of patients with hepatolithiasis frequently harbor Kras mutations (35). Thus, a chronic biliary epithelial injury-induced proliferative response may result in development of CC from PBGs in humans, and this study provides experimental evidence of this possibility.
We succeeded in culturing biliary organoids following gene recombination capable of forming s.c. tumors, in which we identified IL-33 as a key factor linking biliary epithelial injury, regeneration, and cholangiocarcinogenesis. IL-33 was up-regulated in BECs cooperatively by mutations of Kras, TGFβR2, and E-cadherin. Although the mechanisms of regulation of IL-33 expression remain unclear, Kras activation and TGFβR2 inactivation have been reported to up-regulate IL-33 expression in the lung and macrophages, respectively (36, 37). In addition, disruption of the integrity of the lung and skin epithelial barrier has been reported to induce production of IL-33 (38). IL-33 functions as a sensor of epithelial barrier injury due to invasion of pathogens, including helminths, and induces a Th2 immune response to eliminate pathogens and repair the injured tissue through ILC2 activation (20). In this sense, loss of cell–cell adhesion due to E-cadherin deletion in BECs could trigger up-regulation of IL-33. Interestingly, a recent study showed significantly increased biliary epithelial IL-33 expression and serum IL-33 levels in patients with liver helminth Clonorchis sinensis infection (39). Together with our data, IL-33 may be a link between helminth infection and CC development. The finding that blocking IL-33 significantly suppressed ECC development in our study suggests IL-33 as a potential therapeutic target for ECC. Additionally, AREG, a downstream target of IL-33, should also be explored as another candidate for a therapeutic target for ECC in the future.
We showed that only three administrations of IL-33 to KT-K19CreERT mice was sufficient to induce biliary tumors. Although it is unknown why transient administration of IL-33 was sufficient for tumor development, a recent study showed that intranasal injection of IL-33 induced a sustained increase in lung ILC2s for more than 4 wk, albeit at a low level, and once ILC2s were primed by IL-33, they were highly responsive, even to unrelated allergens, and strongly induced inflammation (40). Thus, ILC2s primed by IL-33 may exert a long-term effect on the BD of KT-K19CreERT mice.
The distribution of CC is a unique characteristic of this mouse model. CC in KTC-K19CreERT mice was seen predominantly in the EHBD and perihilar IHBD, despite similar recombination efficiency among the biliary tree. This difference may be due, at least in part, to IL-33, for the following reasons. First, exogenous administration of IL-33 induced inflammation and BEC proliferation in the EHBD and perihilar BD, whereas the peripheral IHBD and GB were largely unaffected. This finding suggests that reactivity to IL-33 differs among regions of the biliary tree. Second, IL-33 is released from dying cells, and the shedding of BECs was more prominent in the EHBD than in the IHBD in KTC-K19CreERT mice. Thus, the level of IL-33 released from dying cells might be greater in the EHBD than in the IHBD. However, the peripheral IHBD and EHBD/large IHBD are embryologically different and thus may exhibit distinct properties other than IL-33 signaling.
PBGs have attracted attention as a BEC stem-cell niche and a potential origin of ECC (10). In the present study, IHC analysis of E-cadherin and lineage-tracing of LacZ-labeled cells suggests that ECC can originate from cells in the PBGs. Indeed, the distribution of CC in KTC-K19CreERT mice largely corresponded with that of PBGs (i.e., EHBD and perihilar BD). However, to definitively determine this issue, experiments using PBG-specific gene recombination are needed. Because a specific marker of PBGs has not been identified in mice, this remains a subject of future investigations.
Several studies have suggested that floxed alleles exhibit differential sensitivities to Cre-mediated recombination (41), but we were unable to perform histological assessment of LSL-KrasG12D and Tgfbr2flox/flox allele recombination because of a lack of antibodies appropriate for immunostaining. This raises the question of whether specific combinations of recombination have a greater propensity to induce malignancy. The findings that only KTC-K19CreERT mice developed ECC and most of the organoids other than KTC organoids could not form s.c. tumors suggest that all of the alleles would be recombined in cancer cells. However, further analysis is needed to obtain conclusive evidence.
In conclusion, we established a mouse model of biliary injury-related ECC. This model provided insight into the carcinogenic mechanisms, cellular origin, and potential therapeutic targets of ECC.
Materials and Methods
Albumin-Cre, LSL-KrasG12D, CDH1flox/flox, and Rosa26-LSL-tdTomato mice were purchased from the Jackson Laboratory. K19CreERT, Tgfbr2flox/flox, and Rosa26-LSL-LacZ mice have been described previously (13, 14, 42). All mice were of the C57BL/6 genetic background. Nude mice were purchased form CLEA Japan. All experiments were approved by the Ethics Committee for Animal Experimentation of the University of Tokyo and the Institute for Adult Diseases, Asahi Life Foundation, and were conducted in accordance with the Guide for the Care and Use of Laboratory Animals (43). Human ECC samples were obtained from 36 patients who underwent surgical treatment at The University of Tokyo Hospital with informed consent. This study was approved by the Ethics Committee of the University of Tokyo. Other methods are described in SI Materials and Methods.
SI Materials and Methods
Biochemical Analyses and Reagents.
The following antibodies were used: anti–E-cadherin for IHC and Western blot (WB), anti-phospho ERK, anti-phospho histone 3, anti-YAP, anti-phospho YAP, and anti-phospho LATS (Cell Signaling Technology), anti–E-cadherin for IF (BD transduction), anti-Ki67 (Thermo Scientific), anti-F4/80 (AbD Serotec), anti-K19, anti-TGFβR2, anti-SMAD4, and anti-HDAC1 (Santa Cruz Biotechnology), anti-K7 (Sigma), anti–α-smooth muscle actin (Dako), anti-CD45 (eBioscience), anti-mouse IL-33 (R&D Systems), anti–LYVE-1, anti-ST2, and anti-human IL-33 (clone Nessy-1) (Abcam). Recombinant IL-33 and AREG and an IL-33 ELISA kit were purchased from R&D Systems. A neutralizing anti–IL-33 antibody or control IgG (3.6 μg/mouse) (R&D Systems) was administered intraperitoneally to mice every other day (25). TAM (Sigma) was dissolved in corn oil containing 10% ethanol and administered by oral gavage to mice at 7–8 wk of age. YAP inhibitor verteporfin (Sigma) was dissolved in DMSO at 100 mg/mL and diluted to 10 mg/mL in PBS and then administered intraperitoneally to mice at a dose of 100 mg/kg every other day. Verteporfin treatment was started on day 9 after TAM administration, and mice were analyzed on day 22.
Immunoblotting, RNA extraction, and real-time PCR were performed as described previously (17). Primer sequences are available upon request.
The detection of gene recombination of LSL-KrasG12D and Tgfbr2flox/flox alleles was performed as previously described (14).
Cells and RNA Interference.
TFK1 cells were cultured in RPMI with 10% FBS, and KTC-BO cells were cultured in Dulbecco’s Modified Eagle Medium with 10% FBS. A small interfering RNA (siRNA) construct was obtained with siGENOME SMARTpool reagents (Dharmacon), and siRNA transfections were performed using RNAiMAX (Invitrogen).
An invasion assay was performed using a CytoSelect 24-well Cell Invasion Assay kit (Cell Biolabs) according to the manufacturer’s protocol.
Histology.
Liver and bile duct tissues were processed for H&E staining and immunostaining as described previously (17). Paraffin block production, H&E staining, and Masson’s trichrome staining were performed by Septsapie. TUNEL staining was performed using the Apoalert DNA Fragmentation Assay kit (Clontech).
For LacZ staining, isolated livers and bile ducts were incubated for 2 h in fixative solution (1% formaldehyde, 0.2% glutaraldehyde, and 0.02% Nonidet P-40 in PBS) at 4 °C. The tissues were washed twice in PBS at room temperature and then incubated in β-galactosidase substrate [5 mM K3FE(CN)6, 5 mM K4Fe(CN)60.3H2O, 2 mM MgCl2, 0.02% Nonidet P-40, 0.1% Na deoxycholate, and 1 mg/mL X-gal in PBS] in the dark overnight at room temperature. After fixation, sections were counterstained with nuclear fast red.
To determine the maximum diameter of the common bile duct, we prepared seven sagittal tissue sections (5 μm thick) of EHBD at 10-μm intervals around the center of the EHBDs and measured the maximum diameter in each section. The diameter was measured from the microscopic images using software DP2-BSW (Olympus).
Human ECC samples were obtained from 36 patients who underwent surgical treatment at The University of Tokyo Hospital. The staining of E-cadherin and SMAD4 was categorized as negative if the staining intensity was weaker than that in normal epithelium. Phospho-ERK and IL-33 staining were scored semiquantitatively based on a scale staining pattern of 0–2 (0, ≤25%; 1, 25–50%, 2, >50% of tumor cell population is positive), and grades 1 and 2 were categorized as positive.
Organoid Experiments.
Isolated EHBD tissue was cut into small pieces and incubated in dissociation buffer [RPMI with 4% FCS, 1 mg/mL collagenase D (Roche), 0.5 mg/mL dispase (Gibco), and 40 μg/mL DNase (Roche)] at 37 °C for 30 min. Incubated EHBD was mixed with Matrigel and seeded onto plates overlaid with culture medium [Ad-DMEM/F12 (Invitrogen) supplemented with B27 and N2, 1 mM N-acetylcysteine, 10 mM nicotinamide (Wako), 50 ng/mL EGF, 1 μg/mL Rspo1, 100 ng/mL Noggin, 100 ng/mL FGF10 (Peprotech), and 10% Wnt3a-conditioned medium (ATCC)]. Passaging was performed at 1:4–1:8 split ratios once per week. For passaging, organoids were incubated on ice in Cell Recovery Solution (BD) for 30 min, passed twice through a 29-guage needle, and re-embedded in Matrigel. The ROCK inhibitor Y-27632 (10 µM; Wako) was added to the initial culture after organoid passaging.
To induce recombination, organoids were infected with Cre-expressing or control lentivirus, and transduced cells were selected using puromycin. Two weeks later, organoids were used for experiments.
For the xenograft model, 100 crumbled organoid fragments per well were seeded and cultured for 12 h. Harvested organoids were suspended in Ad-DMEM/F12 and Matrigel and injected subcutaneously into nude mice. Organoids obtained from one well were injected at two sites. Two months later, tumorigenicity was assessed.
The SurePrint G3 Mouse GE Microarray Kit 8 × 60K (Agilent Technologies) was used for microarray analysis. Sample preparation, microarray hybridization, and bioinformatics analysis were performed by Cell Innovator. Microarray data were deposited in the Gene Expression Omnibus database under accession no. GSE88900.
Flow Cytometry.
For flow cytometry analyses, hepatic immune cells were isolated by a two-step collagenase digestion protocol as described previously (44). Cell suspensions were incubated with conjugated antibodies against ST2 (MD Bioproducts), CD90.2, and lineage-mixture antibodies (BioLegend). Dead cells were determined by staining with SYTOX Green Dead Cell Stain (Molecular Probes). Data were acquired using Guava easyCyte cytometer (Merck Millipore).
Statistical Analyses.
Statistical analyses were performed using Student’s t test, one-way analysis of variance followed by the Tukey–Kramer test for multiple comparisons, or Fisher’s exact test for categorical data. A P value < 0.05 was taken to indicate statistical significance.
Acknowledgments
This study was supported by the Japanese Society for the Promotion of Science Kakenhi Grant 15K09039; the Astellas Foundation for Research on Metabolic Disorders; the Nakayama Cancer Research Institute; the Okinaka Memorial Institute for Medical Research; a research grant from the Princess Takamatsu Cancer Research Fund; and the Foundation for Promotion of Cancer Research in Japan.
Footnotes
The authors declare no conflict of interest.
This article is a PNAS Direct Submission. J.W.P. is a guest editor invited by the Editorial Board.
Data deposition: Microarray data were deposited in the Gene Expression Omnibus database (accession no. GSE88900).
This article contains supporting information online at www.pnas.org/lookup/suppl/doi:10.1073/pnas.1619416114/-/DCSupplemental.
References
- 1.Rizvi S, Gores GJ. Pathogenesis, diagnosis, and management of cholangiocarcinoma. Gastroenterology. 2013;145:1215–1229. doi: 10.1053/j.gastro.2013.10.013. [DOI] [PMC free article] [PubMed] [Google Scholar]
- 2.Malhi H, Gores GJ. Cholangiocarcinoma: Modern advances in understanding a deadly old disease. J Hepatol. 2006;45:856–867. doi: 10.1016/j.jhep.2006.09.001. [DOI] [PMC free article] [PubMed] [Google Scholar]
- 3.Chan-On W, et al. Exome sequencing identifies distinct mutational patterns in liver fluke-related and non-infection-related bile duct cancers. Nat Genet. 2013;45:1474–1478. doi: 10.1038/ng.2806. [DOI] [PubMed] [Google Scholar]
- 4.Nakamura H, et al. Genomic spectra of biliary tract cancer. Nat Genet. 2015;47:1003–1010. doi: 10.1038/ng.3375. [DOI] [PubMed] [Google Scholar]
- 5.Roskams T, Desmet V. Embryology of extra- and intrahepatic bile ducts, the ductal plate. Anat Rec (Hoboken) 2008;291:628–635. doi: 10.1002/ar.20710. [DOI] [PubMed] [Google Scholar]
- 6.Sekiya S, Suzuki A. Intrahepatic cholangiocarcinoma can arise from Notch-mediated conversion of hepatocytes. J Clin Invest. 2012;122:3914–3918. doi: 10.1172/JCI63065. [DOI] [PMC free article] [PubMed] [Google Scholar]
- 7.Fan B, et al. Cholangiocarcinomas can originate from hepatocytes in mice. J Clin Invest. 2012;122:2911–2915. doi: 10.1172/JCI63212. [DOI] [PMC free article] [PubMed] [Google Scholar]
- 8.Guest RV, et al. Cell lineage tracing reveals a biliary origin of intrahepatic cholangiocarcinoma. Cancer Res. 2014;74:1005–1010. doi: 10.1158/0008-5472.CAN-13-1911. [DOI] [PMC free article] [PubMed] [Google Scholar]
- 9.Dipaola F, et al. Identification of intramural epithelial networks linked to peribiliary glands that express progenitor cell markers and proliferate after injury in mice. Hepatology. 2013;58:1486–1496. doi: 10.1002/hep.26485. [DOI] [PMC free article] [PubMed] [Google Scholar]
- 10.Lanzoni G, Cardinale V, Carpino G. The hepatic, biliary, and pancreatic network of stem/progenitor cell niches in humans: A new reference frame for disease and regeneration. Hepatology. 2016;64:277–286. doi: 10.1002/hep.28326. [DOI] [PubMed] [Google Scholar]
- 11.Ikenoue T, et al. A novel mouse model of intrahepatic cholangiocarcinoma induced by liver-specific Kras activation and Pten deletion. Sci Rep. 2016;6:23899. doi: 10.1038/srep23899. [DOI] [PMC free article] [PubMed] [Google Scholar]
- 12.Xu X, et al. Induction of intrahepatic cholangiocellular carcinoma by liver-specific disruption of Smad4 and Pten in mice. J Clin Invest. 2006;116:1843–1852. doi: 10.1172/JCI27282. [DOI] [PMC free article] [PubMed] [Google Scholar]
- 13.Means AL, Xu Y, Zhao A, Ray KC, Gu G. A CK19(CreERT) knockin mouse line allows for conditional DNA recombination in epithelial cells in multiple endodermal organs. Genesis. 2008;46:318–323. doi: 10.1002/dvg.20397. [DOI] [PMC free article] [PubMed] [Google Scholar]
- 14.Ijichi H, et al. Aggressive pancreatic ductal adenocarcinoma in mice caused by pancreas-specific blockade of transforming growth factor-beta signaling in cooperation with active Kras expression. Genes Dev. 2006;20:3147–3160. doi: 10.1101/gad.1475506. [DOI] [PMC free article] [PubMed] [Google Scholar]
- 15.Berx G, van Roy F. Involvement of members of the cadherin superfamily in cancer. Cold Spring Harb Perspect Biol. 2009;1:a003129. doi: 10.1101/cshperspect.a003129. [DOI] [PMC free article] [PubMed] [Google Scholar]
- 16.Nitta T, et al. Prognostic significance of epithelial-mesenchymal transition-related markers in extrahepatic cholangiocarcinoma: Comprehensive immunohistochemical study using a tissue microarray. Br J Cancer. 2014;111:1363–1372. doi: 10.1038/bjc.2014.415. [DOI] [PMC free article] [PubMed] [Google Scholar]
- 17.Nakagawa H, et al. Loss of liver E-cadherin induces sclerosing cholangitis and promotes carcinogenesis. Proc Natl Acad Sci USA. 2014;111:1090–1095. doi: 10.1073/pnas.1322731111. [DOI] [PMC free article] [PubMed] [Google Scholar]
- 18.Woolbright BL, Jaeschke H. Novel insight into mechanisms of cholestatic liver injury. World J Gastroenterol. 2012;18:4985–4993. doi: 10.3748/wjg.v18.i36.4985. [DOI] [PMC free article] [PubMed] [Google Scholar]
- 19.Huch M, et al. In vitro expansion of single Lgr5+ liver stem cells induced by Wnt-driven regeneration. Nature. 2013;494:247–250. doi: 10.1038/nature11826. [DOI] [PMC free article] [PubMed] [Google Scholar]
- 20.Molofsky AB, Savage AK, Locksley RM. Interleukin-33 in tissue homeostasis, injury, and inflammation. Immunity. 2015;42:1005–1019. doi: 10.1016/j.immuni.2015.06.006. [DOI] [PMC free article] [PubMed] [Google Scholar]
- 21.Li J, et al. Biliary repair and carcinogenesis are mediated by IL-33-dependent cholangiocyte proliferation. J Clin Invest. 2014;124:3241–3251. doi: 10.1172/JCI73742. [DOI] [PMC free article] [PubMed] [Google Scholar]
- 22.Lüthi AU, et al. Suppression of interleukin-33 bioactivity through proteolysis by apoptotic caspases. Immunity. 2009;31:84–98. doi: 10.1016/j.immuni.2009.05.007. [DOI] [PubMed] [Google Scholar]
- 23.Monticelli LA, et al. IL-33 promotes an innate immune pathway of intestinal tissue protection dependent on amphiregulin-EGFR interactions. Proc Natl Acad Sci USA. 2015;112:10762–10767. doi: 10.1073/pnas.1509070112. [DOI] [PMC free article] [PubMed] [Google Scholar]
- 24.Monticelli LA, et al. Innate lymphoid cells promote lung-tissue homeostasis after infection with influenza virus. Nat Immunol. 2011;12:1045–1054. doi: 10.1031/ni.2131. [DOI] [PMC free article] [PubMed] [Google Scholar]
- 25.Li P, Lin W, Zheng X. IL-33 neutralization suppresses lupus disease in lupus-prone mice. Inflammation. 2014;37:824–832. doi: 10.1007/s10753-013-9802-0. [DOI] [PubMed] [Google Scholar]
- 26.Orsulic S, Huber O, Aberle H, Arnold S, Kemler R. E-cadherin binding prevents beta-catenin nuclear localization and beta-catenin/LEF-1-mediated transactivation. J Cell Sci. 1999;112:1237–1245. doi: 10.1242/jcs.112.8.1237. [DOI] [PubMed] [Google Scholar]
- 27.Pei T, et al. YAP is a critical oncogene in human cholangiocarcinoma. Oncotarget. 2015;6:17206–17220. doi: 10.18632/oncotarget.4043. [DOI] [PMC free article] [PubMed] [Google Scholar]
- 28.Kim NG, Koh E, Chen X, Gumbiner BM. E-cadherin mediates contact inhibition of proliferation through Hippo signaling-pathway components. Proc Natl Acad Sci USA. 2011;108:11930–11935. doi: 10.1073/pnas.1103345108. [DOI] [PMC free article] [PubMed] [Google Scholar]
- 29.Kiguchi K, et al. Constitutive expression of ErbB-2 in gallbladder epithelium results in development of adenocarcinoma. Cancer Res. 2001;61:6971–6976. [PubMed] [Google Scholar]
- 30.Grivennikov SI, Greten FR, Karin M. Immunity, inflammation, and cancer. Cell. 2010;140:883–899. doi: 10.1016/j.cell.2010.01.025. [DOI] [PMC free article] [PubMed] [Google Scholar]
- 31.Maeda S, Kamata H, Luo JL, Leffert H, Karin M. IKKbeta couples hepatocyte death to cytokine-driven compensatory proliferation that promotes chemical hepatocarcinogenesis. Cell. 2005;121:977–990. doi: 10.1016/j.cell.2005.04.014. [DOI] [PubMed] [Google Scholar]
- 32.Nakagawa H, et al. ER stress cooperates with hypernutrition to trigger TNF-dependent spontaneous HCC development. Cancer Cell. 2014;26:331–343. doi: 10.1016/j.ccr.2014.07.001. [DOI] [PMC free article] [PubMed] [Google Scholar]
- 33.Carpino G, et al. Activation of biliary tree stem cells within peribiliary glands in primary sclerosing cholangitis. J Hepatol. 2015;63:1220–1228. doi: 10.1016/j.jhep.2015.06.018. [DOI] [PubMed] [Google Scholar]
- 34.Hughes NR, Pairojkul C, Royce SG, Clouston A, Bhathal PS. Liver fluke-associated and sporadic cholangiocarcinoma: An immunohistochemical study of bile duct, peribiliary gland and tumour cell phenotypes. J Clin Pathol. 2006;59:1073–1078. doi: 10.1136/jcp.2005.033712. [DOI] [PMC free article] [PubMed] [Google Scholar]
- 35.Hsu M, Sasaki M, Igarashi S, Sato Y, Nakanuma Y. KRAS and GNAS mutations and p53 overexpression in biliary intraepithelial neoplasia and intrahepatic cholangiocarcinomas. Cancer. 2013;119:1669–1674. doi: 10.1002/cncr.27955. [DOI] [PubMed] [Google Scholar]
- 36.Lee S, et al. Profiling of transcripts and proteins modulated by K-ras oncogene in the lung tissues of K-ras transgenic mice by omics approaches. Int J Oncol. 2009;34:161–172. [PubMed] [Google Scholar]
- 37.Rani R, Smulian AG, Greaves DR, Hogan SP, Herbert DR. TGF-β limits IL-33 production and promotes the resolution of colitis through regulation of macrophage function. Eur J Immunol. 2011;41:2000–2009. doi: 10.1002/eji.201041135. [DOI] [PMC free article] [PubMed] [Google Scholar]
- 38.Islam SA, Luster AD. T cell homing to epithelial barriers in allergic disease. Nat Med. 2012;18:705–715. doi: 10.1038/nm.2760. [DOI] [PMC free article] [PubMed] [Google Scholar]
- 39.Yu Q, et al. Expression and potential roles of IL-33/ST2 in the immune regulation during Clonorchis sinensis infection. Parasitol Res. 2016;115:2299–2305. doi: 10.1007/s00436-016-4974-9. [DOI] [PubMed] [Google Scholar]
- 40.Martinez-Gonzalez I, et al. Allergen-experienced group 2 innate lymphoid cells acquire memory-like properties and enhance allergic lung inflammation. Immunity. 2016;45:198–208. doi: 10.1016/j.immuni.2016.06.017. [DOI] [PubMed] [Google Scholar]
- 41.Liu J, et al. Non-parallel recombination limits Cre-LoxP-based reporters as precise indicators of conditional genetic manipulation. Genesis. 2013;51:436–442. doi: 10.1002/dvg.22384. [DOI] [PMC free article] [PubMed] [Google Scholar]
- 42.Soriano P. Generalized lacZ expression with the ROSA26 Cre reporter strain. Nat Genet. 1999;21:70–71. doi: 10.1038/5007. [DOI] [PubMed] [Google Scholar]
- 43.National Research Council . Guide for the Care and Use of Laboratory Animals. 8th Ed National Academies Press; Washington, DC: 2011. [Google Scholar]
- 44.Font-Burgada J, et al. Hybrid periportal hepatocytes regenerate the injured liver without giving rise to cancer. Cell. 2015;162:766–779. doi: 10.1016/j.cell.2015.07.026. [DOI] [PMC free article] [PubMed] [Google Scholar]


