Significance
Mature B cells express two classes of B-cell antigen receptor (BCR), IgM and IgD. The relevance of each isotype is still enigmatic. The BCR cross talks with a number of other receptors on the B-cell surface. We here show that CXCR4 engages in broad cross talk with the IgD–BCR specifically. CXCR4 function is strongly compromised in the absence of IgD, revealing its significance for B-cell homeostasis. We show that cross talk is also mediated via CD19 and the actin cytoskeleton. Furthermore, actin depolymerization by Latrunculin-A (Lat-A) mimics almost all effects of CXCL12. Hence, CXCR4 signaling modifies the actin cytoskeleton to communicate with other receptors such as CD19 and IgD. This view places the cytoskeleton at the center of receptor cross talk.
Keywords: B-cell antigen receptor, IgD, CXCR4, cytoskeleton, signaling
Abstract
Mature B cells coexpress both IgM and IgD B-cell antigen receptor (BCR) classes, which are organized on the cell surface in distinct protein islands. The specific role of the IgD–BCR is still enigmatic, but it is colocalized with several other receptors on the B-cell surface, including the coreceptor CD19. Here, we report that the chemokine receptor CXCR4 is also found in proximity to the IgD–BCR. Furthermore, B cells from IgD-deficient mice show defects in CXCL12-mediated CXCR4 signaling and B-cell migration, whereas B cells from IgM-deficient mice are normal in this respect. CXCR4 activation results in actin cytoskeleton remodeling and PI3K/Akt and Erk signaling in an IgD–BCR-dependent manner. The defects in CXCR4 signaling in IgD-deficient B cells can be overcome by anti-CD19 antibody stimulation that also increases CXCL12-mediated B-cell migration of normal B cells. These results show that the IgD–BCR, CD19, and CXCR4 are not only colocalized at nanometer distances but are also functionally connected, thus providing a unique paradigm of receptor signaling cross talk and function.
B cells recognize antigen by means of their B-cell antigen receptor (BCR). The BCR consists of the membrane-bound form of Ig in association with the Igα/Igβ (CD79a/CD79b) signaling subunits (1). Mature B cells express two different BCR classes, namely IgM and IgD, both having identical antigen specificity (2). Why mature B cells carry two different BCR classes on their surface remains a major unanswered question of immunological research (3, 4). However, recent superresolution studies of the B-cell surface showed a distinct distribution of these BCRs inside class-specific protein islands (5). BCR activation encompasses a sequence of molecular events including the activation of the spleen tyrosine kinase Syk, the phosphorylation of tyrosine (Y) in the tail of the Igα/Igβ heterodimer, and the coreceptor CD19, and the activation of phosphatidylinositol-3-kinase (PI3K)/Akt and Erk pathways as well as the mobilization of intracellular calcium (6). Apart from playing a major role in the antigen-dependent B-cell activation and clonal selection, the BCR can also integrate signals from other receptors on the B-cell surface, such as Toll-like receptors (TLRs) (7) and receptors of the tumor necrosis factor (TNF) family (8, 9). These receptor cross talks have gained attention in recent years and seem to involve the actin cytoskeleton (10). Indeed, the disruption of the actin cytoskeleton alone is sufficient to activate BCR signaling (11, 12) in a CD19-dependent manner (13). This finding suggests that signals initiated through receptors, which induce actin rearrangements, could directly trigger or influence BCR signaling, even in an antigen-independent manner. Accordingly, it was suggested that cytoskeleton dynamics might be at the basis of the tonic BCR survival signal (10, 13, 14). An important class of receptor inducing alterations of the actin cytoskeleton are chemokine receptors (CKRs) (15). Mature B cells express several members of the CKR family, namely CCR6, CCR7, CXCR4, and CXCR5 (16). Regulation of CXCR4 is of particular interest due its role in lymphomagenesis, infiltration, and retention of leukemia cells and HIV infection. CXCR4 is expressed throughout B-cell development but fulfills different functions dependent on the developmental stage. For example, CXCR4 is necessary to retain developing B cells in the bone marrow (17) but does not have this effect on mature B cells. Although CXCR4 plays an essential role in recruiting germinal center B cells into the dark zone (18), its role in mature naive B cells is much less clear. We here show that CXCR4 signaling requires the expression of the IgD–BCR and CD19, suggesting that these three receptors are functionally connected during B-cell activation and migration.
Results and Discussion
Signaling Through CXCR4 Depends on the BCR.
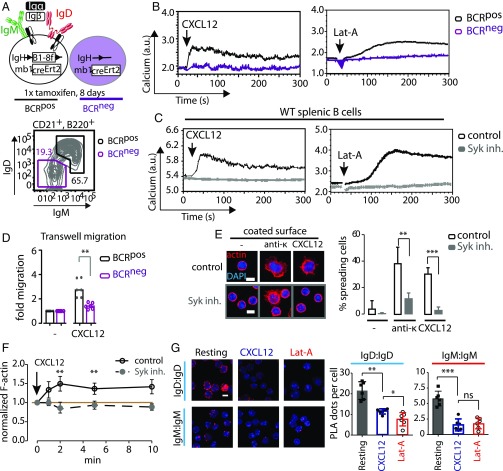
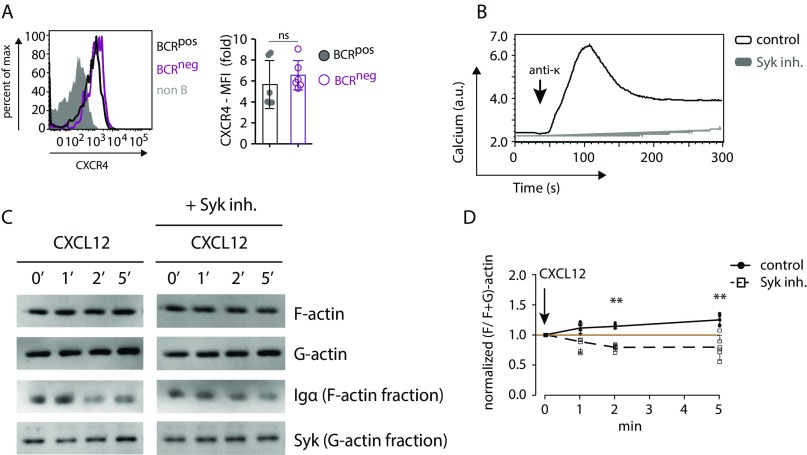
To assess the role of the BCR in CXCR4 signaling, we generated BCRneg B cells by the tamoxifen-induced Cre-mediated deletion of a productive VH gene as described previously (14, 19) (Fig. 1A). BCRneg and BCRpos B cells were isolated from tamoxifen-treated mice 8 d posttreatment and expressed the same amount of CXCR4 on their surface (Fig. S1A). However, CXCL12 induced a calcium release only in the BCRpos, but not in the BCRneg B cells, indicating that an intact BCR is required for CXCR4 signaling (Fig. 1B, Left). The same phenotype was observed when BCRneg and BCRpos B cells were exposed to the actin-depolymerizing drug Latrunculin-A (Lat-A), suggesting a central role for the actin cytoskeleton in the regulation of both receptors (Fig. 1B, Right). Furthermore, the BCRneg B cells displayed impaired migration toward CXCL12 in a Transwell migration assay (Fig. 1D).
Fig. 1.
Signaling through CXCR4 is coupled to the BCR via Syk and the actin cytoskeleton. (A, Top) Schematic representation of BCR ablation in floxed B1-8HCknockin × mb1-creERT2 mice by tamoxifen administration. (Bottom) Representative FACS analysis for IgM and IgD expression in CD21pos, B220pos splenic B cells after 8 d of tamoxifen administration. (B) Calcium flux measurement of BCRpos (black) and BCRneg (purple) splenic B cells in response to 100 ng/mL CXCL12 (Left) or 1 µM Lat-A (Right). (C) Calcium flux measurement of WT splenic B cells treated with 1 µM Syk inhibitor (gray) and untreated control cells (black) and stimulated with CXCL12 (Left) or Lat-A (Right). (D) Migration of BCRpos and BCRneg splenic B cells toward CXCL12 over a period of 4 h. (E) Spreading of WT splenic B cells treated with Syk inhibitor or untreated control cells on surfaces coated with either anti-κ antibody or CXCL12. Cells were allowed to spread for 5 min, and then fixed and stained with DAPI and phalloidin to visualize F-actin. (Scale bar: 5 μm.) Quantification shows percentage of spreading cells per image. (F) Quantification of cellular F-actin in WT splenic B cells via staining with phalloidin and flow-cytometric analysis after different time points of CXCL12 stimulation. (G) Fab-PLA analysis of IgM–IgM and IgD–IgD proximity in resting WT splenic B cells compared with cells stimulated with CXCL12 or Lat-A. (Scale bar: 5 μm.) Calcium flux analyses in B and C are representative of four independent experiments. Migration analyses in D represent median of four or more independent experiments. F-actin analyses in E and F represent mean ± SD of three independent experiments. PLA analyses in G represent mean ± SD of six independent experiments. *P < 0.05; **P < 0.01; ***P < 0.001.
Fig. S1.
Signaling through CXCR4 is coupled to the BCR via Syk and the actin cytoskeleton. (A) Expression of CXCR4 in BCRpos (black) and BCRneg (purple) splenic B cells by FACS analysis (Left) and mean fluorescence intensity (MFI) quantification (Right). (B) Calcium flux measurement of splenic B cells in response to 5 µg/mL anti-κLC in absence (control, black) and presence of 1 µM Syk inhibitor (gray). (C) Representative Western blot analysis of F- and G-actin fractions of splenic B cells in response to 100 ng/mL CXCL12 stimulation in the absence and presence of 1 µM Syk inhibitor. (D) Quantification of F-actin fraction dynamics in response to 100 ng/mL CXCL12 stimulation. Analysis of CXCR4 expression in A and calcium flux analyses in B are representative of six and four independent experiments, respectively. Quantification of F- and G-actin fractions in D represents mean ± SEM of four or more independent experiments. **P < 0.01.
The exposure of wild-type (WT) splenic B cells to the Syk inhibitor Bay-61-3606 also prevented the CXCL12 or Lat-A–induced calcium release in these cells (Fig. 1C). The Syk-inhibited B cells no longer responded to BCR engagement (Fig. S1B) and also displayed a defective spreading and actin remodeling in response to CXCL12 stimulation (Fig. 1 E and F). These observations are in line with the finding that Syk−/− B cells fail to migrate toward CXCL12 (19). Using a Fab-based proximity ligation assay (Fab-PLA), we previously showed that the exposure of B cells to Lat-A results in BCR dissociation (20). The same conformational alterations of the IgM– and IgD–BCRs are detected by this assay upon CXCL12 stimulation (Fig. 1G). Together, these results reveal an intimate connection among CXCR4, the BCR, and actin remodeling. These findings are reminiscent of previous data, showing that, in T cells, CXCR4 interacts with the TCR and employs Zap70, the T-cell homolog of Syk, to transduce signals (21–23).
CXCR4-Mediated Responses Specifically Require the IgD–BCR.
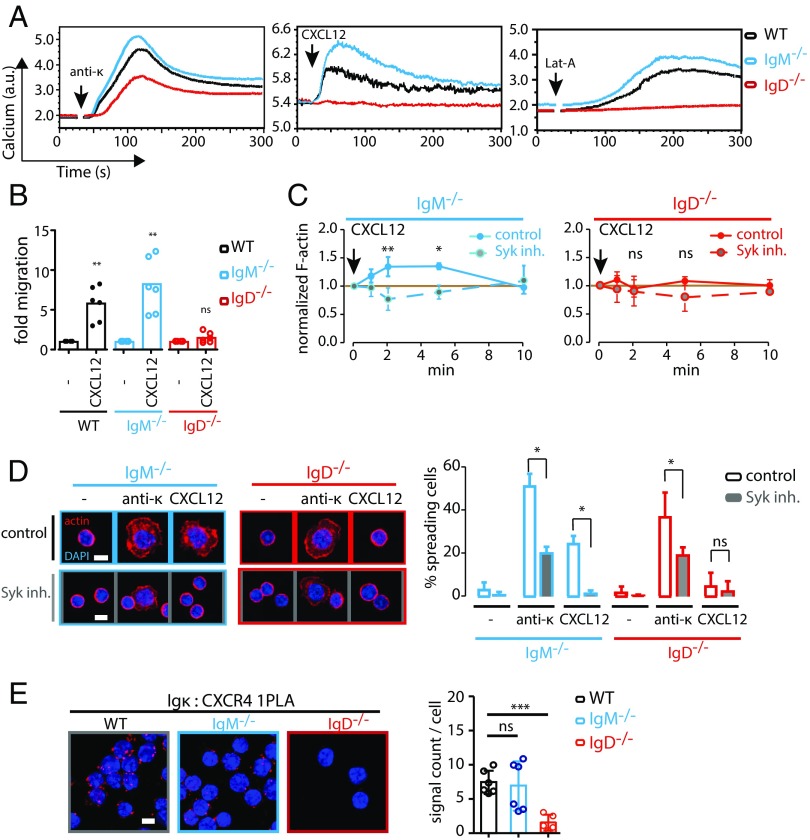
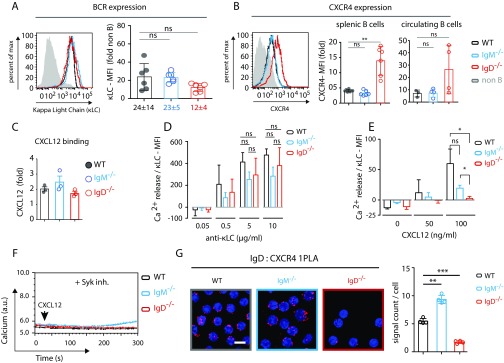
We next asked whether the dependence of CXCR4 signaling on the BCR involved both classes of the BCR (IgM and IgD) on mature B cells. Hence, we analyzed splenic B cells from WT, IgM−/−, and IgD−/− mice for their response to CXCL12. We found that the CXCL12 or Lat-A–induced calcium response required expression of the IgD– but not the IgM–BCR (Fig. 2A). Importantly, B cells from all tested mouse models showed similar levels of BCR expression (Fig. S2A) and responded well upon a direct stimulation of the BCR with an anti-κLC antibody (Fig. 2A, Left). The IgD−/− B cells, however, displayed an elevated CXCR4 expression (Fig. S2B), whereas the CXCL12 binding was indistinguishable in WT, IgM−/−, and IgD−/− B cells (Fig. S2C). To ensure that minor differences in BCR expression are not causing the loss of CXCL12 induced signaling in IgD−/− B cells, we normalized the anti-κLC antibody or CXCL12-induced calcium response to total BCR expression. We observed no difference in calcium mobilization per BCR for anti-κLC stimulation in WT, IgM−/−, and IgD−/− B cells (Fig. S2D). These results are in line with previous findings (24). However, we found a significant difference for CXCL12 stimulation (Fig. S2E), proving that indeed IgD is required for this signal.
Fig. 2.
Signaling through CXCR4 is coupled to IgD, but not IgM. (A) Calcium flux measurement of WT (black), IgM−/− (blue), and IgD−/− (red) splenic B cells in response to stimulation with 5 µg/mL anti-κ (first panel), 100 ng/mL CXCL12 (second panel), or 1 µM Lat-A (third panel). (B) Migration of WT (black), IgM−/− (blue), and IgD−/− (red) splenic B cells toward CXCL12 over a period of 4 h. (C) Quantification of cellular F-actin in IgM−/− (first panel, blue) and IgD−/− (second panel, red) splenic B cells via staining with phalloidin and flow-cytometric analysis after different time points of CXCL12 stimulation in untreated (solid line) and Syk-inhibited (dashed line) cells. (D) Spreading of IgM−/− and IgD−/− splenic B cells treated with Syk inhibitor or untreated control cells on surfaces coated with either anti-κ antibody or CXCL12. Cells were allowed to spread for 5 min, and then fixed and stained with DAPI and phalloidin to visualize F-actin. Quantification shows percentage of spreading cells per image. (E) 1-PLA analysis of CXCR4-Igκ proximity in resting WT, IgM−/−, and IgD−/− splenic B cells. (Scale bar in D and E: 5 μm.) Calcium flux analyses in A are representative of four independent experiments. Migration analyses in B represent median of six independent experiments. F-actin analyses in C and D represent mean ± SD of three independent experiments. PLA analyses in E represent mean ± SD of five or more independent experiments. *P < 0.05; **P < 0.01; ***P < 0.001; ns, not significant.
Fig. S2.
Signaling through CXCR4 is coupled to IgD, but not IgM. (A) Expression of BCR (κLC) in WT (black), IgM−/− (blue), and IgD−/− (red) splenic B cells by FACS analysis (Left) and MFI quantification (Right). (B) Expression of CXCR4 in WT (black), IgM−/− (blue), and IgD−/− (red) B cells by FACS analysis (Left) and MFI quantification in splenic (Middle) and circulating B cells (Right). (C) FACS analysis for binding of fluorescently labeled CXCL12 binding on WT (black), IgM−/− (blue), and IgD−/− (red) B cells. (D) Histogram of the normalized total calcium release response (area under curve) for 0.05, 0.5, 5.0, and 10.0 µg/mL of anti-κLC stimulations. The calcium signal at the given concentration was normalized to total BCR expression as determined by maximum anti-κLC staining with 10 µg/mL antibody. (E) Histogram of the normalized calcium release response at different concentrations of CXCL12 stimulation, normalized to total BCR expression as determined by anti-κLC staining with 10 µg/mL antibody. (F) Calcium flux measurement of WT (black), IgM−/− (blue), and IgD−/− (red) splenic B cells in response to 100 ng/mL CXCL12 in presence of 1 µM Syk inhibitor. (G) 1-PLA analysis of CXCR4–IgD proximity in resting WT, IgM−/−, and IgD−/− splenic B cells. (Scale bar: 5 μm.) FACS analyses of BCR and CXCR4 expression and CXCL12 binding in A–C are representative of six independent experiments. Calcium flux analyses in D and E represent mean ± SEM of four independent experiments. Calcium flux analyses in F is representative of four independent experiments. PLA analyses in G represent mean ± SD of four independent experiments. *P < 0.05; **P < 0.01; ***P < 0.001; ns, not significant.
In line with the calcium flux data, IgD−/− B cells showed strongly impaired migration toward CXCL12 (Fig. 2B). Likewise, actin dynamics in response to CXCL12 were defective in IgD−/−, but not in IgM−/− B cells (Fig. 2C), indicating that the initiation of signaling downstream of CXCR4 and subsequent events such as actin remodeling and migration are all IgD- and Syk-dependent processes. This was further confirmed by finding that B-cell spreading on CXCL12-coated surfaces also requires IgD expression and Syk function (Fig. 2D).
The finding that actin disruption and CXCL12 stimulation activate similar signaling events suggests a role for the actin cytoskeleton in mediating the cross talk between CXCR4 and IgD. In the light of this alliance and the concept of actin-regulated protein islands (25, 26), we investigated the proximity of the BCR and CXCR4 on the B-cell surface by PLA. We found that CXCR4 is localized in close proximity to the IgD–BCR (Fig. 2E and Fig. S2G), providing a structural component to the extensive cross talk.
CXCR4 Signals Are Processed Through CD19 and the IgD–BCR.
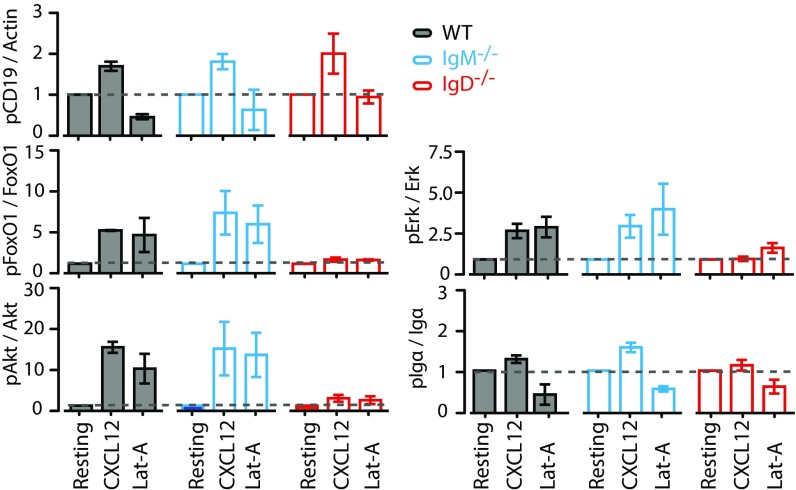
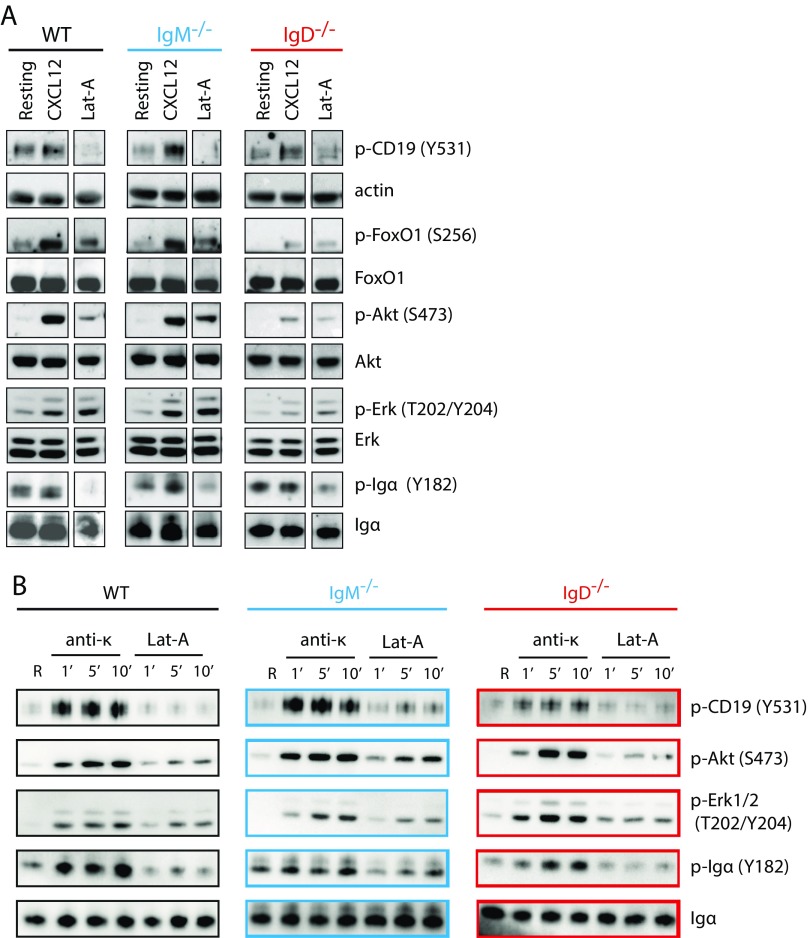
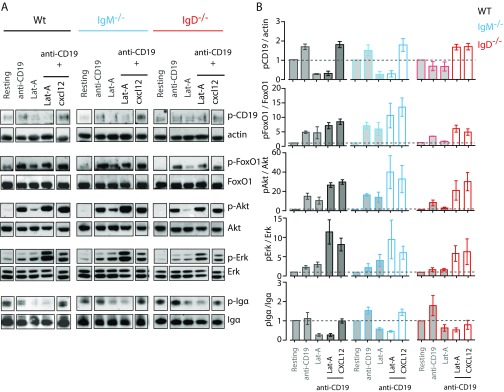
To understand how signals through CXCR4 are integrated via the IgD–BCR, we analyzed the activation of different signaling pathways, which are shared by both receptors. The PI3K/Akt/Foxo and Erk MAPK signaling pathways are both triggered downstream of CXCR4 and the BCR (6, 27). In B cells, the PI3K pathway is strongly regulated by CD19, which is localized in the vicinity of the IgD–BCR and IgM–BCR on resting and activated B cells, respectively (20). A Western blot analysis showed that CXCL12 stimulation induces the tyrosine (Y) phosphorylation of Y531 on CD19, independently of the expressed BCR class (Fig. 3 and Fig. S3A). In contrast, the expression of the IgD–BCR is required for the efficient phosphorylation of the PI3K downstream elements Akt and Foxo and of Erk upon stimulation of B cells with either CXCL12 or Lat-A, suggesting that the cross talk between CXCR4 and CD19 is BCR class dependent. An increased phosphorylation of Y182 of Igα also required IgD–BCR expression. However, at the level of CD19 and Igα phosphorylation, the Lat-A treatment of B cells did not resemble CXCL12 stimulation because cytoskeleton disruption could never induce phosphorylation of CD19 and even led to dephosphorylation of Igα. These findings suggest that extensive actin depolymerization may represent a negative regulatory signal for the BCR. As a control, we exposed splenic B cells from WT, IgM−/−, and IgD−/− mice to anti-κLC antibodies and found no difference of Akt and Erk signaling in these BCR-activated B cells (Fig. S3B).
Fig. 3.
Signaling through CXCR4 induces the Erk and Akt pathway in an IgD-dependent manner. Quantification of Western blot analysis of WT (gray), IgM−/− (blue), and IgD−/− (red) splenic B cells after stimulation with either 100 ng/mL CXCL12 or 1 µM Lat-A for 5 min compared with resting cells. Data represent mean ± SD of four independent experiments.
Fig. S3.
Signaling through CXCR4 induces the Erk and Akt pathway in an IgD-dependent manner. (A) Western blot analysis of WT (gray), IgM−/− (blue), and IgD−/− (red) splenic B cells after stimulation with either 100 ng/mL CXCL12 or 1 µM Lat-A for 5 min compared with resting cells. (B) Western blot analysis of WT (gray), IgM−/− (blue), and IgD−/− (red) splenic B cells after stimulation with either 5 µg/mL anti-κ or 1 µM Lat-A for 1, 5, and 10 min compared with resting cells.
CD19 Is a Positive Regulator of CXCR4 Signaling.
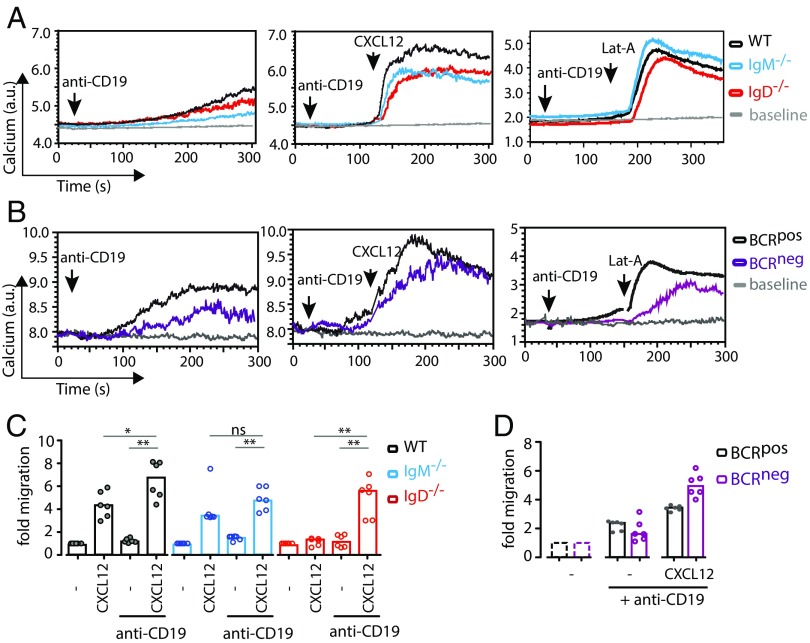
CD19 has been described previously as a positive regulator of BCR signaling, and it was shown that the coengagement of CD19 could significantly enhance BCR signaling (28). As our data suggest that CD19 is involved in the cross talk between CXCR4 and the IgD–BCR, we next asked whether the engagement of CD19 could enhance CXCR4 signaling. For this, we stimulated splenic B cells from WT, IgM−/−, or IgD−/− mice with an anti-CD19 antibody alone or together with either CXCL12 or Lat-A (Fig. 4A). Although anti-CD19 stimulation alone led to a very weak calcium response, sequential stimulation with anti-CD19 and CXCL12 or Lat-A induced a very strong response, which was BCR isotype independent (Fig. 4A). Intriguingly, even stimulation of BCRneg B cells with anti-CD19 plus CXCL12 or Lat-A induced a calcium response (Fig. 4B), suggesting that the BCR influences CD19 in its capacity to integrate signals emanating from CXCR4. Furthermore, because cytoskeleton disruption elicits a highly similar signaling pattern to CXCL12 stimulation, our data reveal that cross talk between these receptors is likely to be mediated by actin dynamics. Because in the course of an immune response, B cells have to be highly mobile, this finding provides an explanation for the severe immunodeficiencies that can result from mutations of actin regulatory genes (29).
Fig. 4.
CD19 acts as a dominant positive regulator of CXCR4 and cytoskeleton disruption induced signaling. (A) Calcium flux measurement of WT (black), IgM−/− (blue), and IgD−/− (red) splenic B cells in response to stimulation with 10 µg/mL anti-CD19 (first panel), anti-CD19 plus CXCL12 (second panel), and anti-CD19 plus Lat-A (third panel). (B) Calcium flux measurement of BCRpos (black) and BCRneg (purple) splenic B cells in response to stimulation with 10 µg/mL anti-CD19 (first panel), anti-CD19 + CXCL12 (second panel), and anti-CD19 + Lat-A (third panel). (C) Migration of WT (black), IgM−/− (blue), and IgD−/− (red) splenic B cells toward CXCL12, anti-CD19, or anti-CD19 plus CXCL12 over a period of 4 h. (D) Migration of BCRpos and BCRneg splenic B cells toward anti-CD19 or anti-CD19 plus CXCL12 over a period of 4 h. Calcium flux analyses in A and B are representative of three independent experiments. Migration analyses in C and D represent median of five or more independent experiments. *P < 0.05; **P < 0.01; ns, not significant.
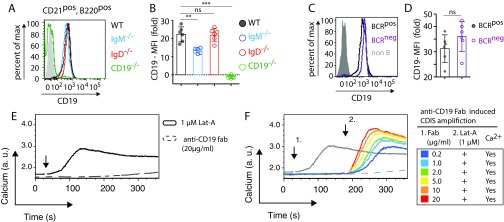
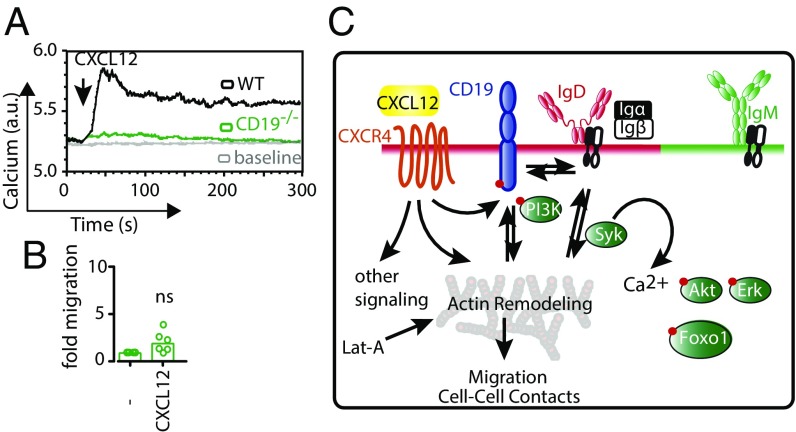
To connect this signaling phenotype to its physiological outcome, we also investigated migration of B cells toward CXCL12 and anti-CD19 antibody. In line with the signaling data, migration toward anti-CD19 and CXCL12 was much more efficient than migration toward CXCL12 alone, whereas anti-CD19 alone did not lead to a migratory response (Fig. 4 C and D). Interestingly, even IgD−/− and BCRneg B cells, which do not migrate toward CXCL12 alone, did so after addition of anti-CD19 antibody (Fig. 4 C and D). Note that all B cells analyzed express similar amounts of CD19 on their surface (Fig. S4 A–E). Furthermore, the enhancement of calcium flux via anti-CD19 stimulation does not require CD19 cross-linking, because a monovalent anti-CD19 Fab fragment is capable of inducing the same result (Fig. S4F). Finally, CD19-deficient splenic B cells do not respond to CXCL12 stimulation, neither by mobilizing calcium nor by migrating toward the chemokine (Fig. 5 A and B). Together, these data reveal the central role for CD19 in mediating signaling through CXCR4 leading to cell migration.
Fig. S4.
CD19 expression and boosting effect of anti-CD19 Fab fragment antibody. (A) Expression of CD19 in WT (black), IgM−/− (blue), and IgD−/− (red) splenic B cells by FACS analysis (B) MFI quantification of CD19 expression. (C) Expression of CD19 in BCRpos (black) and BCRneg (purple) splenic B cells by FACS analysis. (D) MFI quantification of CD19 expression in BCRpos (black) and BCRneg (purple) splenic B cells. (E) Calcium flux measurement in WT mature B cells in response to 1 µM Lat-A (black) and 20 µg/mL anti-CD19 Fab fragment (dashed gray) stimulation. (F) Ca2+ influx in WT mature B cells in response to increasing doses of anti-CD19 Fab fragment at the indicated time point (1.), followed by 1 µM Lat-A treatment at the time point (2.). The concentrations of anti-CD19 Fab fragment, represented by the colored lines, are indicated in the legend table. For comparison, the Ca2+ influx after 1 µM Lat-A or 20 µg/mL anti-CD19 Fab fragment treatment are shown as solid and dashed gray lines, respectively. FACS analyses of CD19 expression in A–D are representative of six independent experiments. Calcium flux analyses in E and F are representative of three independent experiments. **P < 0.01; ***P < 0.001; ns, not significant.
Fig. 5.
CD19 is the linchpin between CXCR4, the BCR, and the actin cytoskeleton. (A) Calcium flux measurement of WT (black) and CD19−/− (green) splenic B cells in response to 100 ng/mL CXCL12. (B) Migration of WT (black) and CD19−/− (green) splenic B cells toward CXCL12 over a period of 4 h. Calcium flux analyses in A and migration analysis in B are representative of four and six independent experiments, respectively. (C) Schematic representation shows plasma membrane localization of IgM and IgD on mature B cells and chemokine receptor CXCR4 that resides in the IgD–CD19 island. Upon engagement of CXCL12, CXCR4 triggers a multitude of signals including actin remodeling. As a result of actin remodeling, a Syk-dependent BCR signal, specifically through the IgD–BCR, is triggered, and a feedforward loop is initiated that induces Ca2+ influx, Akt/Foxo1 and Erk pathway activation in addition to F-actin reorganization. The later part of actin remodeling could also be initiated by cytoskeleton disruption using Lat-A, thus enabling the study of the effect of the chemokine-driven actin remodeling on the BCR.
To complete the picture of signaling through CXCR4 and CD19, we analyzed the activation of the aforementioned signaling pathways after stimulating splenic B cells with the combination of anti-CD19 and CXCL12 or Lat-A (Fig. S5). We found that, in all cell types, the Akt/Foxo and Erk pathways were strongly activated, despite a lack of Igα phosphorylation. We conclude that CXCR4 integrates its signals through CD19, a process that is directly aided by the IgD–BCR (Fig. 5B). However, the need for this BCR-mediated help can be efficiently circumvented by exogenous stimulation of CD19. The three receptors involved in this signaling circuit are located in close proximity as shown by our experiments and previous reports (20). Thus, we propose that the IgD protein island bears unique functions, such as the efficient integration of migratory cues from the B cell’s environment, assigning homeostatic functions specifically to the IgD–BCR. This concept is also of interest in the context of neoplastic B cells, which are highly dependent on CXCL12 for their growth and survival (30). Our data provide a unique view on the effects of kinase inhibitors as well as CKR inhibitors in patients with B-cell lymphomas and suggest CD19 as an interesting target in cancer therapy.
Fig. S5.
CD19 is a dominant-positive regulator of CXCR4 signaling and cytoskeleton disruption induced signaling. (A) Western blot analysis of WT (gray), IgM−/− (blue), and IgD−/− (red) splenic B cells after stimulation with 10 µg/mL anti-CD19 or the combination of anti-CD19 with either Lat-A or CXCL12, for 5 min compared with resting cells. (B) Quantification of Western blot analysis data represents mean ± SD of four independent experiments.
Materials and Methods
Experimental Mice.
We used the following mouse strains in this study: C57BL/6 WT, IgM−/− (31), IgD−/− (32), CD19−/− B cells from homozygous CD19creERT2/creERT2 mice (19, 33) and floxed B1-8HCknockin;HCJHT (14) crossed to mb1-creERT2 mice and induced as reported previously to generate BCRneg B cells (34). Induced splenic BCRneg B cells were isolated 8 d after tamoxifen treatment. All animal studies were conducted in mice aged 10–14 wk and were carried out at the Max Planck Institute of Immunobiology and Epigenetics animal facilities in accordance with the German Animal Welfare Act, having been reviewed and approved by the regional council.
Flow Cytometry.
Single-cell suspensions of spleen cells were maintained for short time in FACS buffer, containing PBS and 3% FCS and incubated with Fc blocking antibody, anti-CD16/CD32 (2.4G2) for 10 min at 4 °C before staining. For the antibody labeling, cells were incubated in FACS buffer for 15 min at 4 °C, followed by washing with PBS.
Calcium Flux Measurement.
For each Ca2+ influx analysis, 106 cells were loaded with Indo-1 (eBioscience) in Iscove’s medium containing 1% FCS as described previously (35). Where applicable, additional antibody staining was performed after Indo-1 loading as described for flow cytometry, but using medium instead of FACS buffer. The calcium measurement was performed on a BD Fortessa II. In brief, samples were prewarmed at 37 °C for 5 min. Next, baseline was measured for 1 min before addition of the stimulus. Cells were kept at 37 °C during the measurement.
Cell Spreading Assay.
Glass slides were coated with 1 µg/mL CXCL12 or 10 µg/mL anti-κLC in PBS for 1 h at 37 °C followed by one wash with PBS. Cells were allowed to settle for 5 min at room temperature (RT). After one PBS wash, cells were fixed with 4% PFA for 10 min at RT followed by permeabilization with 0.5% saponine and phalloidin and DAPI staining. Images were analyzed on a Zeiss LSM780 CLSM microscope.
Actin Remodeling Analysis.
Actin remodeling was analyzed by flow cytometry after stimulating cells with CXCL12 for different time points, followed by fixation with PFA for 10 min at RT and permeabilization with 0.5% saponine. F-actin was stained with phalloidin-A647 (Invitrogen). Biochemical quantification of F- and G-actin was performed using the G-Actin/F-Actin In Vivo Assay Biochem Kit (Cytoskeleton Inc.).
Cell Stimulation and Immunoblotting.
A total of 2 × 10⁶ primary B cells was resuspended in 500 µL of Iscove’s medium with 1% FCS and equilibrated at 37 °C for 10 min. Where indicated, cells were preincubated with 1 µM Syk Inhibitor Bay-61-3606 (Selleckchem) for 45 min at 37 °C. Cells were stimulated with CXCL12 (PeproTech) at 100 ng/mL, Lat-A at 1 µM (Cayman Chemicals), anti-κLC at 5 µg/mL (Southern Biotech), anti-CD19 biotin at 10 µg/mL (MB19-1; BioLegend) for the indicated time and immediately lysed in buffer containing 1% Triton X. Cleared lysates were subjected to 12% SDS/PAGE and subsequent immunoblotting.
Proximity Ligation Assay and Image Processing.
PLA experiments were performed by using PLA-probemaker reagents and Duolink II kit (Olink Bioscience) as previously described (36) and analyzed in “Blobfiner” software as described before (35, 37). The following purified antibodies were used: anti-κLC (RMK-12; BioLegend), anti-CXCR4 (L276F12; Biolegend), anti-IgD (MBS673001; Biozol), and anti-IgM (Biozol).
SI Materials and Methods
Experimental Mice.
We used the following mouse strains in this study: C57BL/6 WT, IgM−/− (31), IgD−/− (32), and CD19−/− B cells from homozygous CD19creERT2/creERT2 mice (19, 33), floxed B1- 8HCknockin (14) for HC-deleted B cells, and mb1-creERT2 (19) for inducible B-cell–specific deletion of floxed genes.
For inducible B-cell–specific deletion, mice were orally administered tamoxifen citrate (Ratiopharm) dissolved in 20% ClinOleic (Baxter) as described previously (19). The course of tamoxifen treatments and the interval between the doses were preoptimized for maximal recovery of the deleted cells as described previously (19).
Antibodies.
We used the following antibodies for the FACS analysis of mouse B cells: anti-CD19 (6D5) Alexa Fluor 488 (A488) conjugate, anti-B220 (RA3-6B2) peridinin chlorophyll-cyanine 5.5 (PerCP-Cy5.5) conjugate, anti-IgM (RMM-1) allophycocyanine-cyanine 7 (APC-Cy7) conjugate, anti-IgD (11-26c.2a) Alexa Fluor 647 (A647) conjugate, anti-CD1d (1B1) phycoerythrin (PE) conjugate, anti-CD21 APC (7E9), anti-CD5 PE/A488 (53-7.3), anti-Mac1 APC-Cy7 (M1/70), anti-CXCR4 (L276F12) Brilliant Violet 405 conjugate, and anti-κ LC (RMK-45) fluorescein isothiocyanate (FITC) conjugate (all from BioLegend); anti-CD19 (eBio1D3) eFluor 450 (eF450) conjugate, anti-IgM PE-Cy7 (II/41 and eB121-15F9), anti-CD23 PE-Cy7 (B3B4), and anti-CD43 PE (eBioR2/60) (all from eBioscience).
We used the following antibodies for detection on immunoblots: anti–phospho-Igα (Y182), anti–phospho-Akt (S473) and total Akt, anti–phospho-CD19 (Y531), anti–phospho-Erk1/2 (T202/Y204) and total Erk1/2, anti–phospho-FoxO1 (S256) and total FoxO1 (all Cell Signaling), and anti–β-actin (I-19; Santa Cruz Biotechnology).
Isolation of Mature Primary B Cells.
Total spleen cells were isolated from 10- to 14-wk-old mice, subjected to erythrocyte lysis followed by straining through a 30-μm CellTrics filter (Sysmex-Partec) to obtain a single-cell suspension. The mature naive B-cell population was enriched by depletion method using magnetic-activated cell sorting with anti-CD43 magnetic beads (Miltyeni Biotech) according to the manufacturers’ protocol. The sorted CD43− population was analyzed by FACS and found >90% CD19+, B220+ B cells. Before analysis, the isolated B cells were incubated for 3 h at 37 °C in presence of 7.5% CO2, in Iscove’s medium (Biochrom) supplemented with 10% FCS (PAN Biotech), 50 μM β-mercaptoethanol (Sigma-Aldrich), and 10 units/mL penicillin and streptomycin (Life Technologies).
Calcium Flux Stimuli.
Cells were stimulated with Lat-A 1 μM (Cayman Chemicals), 5 μg/mL anti-κ LC (Southern Biotech), 5 μg/mL anti-CD19 (MB19-1; eBioscience), and 100 ng/mL recombinant murine CXCL12 (PeproTech).
Proximity Ligation Assay and Image Processing.
PLA experiments were done as previously described (5). For Fab-PLA, Fab fragments from anti IgD (LO-MD-6) and anti IgM (RMM-1) were prepared by the Fab-Micro preparation kit and desalted with Zeba spin columns (Thermo Fisher Scientific) according to the manufacturer’s protocol. For 1-PLA, the following purified antibodies were used: anti-CD19 (6D5), anti-κ (RMK-45), anti-IgD (LO-MD-6), and anti-CXCR4 (L276F12). In brief, the purified Fabs (20–50 μg) or the antibodies (50 μg) were coupled with PLA-probemaker PLUS or MINUS oligonucleotides according to the manufacturer’s instructions (Olink Bioscience) to generate PLA probes (PLUS and MINUS). To perform the in situ PLA assay, cells were settled on PTFE slides (Thermo Fisher Scientific) for 30 min, stimulated, and then fixed with 4% paraformaldehyde in PBS at RT for 12 min. The fixed cells on glass slides were incubated in blocking buffer containing 250 μg/mL BSA and 2.5 μg/mL sonicated salmon sperm DNA in PBS, followed by incubation with 1–5 μg/mL of each PLA probe. To optimize the conditions of PLA and minimize the background signal, we first titrated the PLA reagents on naive B cells from WT and respective knockout mice. The PLA reaction and signal amplification were performed with the Duolink II kit according to the manufacturer’s instructions. Finally, the PLA results were analyzed in a Zeiss LSM780 confocal microscope (Carl Zeiss) using a Zeiss 63× oil-immersion objective and quantified by counting the PLA dots corresponding to DAPI-stained nucleus using “Blobfiner” software as described before (35, 37).
Acknowledgments
We thank Klaus Rajewsky for providing the floxed B1-8HCknockin mice for inducible deletion of the BCR. Furthermore, we thank Jana Dautzenberg for excellent technical assistance. We also thank A. Würch and S. Hobitz from the Max Planck Institute of Immunobiology and Epigenetics FACS facility for excellent technical support. This study was supported by the Excellence Initiative of the German Federal and State Governments (EXC 294), by European Research Council Grant 322972 and by the Deutsche Forschungsgemeinschaft through SFB746 and TRR130 (to M.R.). E.H. is partly supported by SFB 1047 Project A9. This study was supported in part by the International Max Planck Research School for Molecular and Cellular Biology (M.B.).
Footnotes
The authors declare no conflict of interest.
This article is a PNAS Direct Submission.
This article contains supporting information online at www.pnas.org/lookup/suppl/doi:10.1073/pnas.1621512114/-/DCSupplemental.
References
- 1.Reth M. Antigen receptors on B lymphocytes. Annu Rev Immunol. 1992;10:97–121. doi: 10.1146/annurev.iy.10.040192.000525. [DOI] [PubMed] [Google Scholar]
- 2.Kerr WG, Hendershot LM, Burrows PD. Regulation of IgM and IgD expression in human B-lineage cells. J Immunol. 1991;146:3314–3321. [PubMed] [Google Scholar]
- 3.Geisberger R, Lamers M, Achatz G. The riddle of the dual expression of IgM and IgD. Immunology. 2006;118:429–437. doi: 10.1111/j.1365-2567.2006.02386.x. [DOI] [PMC free article] [PubMed] [Google Scholar]
- 4.Hobeika E, Maity PC, Jumaa H. Control of B cell responsiveness by isotype and structural elements of the antigen receptor. Trends Immunol. 2016;37:310–320. doi: 10.1016/j.it.2016.03.004. [DOI] [PubMed] [Google Scholar]
- 5.Maity PC, et al. B cell antigen receptors of the IgM and IgD classes are clustered in different protein islands that are altered during B cell activation. Sci Signal. 2015;8:ra93. doi: 10.1126/scisignal.2005887. [DOI] [PubMed] [Google Scholar]
- 6.Dal Porto JM, et al. B cell antigen receptor signaling 101. Mol Immunol. 2004;41:599–613. doi: 10.1016/j.molimm.2004.04.008. [DOI] [PubMed] [Google Scholar]
- 7.Otipoby KL, et al. The B-cell antigen receptor integrates adaptive and innate immune signals. Proc Natl Acad Sci USA. 2015;112:12145–12150. doi: 10.1073/pnas.1516428112. [DOI] [PMC free article] [PubMed] [Google Scholar]
- 8.Schweighoffer E, et al. The BAFF receptor transduces survival signals by co-opting the B cell receptor signaling pathway. Immunity. 2013;38:475–488. doi: 10.1016/j.immuni.2012.11.015. [DOI] [PMC free article] [PubMed] [Google Scholar]
- 9.Jellusova J, et al. Context-specific BAFF-R signaling by the NF-κB and PI3K pathways. Cell Rep. 2013;5:1022–1035. doi: 10.1016/j.celrep.2013.10.022. [DOI] [PMC free article] [PubMed] [Google Scholar]
- 10.Mattila PK, Batista FD, Treanor B. Dynamics of the actin cytoskeleton mediates receptor cross talk: An emerging concept in tuning receptor signaling. J Cell Biol. 2016;212:267–280. doi: 10.1083/jcb.201504137. [DOI] [PMC free article] [PubMed] [Google Scholar]
- 11.Baeker TR, Simons ER, Rothstein TL. Cytochalasin induces an increase in cytosolic free calcium in murine B lymphocytes. J Immunol. 1987;138:2691–2697. [PubMed] [Google Scholar]
- 12.Treanor B, et al. The membrane skeleton controls diffusion dynamics and signaling through the B cell receptor. Immunity. 2010;32:187–199. doi: 10.1016/j.immuni.2009.12.005. [DOI] [PMC free article] [PubMed] [Google Scholar]
- 13.Mattila PK, et al. The actin and tetraspanin networks organize receptor nanoclusters to regulate B cell receptor-mediated signaling. Immunity. 2013;38:461–474. doi: 10.1016/j.immuni.2012.11.019. [DOI] [PubMed] [Google Scholar]
- 14.Lam KP, Kühn R, Rajewsky K. In vivo ablation of surface immunoglobulin on mature B cells by inducible gene targeting results in rapid cell death. Cell. 1997;90:1073–1083. doi: 10.1016/s0092-8674(00)80373-6. [DOI] [PubMed] [Google Scholar]
- 15.Ganguly S, Saxena R, Chattopadhyay A. Reorganization of the actin cytoskeleton upon G-protein coupled receptor signaling. Biochim Biophys Acta. 2011;1808:1921–1929. doi: 10.1016/j.bbamem.2011.04.001. [DOI] [PubMed] [Google Scholar]
- 16.Viola A, Luster AD. Chemokines and their receptors: Drug targets in immunity and inflammation. Annu Rev Pharmacol Toxicol. 2008;48:171–197. doi: 10.1146/annurev.pharmtox.48.121806.154841. [DOI] [PubMed] [Google Scholar]
- 17.Nie Y, et al. The role of CXCR4 in maintaining peripheral B cell compartments and humoral immunity. J Exp Med. 2004;200:1145–1156. doi: 10.1084/jem.20041185. [DOI] [PMC free article] [PubMed] [Google Scholar]
- 18.Allen CD, et al. Germinal center dark and light zone organization is mediated by CXCR4 and CXCR5. Nat Immunol. 2004;5:943–952. doi: 10.1038/ni1100. [DOI] [PubMed] [Google Scholar]
- 19.Hobeika E, et al. CD19 and BAFF-R can signal to promote B-cell survival in the absence of Syk. EMBO J. 2015;34:925–939. doi: 10.15252/embj.201489732. [DOI] [PMC free article] [PubMed] [Google Scholar]
- 20.Kläsener K, Maity PC, Hobeika E, Yang J, Reth M. B cell activation involves nanoscale receptor reorganizations and inside-out signaling by Syk. eLife. 2014;3:e02069. doi: 10.7554/eLife.02069. [DOI] [PMC free article] [PubMed] [Google Scholar]
- 21.Kumar A, et al. CXCR4 physically associates with the T cell receptor to signal in T cells. Immunity. 2006;25:213–224. doi: 10.1016/j.immuni.2006.06.015. [DOI] [PubMed] [Google Scholar]
- 22.Kumar A, Kremer KN, Sims OL, Hedin KE. Measuring the proximity of T-lymphocyte CXCR4 and TCR by fluorescence resonance energy transfer (FRET) Methods Enzymol. 2009;460:379–397. doi: 10.1016/S0076-6879(09)05219-7. [DOI] [PMC free article] [PubMed] [Google Scholar]
- 23.Patrussi L, Baldari CT. Intracellular mediators of CXCR4-dependent signaling in T cells. Immunol Lett. 2008;115:75–82. doi: 10.1016/j.imlet.2007.10.012. [DOI] [PubMed] [Google Scholar]
- 24.Brink R, Goodnow CC, Basten A. IgD expression on B cells is more efficient than IgM but both receptors are functionally equivalent in up-regulation CD80/CD86 co-stimulatory molecules. Eur J Immunol. 1995;25:1980–1984. doi: 10.1002/eji.1830250727. [DOI] [PubMed] [Google Scholar]
- 25.Kusumi A, et al. Dynamic organizing principles of the plasma membrane that regulate signal transduction: Commemorating the fortieth anniversary of Singer and Nicolson’s fluid-mosaic model. Annu Rev Cell Dev Biol. 2012;28:215–250. doi: 10.1146/annurev-cellbio-100809-151736. [DOI] [PubMed] [Google Scholar]
- 26.Maity PC, Yang J, Klaesener K, Reth M. The nanoscale organization of the B lymphocyte membrane. Biochim Biophys Acta. 2015;1853:830–840. doi: 10.1016/j.bbamcr.2014.11.010. [DOI] [PMC free article] [PubMed] [Google Scholar]
- 27.Pozzobon T, Goldoni G, Viola A, Molon B. CXCR4 signaling in health and disease. Immunol Lett. 2016;177:6–15. doi: 10.1016/j.imlet.2016.06.006. [DOI] [PubMed] [Google Scholar]
- 28.Fujimoto M, Poe JC, Hasegawa M, Tedder TF. CD19 amplification of B lymphocyte Ca2+ responses: A role for Lyn sequestration in extinguishing negative regulation. J Biol Chem. 2001;276:44820–44827. doi: 10.1074/jbc.M107559200. [DOI] [PubMed] [Google Scholar]
- 29.Moulding DA, Record J, Malinova D, Thrasher AJ. Actin cytoskeletal defects in immunodeficiency. Immunol Rev. 2013;256:282–299. doi: 10.1111/imr.12114. [DOI] [PMC free article] [PubMed] [Google Scholar]
- 30.Burger JA, Kipps TJ. CXCR4: A key receptor in the crosstalk between tumor cells and their microenvironment. Blood. 2006;107:1761–1767. doi: 10.1182/blood-2005-08-3182. [DOI] [PubMed] [Google Scholar]
- 31.Lutz C, et al. IgD can largely substitute for loss of IgM function in B cells. Nature. 1998;393:797–801. doi: 10.1038/31716. [DOI] [PubMed] [Google Scholar]
- 32.Nitschke L, Kosco MH, Köhler G, Lamers MC. Immunoglobulin D-deficient mice can mount normal immune responses to thymus-independent and -dependent antigens. Proc Natl Acad Sci USA. 1993;90:1887–1891. doi: 10.1073/pnas.90.5.1887. [DOI] [PMC free article] [PubMed] [Google Scholar]
- 33.Yasuda T, et al. Studying Epstein-Barr virus pathologies and immune surveillance by reconstructing EBV infection in mice. Cold Spring Harb Symp Quant Biol. 2013;78:259–263. doi: 10.1101/sqb.2013.78.020222. [DOI] [PubMed] [Google Scholar]
- 34.Levit-Zerdoun E, et al. Survival of Igα-deficient mature b cells requires BAFF-R function. J Immunol. 2016;196:2348–2360. doi: 10.4049/jimmunol.1501707. [DOI] [PubMed] [Google Scholar]
- 35.Infantino S, et al. Arginine methylation of the B cell antigen receptor promotes differentiation. J Exp Med. 2010;207:711–719. doi: 10.1084/jem.20091303. [DOI] [PMC free article] [PubMed] [Google Scholar]
- 36.Müller J, et al. CD22 ligand-binding and signaling domains reciprocally regulate B-cell Ca2+ signaling. Proc Natl Acad Sci USA. 2013;110:12402–12407. doi: 10.1073/pnas.1304888110. [DOI] [PMC free article] [PubMed] [Google Scholar]
- 37.Allalou A, Wählby C. BlobFinder, a tool for fluorescence microscopy image cytometry. Comput Methods Programs Biomed. 2009;94:58–65. doi: 10.1016/j.cmpb.2008.08.006. [DOI] [PubMed] [Google Scholar]


