Significance
The role of tight junction in water homeostasis is an important but understudied area. Here, we reveal a paracellular water permeation pathway made by the tricellular tight junction and regulated by its integral protein, known as Ildr1. The importance of paracellular water permeation is demonstrated here with emphasis of its potential role in causing urinary concentrating defects in the kidney. Ildr1 and its related proteins, Ildr2 and Ildr3, may play broader physiologic roles to establish the water homeostasis in other organs, such as the skin, the lung, and the intestine.
Keywords: tight junction, water channel, nephrology, diuresis, diabetes insipidus
Abstract
Whether the tight junction is permeable to water remains highly controversial. Here, we provide evidence that the tricellular tight junction is important for paracellular water permeation and that Ig-like domain containing receptor 1 (ILDR1) regulates its permeability. In the mouse kidney, ILDR1 is localized to tricellular tight junctions of the distal tubules. Genetic knockout of Ildr1 in the mouse kidney causes polyuria and polydipsia due to renal concentrating defects. Microperfusion of live renal distal tubules reveals that they are impermeable to water in normal animals but become highly permeable to water in Ildr1 knockout animals whereas paracellular ionic permeabilities in the Ildr1 knockout mouse renal tubules are not affected. Vasopressin cannot correct paracellular water loss in Ildr1 knockout animals despite normal effects on the transcellular aquaporin-2–dependent pathway. In cultured renal epithelial cells normally lacking the expression of Ildr1, overexpression of Ildr1 significantly reduces the paracellular water permeability. Together, our study provides a mechanism of how cells transport water and shows how such a mechanism may be exploited as a therapeutic approach to maintain water homeostasis.
Tight junctions (TJs) are known to be leaky to ions and, thus, to constitute a paracellular pathway with ionic permselectivity similar to that of transmembrane channels (1). Whether the TJ is permeable to water, on the other hand, has been highly controversial. Jorge Fischbarg noticed that the corneal endothelium retained over 60% of water permeability even when AQP1, the only aquaporin expressed by these cells, was knocked out by genetic deletion (2). Rosenthal et al. have demonstrated that, in cultured renal epithelium expressing the claudin-2 protein, transepithelial water permeability was significantly higher than in cells without its expression (3). Using an optical microscopic approach, Spring and coworkers have directly measured the velocity of water flow across the tight junction and have ruled out the existence of any significant transjunctional water flow, at least for the bicellular TJ (bTJ) (4). The tricellular tight junction (tTJ) is a specialized cell junction different in ultrastructure from that of the bTJ (5). Unlike the bTJ, which is made of claudin and occludin (6), the proteins making the tTJ include tricellulin and angulins (LSR/angulin-1, ILDR1/angulin-2, and ILDR2/angulin-3) (7, 8). Transgenic knockout (KO) of either tricellulin or Ildr1 in mice causes hearing loss due to degeneration of mechanosensory cochlear hair cells in the organ of Corti (9, 10). Peculiarly, neither the endocochlear potential nor the paracellular permeability in the stria vascularis changed in these mutant animals. The permeation property of tTJ therefore remains a major mystery.
There are two forms of diabetes insipidus (DI): central (neurogenic) and nephrogenic. The nephrogenic DI (NDI) is caused by the inability of the kidney to reabsorb water. NDI is hereditary and has been linked to two genetic loci. The most common genetic cause (in 95% of cases) is an X-linked disorder mapped to the type-2 vasopressin receptor (AVPR2) gene in the X chromosome, mutation of which makes the collecting duct cells insensitive to vasopressin (11). The second cause is an autosomal recessive disorder linked to the aquaporin-2 (Aqp2) gene in chromosome 12, and the sites of mutations were found to be functionally important in making the water permeation pore (12) or facilitating proper intracellular trafficking (13). Whether there may exist any previously unknown gene important for renal water reabsorption is a tantalizing question. Here, we have revealed that homozygous deletion of the ILDR1 gene, which encodes a TJ protein controlling the putative paracellular water pathway, can cause NDI-like phenotypes in the mouse kidney.
Results
The Gene Expression of ILDR1 in the Kidney.
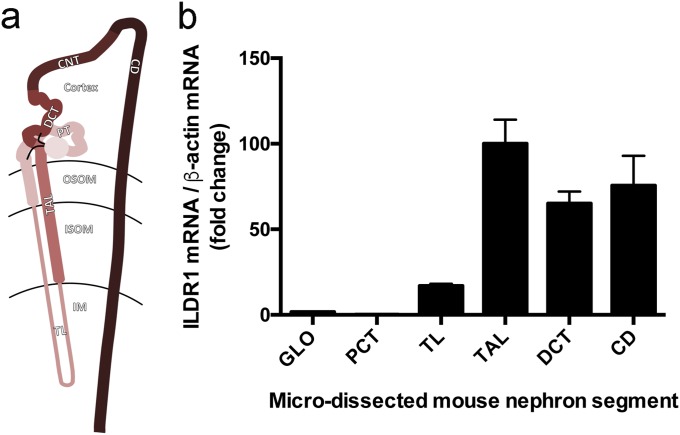
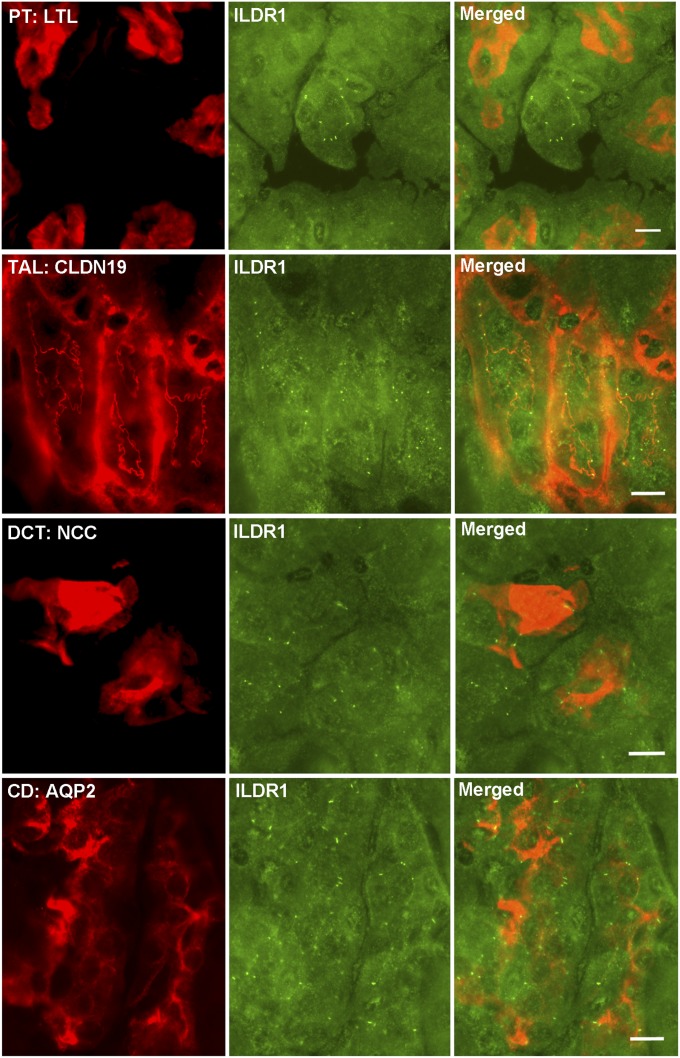
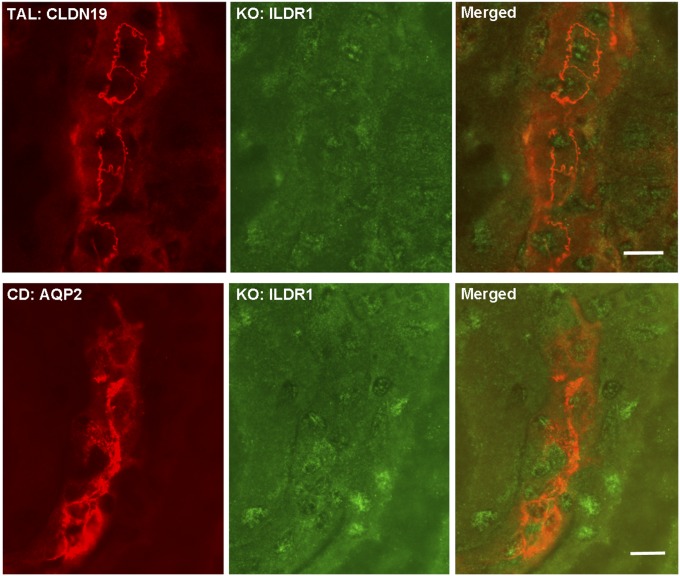
Whether the kidney expresses ILDR1 has not been determined before. We first performed microdissection on mouse kidneys to isolate each nephron segment, including the glomerulus, the proximal tubule (PT), the thin limb (TL) and the thick limb (TAL) of the loop of Henle, the distal convoluted tubule (DCT), and the collecting duct (CD), obeying a rigorous anatomic criterion (14) (Fig. S1A). Quantitative RT-PCR revealed that the distal nephron, from the TAL to the CD, expressed the highest levels of ILDR1 mRNA, which were over 58-fold higher than in the glomerulus and over 454-fold higher than in the PT (Fig. S1B). To reveal the cellular localization pattern of ILDR1 protein along the nephron, we performed colocalization analyses using molecular markers against each nephron segment. In WT mouse kidneys, ILDR1 proteins were detected in the tricellular junctions of renal tubules lacking the Lotus tetragonolobus lectin (a PT marker), but expressing the claudin-19 protein (a TAL marker) (15), the NCC protein (a DCT marker) (16), and the Aqp2 protein (a CD marker) (17) (Fig. 1). The ILDR1 antibody specificity was demonstrated by staining the ILDR1 knockout mouse kidney (Fig. S2). Thus, ILDR1 is expressed in the distal tubules of the kidney.
Fig. S1.
ILDR1 gene expression in the kidney. (A) Diagram showing the axial segments of the nephron. CD, collecting duct; CNT, connecting tubule; DCT, distal convoluted tubule; IM, inner medulla; ISOM, inner stripe of outer medulla; OSOM, outer stripe of outer medulla; PCT, proximal convoluted tubule; TAL, thick ascending limb; TL, thin limb. (B) ILDR1 mRNA levels relative to β-actin mRNA levels in microdissected nephron segments. n = 3 animals, averaged from ∼50 microdissected tissues for each segment. Microdissection criteria: (i) PCT, DCT, and TAL joined at glomerulus/macula densa are dissected out; (ii) glomerulus and PCT are separated from macula densa; (iii) PCT is separated from glomerulus, and DCT is separated from TAL free of any junctional tissue—macula densa; (iv) CD separated from DCT and TL separated from TAL according to morphological differences.
Fig. 1.
ILDR1 protein localization in the kidney. Double staining of ILDR1 protein with a PT marker (LTL), with a TAL marker (CLDN19), with a DCT marker (NCC), and with a CD marker (Aqp2). (Scale bars: 10 μm.)
Fig. S2.
ILDR1 antibody specificity in ILDR1 KO kidney sections. ILDR1 protein staining in ILDR1 KO mouse kidney samples showed loss of the tricellular junction localization pattern in the TAL tubule (counterstained with CLDN19) or CD tubule (counterstained with Aqp2). (Scale bars: 10 μm.)
The Renal Phenotypes of ILDR1 KO Mice.
ILDR1 KO mice have been generated, described, and validated before (18). The age-matched (4-mo-old) and sex-matched (male) ILDR1 KO mice (ILDR1−/−) and their littermate control mice (ILDR1+/+) were maintained on a regular salt diet (0.24% Na+ and 0.30% Cl−) with free access to water and subjected to 24-h metabolic cage analyses. The body weight (BW) was significantly lower in KO than in control animals (Table 1). The KO mice developed pronounced polyuria and polydipsia. Their urinary volume (UV) output was 5.8-fold higher than that of control mice (Table 1), and their water intake was 9.0-fold higher than that of control mice (Table 1). The significant urinary volume loss was accompanied by a 74% reduction in urinary osmolality (Table 1), indicating that the kidneys in KO animals were not able to retain water properly. The creatinine clearance (CCr) rates, as direct estimates of the glomerular filtration rate (GFR), were well-defended in KO animals (Table 1), suggesting that the urinary volume loss was not due to glomerular filtration rate differences. Because diuresis could be an effect of natriuresis or chloriuresis, we determined the kidney’s ability to handle salt. The absolute urinary excretion rates for Na+ (ENa) (Table 1) and Cl− (ECl) (Table 1) were similar between KO and control animals. The fractional excretion rates (FENa, FECl) for Na+ and Cl− relative to renal creatinine metabolism rates and the plasma Na+ and Cl− levels (PNa, PCl) were not altered in KO animals (Table 1). Compatible with well-preserved salt handling by the kidney, the mean blood pressure (BP) was not different between KO and control animals (Table 1), indicating that the urinary volume loss did not elicit a significant effect on the extracellular fluid volume (ECFV). Hypokalemia has been associated with polyuria due to down-regulation of Aqp2 in the collecting duct (19). No K+ deregulation was present in KO mice (Table 1), clearly distinguishing their phenotypes from Bartter syndrome or Gitelman syndrome. Hypercalcemia or hypercalciuria has also been associated with polyuria, presumably due to activation of the calcium-sensing receptor (CaSR) located in the basolateral membrane of the thick ascending limb or the luminal membrane of the collecting duct, respectively, and impairment of renal concentrating ability (20, 21). There was no difference in plasma Ca2+ levels between KO and control animals (Table 1). The urinary excretion rates (absolute excretion, ECa, and fractional excretion, FECa), however, were significantly increased by 3.0- and 3.3-fold, respectively. Because KO animals excreted more water than calcium, the urinary calcium concentration was in fact lower in KO than in control animals. Thus, loss of function in ILDR1 can cause primary renal concentrating defect in mice.
Table 1.
Renal metabolism in ILDR1 KO and control mice
| Physiologic parameters | Group | Significance (n = 10) | |
| Control | KO | ||
| Weight, g | 34.27 ± 1.48 | 27.26 ± 0.61 | P < 0.01 |
| UV, µL/24 h per g | 49.47 ± 5.73 | 287.80 ± 38.22 | P < 0.01 |
| Water Intake, mL/24 h per g | 0.14 ± 0.02 | 1.26 ± 0.12 | P < 0.01 |
| Osm, Osm/kg H2O | 1.46 ± 0.12 | 0.39 ± 0.05 | P < 0.01 |
| Inner medullary Osm, Osm/kg H2O | 0.76 ± 0.08 | 0.32 ± 0.07 | P < 0.01 (n = 5) |
| CCr, mL/24 h per g | 4.52 ± 0.83 | 3.84 ± 0.57 | n.s. |
| Mean BP, mmHg | 103.4 ± 2.2 | 98.6 ± 2.3 | n.s. |
| PCa, mmol/L | 2.12 ± 0.05 | 2.09 ± 0.04 | n.s. |
| PNa, mmol/L | 145.45 ± 1.78 | 149.72 ± 1.25 | n.s. |
| PCl, mmol/L | 107.22 ± 0.57 | 108.68 ± 0.59 | n.s. |
| PK, mmol/L | 3.58 ± 0.29 | 3.82 ± 0.44 | n.s. |
| FECa, % | 0.70 ± 0.21 | 2.34 ± 0.59 | P < 0.05 |
| ECa, µmol/24 h per g | 0.056 ± 0.018 | 0.167 ± 0.039 | P < 0.05 |
| FENa, % | 0.93 ± 0.18 | 1.13 ± 0.22 | n.s. |
| ENa, µmol/24 h per g | 5.14 ± 0.78 | 5.39 ± 0.97 | n.s. |
| FECl, % | 1.25 ± 0.25 | 1.36 ± 0.28 | n.s. |
| ECl, µmol/24 h per g | 5.01 ± 0.70 | 5.32 ± 1.04 | n.s. |
| FEK, % | 20.36 ± 4.21 | 30.74 ± 8.82 | n.s. |
| EK, µmol/24 h per g | 2.61 ± 0.27 | 3.13 ± 0.49 | n.s. |
EK, absolute excretion rate of K+; FEK, fractional excretion rate of K+; n.s., not significant; PCa, plasma concentration of Ca++; PK, plasma concentration of K+.
Microperfusion of Thick Ascending Limb Tubules from ILDR1 KO Mice.
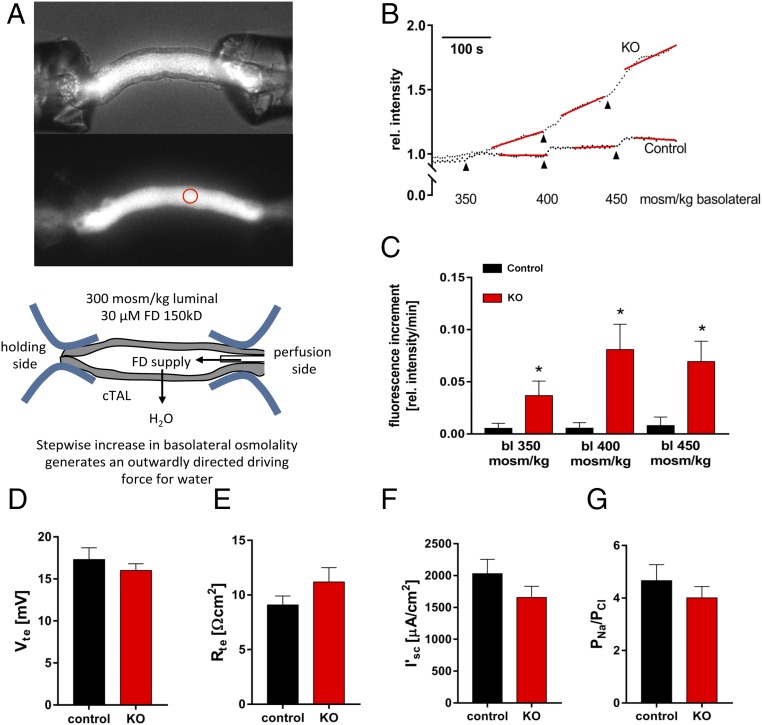
Since the late1950s, the countercurrent multiplication hypothesis has been the widely accepted explanation for the generation of the osmolality gradient along the cortico-medullary axis, which in turn drives water reabsorption in the collecting duct through Aqp2 (22). This hypothesis holds that the osmotic pressure difference between the lumen and the interstitium generated by the thick ascending limb (TAL) of the loop of Henle is multiplied because the fluid flows in the opposite direction from the thin descending limb to the TAL. The driving force of this process depends upon the effective separation of salt reabsorption from water impermeation in the TAL, which creates the osmotic pressure difference that can then be multiplied. The TAL was previously considered water impermeable. We performed ex vivo perfusion experiments on microdissected TAL tubules from control and ILDR1 KO animals (Fig. 2A). To record the water permeability across the microperfused tubule, a high molecular weight fluorescent dye (FITC-dextran, 150 kDa, 30 μM) was included in the perfusate (Table S1), which was too large to permeate through the epithelium. Then, the open end of the microperfused tubule was sealed, allowing stepwise increases in basolateral osmolality to generate an outward osmotic gradient that drives water to leave the tubule. The loss of water would be inversely proportional to increases in luminal fluorescence intensity (Fig. 2B). Consistent with the requirement of the countercurrent multiplication theory, the microperfused TAL tubules in control mice were impermeable to water, reflected by a nearly flat fluorescence intensity curve. The microperfused TAL tubules from KO mice, in contrast, showed stepwise increases in luminal fluorescence intensity (Fig. 2B). The fluorescence increment, measured as Δfluorescence intensity per minute, reflected the water permeation velocity. As shown in Fig. 2C, the water permeation velocity for each 50 mOsm/kg step was below 0.01 in control TAL tubules whereas KO TAL tubules had a maximum of more than eightfold higher water permeation velocity. The inner medullary interstitial osmolality was significantly reduced in the KO mouse kidney (Table 1). Together, these results establish that deletion of ILDR1 in the kidney dissipates the cortico-medullary osmolality gradient due to increased water permeability in the TAL.
Fig. 2.
Ex vivo microperfusion of thick ascending limb from ILDR1 KO kidney. (A) Light microscopy demonstration of the microperfusion system with live TAL tubules in perfusion with 150 kDa FITC-dextran in the lumen. The luminal fluorescence intensity was measured continuously at the focal point depicted by the red circle. (B) Real-time luminal FITC fluorescence intensity recording after stepwise increases in basolateral osmolality. (C) Fluorescence increment values as a direct measure of water permeation velocity in KO and control TAL tubules. *P < 0.05, n = 6 animals, data are given as mean ± SEM of nine and six perfused TAL. (D) Transepithelial voltage Vte measurement in KO and control TAL tubules. (E) Transepithelial resistance Rte measurement in KO and control TAL tubules. (F) Equivalent short-circuit current I’sc measurement in KO and control TAL tubules. (G) Paracellular permeability ratio PNa/PCl in control and KO TAL tubules. (D–G) Data are shown of 10 to 14 individual TAL tubules, n = 6 animals.
Table S1.
Renal tubule microperfusion solutions
| Solute | Experimental solution | ||||||
| Dissection solution | 150 | 300 | 350 | 400 | 450 | 30 NaCl | |
| Calculated osmolality (mosm/kg) | 300 | 150 | 300 | 350 | 400 | 450 | 300 |
| NaCl* | 140 | 72.5 | 145 | 161 | 178 | 195 | 30 |
| KH2PO4* | 0.4 | 0.2 | 0.4 | 0.4 | 0.4 | 0.4 | 0.4 |
| K2HPO4* | 1.6 | 0.8 | 1.6 | 1.6 | 1.6 | 1.6 | 1.6 |
| MgSO4* | 1 | ||||||
| MgCl2* | 0.5 | 1 | 1 | 1 | 1 | 1 | |
| Ca-gluconate* | 1.3 | 0.65 | 1.3 | 1.3 | 1.3 | 1.3 | 1.3 |
| Glucose* | 2.5 | 5 | 5 | 5 | 5 | 5 | |
| Urea* | 16 | 33 | 50 | ||||
| Na-acetate* | 10 | ||||||
| α-Ketoglutarate* | 1 | ||||||
| Mannitol* | 230 | ||||||
Empty cells represent zero solution.
Values are concentrations in mmol/L. pH was adjusted to 7.4 by NaOH/KOH or HCl.
The Paracellular Ionic Permeability Remains Intact in ILDR1 KO Mice.
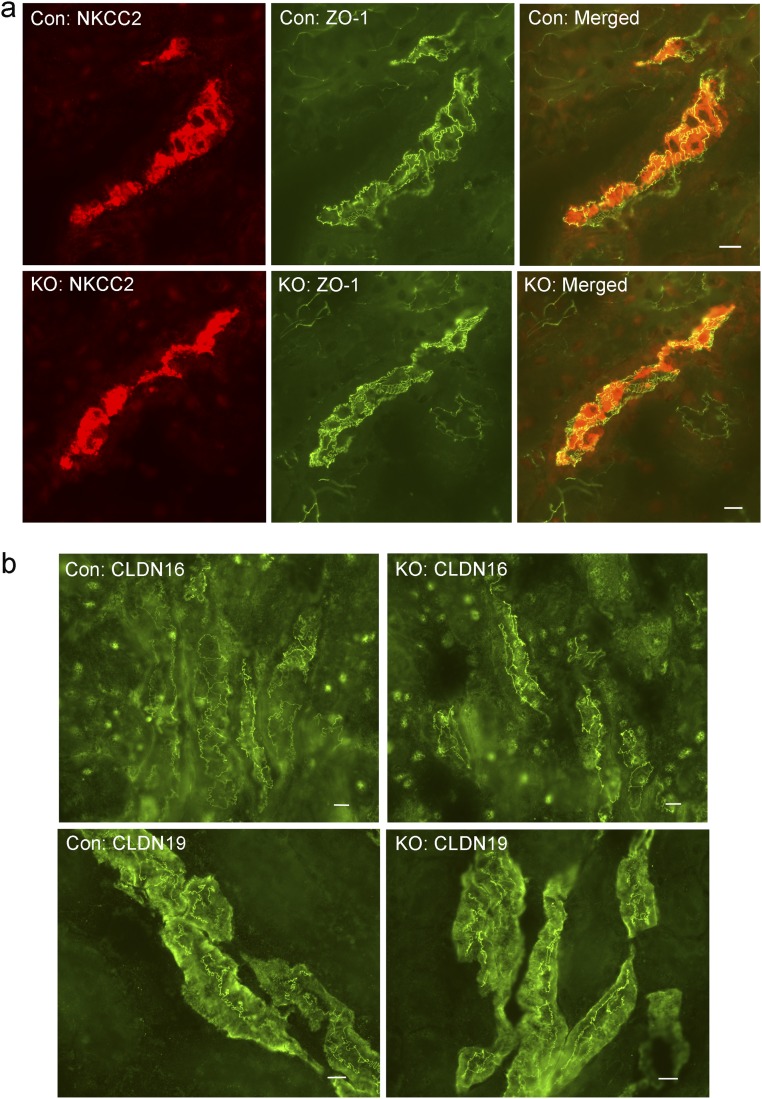
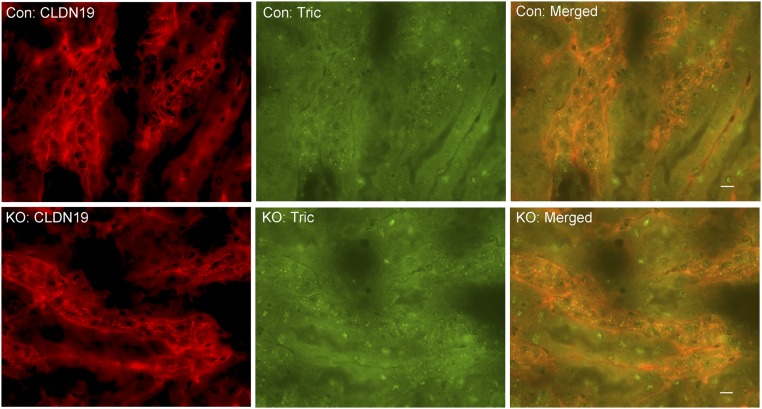
Our previous studies of claudins [e.g., claudin-16 and claudin-19 from an inherited human disease—familial hypomagnesemia and hypercalciuria with nephrocalcinosis (FHHNC) (OMIM 248190)] have established that the tight junction, in particular the bicellular tight junction, is responsible for paracellular cation permeation (23). To verify that changes in tTJ permeability were not byproducts of changes in bTJ, we recorded the electrophysiological profile of microperfused TAL tubules from control and ILDR1 KO mice, including the transepithelial voltage (Vte), the transepithelial resistance (Rte), the equivalent short-circuit current (I’sc), and the permeability ratio (PNa/PCl), as described before (24). As shown in Fig. 2 D–G, none of these parameters differed between KO and control animals, indicating that the bTJ permeabilities to Na+ and Cl− were not affected by tTJ alteration. Further immunostaining of ZO-1, as an indicator of bTJ integrity, and claudin-16 and -19, as indicators of bTJ functionality, and NKCC2 as an indicator of transcellular ionic permeability, showed no difference at all between KO and control TAL tubules (Fig. S3). The tTJ integrity, assessed by tricellulin localization, remained intact in KO TAL tubules (Fig. S4). Together, these results indicate that the gross tight junction barrier function is not affected by the deletion of ILDR1 in tricellular junction.
Fig. S3.
Bicellular tight junction integrity in ILDR1 KO TAL tubule. (A) Double staining of ZO-1 with the TAL marker (NKCC2). The localization pattern of neither protein changed in the ILDR1 KO. (B) Staining of TAL-specific bTJ proteins (CLDN16 and CLDN19) showed no difference in their localization pattern, comparing KO with control animals. (Scale bars: 10 μm.)
Fig. S4.
Tricellular tight junction integrity in ILDR1 KO TAL tubule. Double labeling of tricellulin with the TAL marker (CLDN19) revealed no difference in tricellulin localization pattern, comparing KO with control animals. (Scale bars: 10 μm.)
Vasopressin Cannot Correct Paracellular Water Loss Despite Normal Transcellular Water Response.
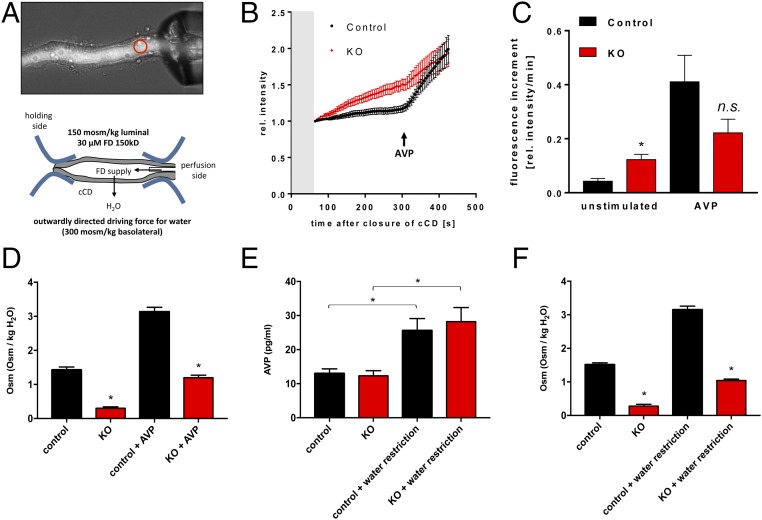
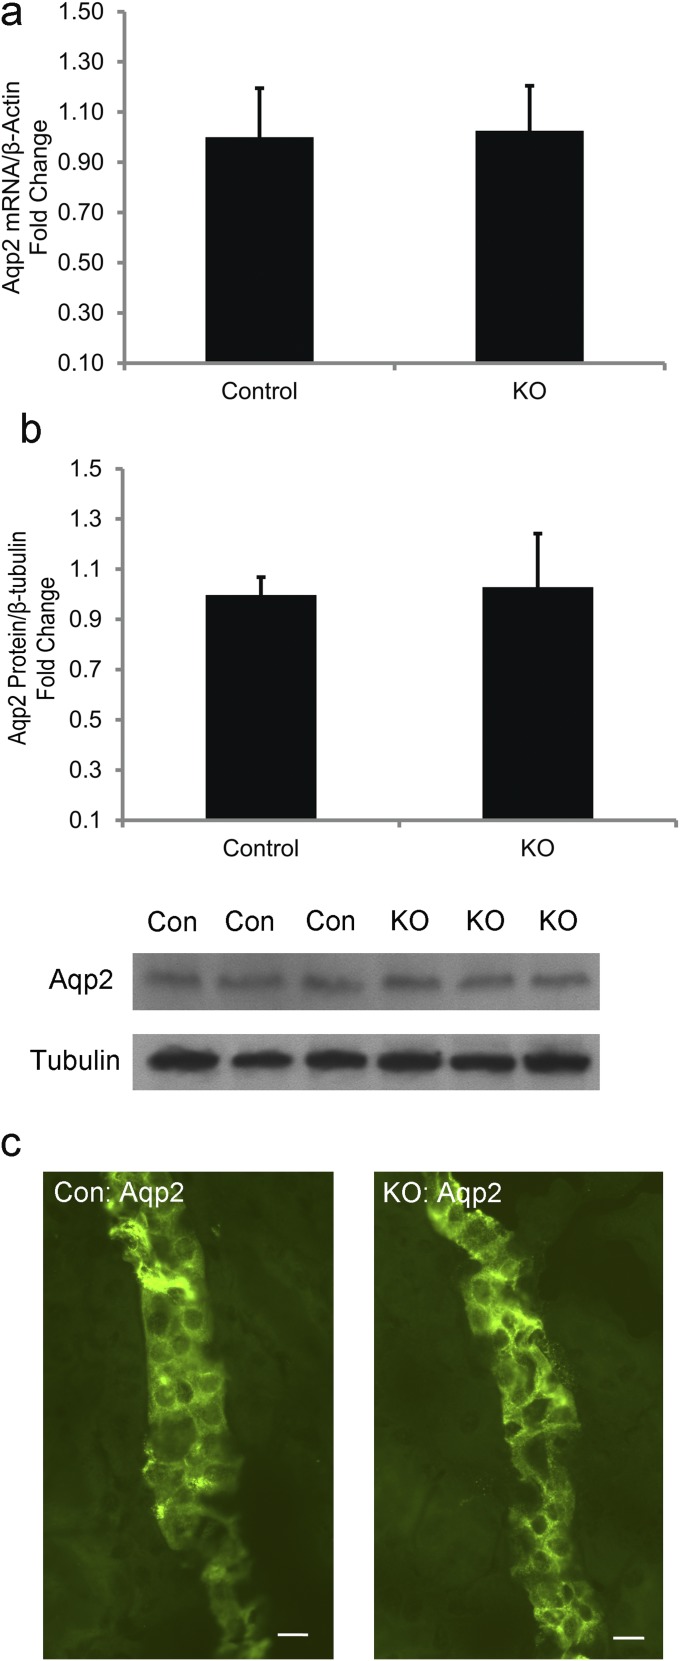
From Fig. 1, we learned that ILDR1 is also expressed in the collecting duct. In microperfused collecting duct tubules (Fig. 3A), luminal fluorescence intensity was significantly higher in KO than in control animals when they were given free access to water (Fig. 3B), indicating that the paracellular water pathway also existed in the collecting duct. The water permeation velocity, as determined by luminal fluorescence increment, was approximately threefold higher in KO than in control collecting duct tubules (Fig. 3C). To verify that the water loss in the collecting duct was due to the paracellular pathway but not through the transcellular pathway, we ascertained the gene expression (Fig. S5A), the protein abundance (Fig. S5B), and the membrane trafficking (Fig. S5C) of the major aquaporin in the collecting duct—aquaporin 2 (Aqp2) from KO and control mouse kidneys. Compared with the control level, none of these above parameters significantly differed in the KO kidneys. To determine whether vasopressin regulation of water permeation remained intact in the collecting duct, we treated the microperfused collecting duct tubules in vitro with a 50-nM dose of vasopressin. In both control and KO collecting duct tubules, vasopressin elicited a sharp increase in luminal fluorescence intensity (Fig. 3B). The maximal water permeation velocity after vasopressin stimulation was not significantly different between KO and control collecting duct tubules (Fig. 3C). To address whether vasopressin effect on urinary concentration in live KO animals may be compromised, we infused vasopressin to both groups of animals at the rate of 0.6 μg⋅day−1⋅kg BW−1 via s.c. pump for 24 h. As shown in Fig. 3D, although vasopressin treatment significantly increased the urinary osmolality in control and KO mice, the KO mouse urine remained significantly more hypotonic than the control mouse urine. Finally, we asked whether vasopressin secretion might be affected in the KO animal during water restriction. The baseline plasma vasopressin levels were similar between control and KO mice (Fig. 3E). Water deprivation for 12 h significantly increased the plasma vasopressin levels in control and KO animals by 2.0- and 2.3-fold, respectively (Fig. 3E). The urinary osmolality was increased in both groups of animals after water deprivation (Fig. 3F). Nevertheless, the KO mouse urinary osmolality was still significantly lower than that of the control mouse urine (Fig. 3F). Together, these results suggest that the renal water loss in ILDR1 KO mouse kidney is specifically due to the paracellular pathway defect.
Fig. 3.
Ex vivo microperfusion of collecting duct from ILDR1 KO kidney. (A) Light microscopy demonstration of the microperfusion system with live collecting duct tubules in perfusion with 150 kDa FITC-dextran in the lumen. The luminal fluorescence intensity was measured continuously at the focal point depicted by the red circle. (B) Real-time luminal FITC fluorescence intensity recording after a luminal fluid exchange (gray area) to lower osmolality. AVP was added at 300 s. (C) Fluorescence increment values as a direct measure of water permeation velocity in KO and control collecting duct tubules in the absence or presence of vasopressin. *P < 0.05, n = 6 animals, data are given as mean ± SEM of 10 and 8 CDs. (D) The 24-h urinary osmolality levels in KO and control animals in the absence or presence of vasopressin infusion. *P < 0.05, n = 5 animals. (E) Plasma vasopressin levels in KO and control animals with free access to water or under 12-h water deprivation. *P < 0.05, n = 5 animals. (F) The 24-h urinary osmolality levels in KO and control animals with free access to water or under 12-h water deprivation. *P < 0.05, n = 5 animals.
Fig. S5.
Aqp2 gene expression, protein abundance, and cellular localization in ILDR1 KO kidney. (A) Real-time RT-PCR analyses of Aqp2 mRNA levels in KO mouse kidneys revealed no difference from control levels. n = 3. (B) Immunoblot and densitometric analyses of Aqp2 protein levels in KO mouse kidneys revealed no difference from control levels. n = 3. (C) Immunostaining of Aqp2 protein in semithin kidney sections showed no difference in localization, comparing KO with control animals. Note that Aqp2 proteins were mostly intracellular in both genotypes, indicating that the AVP-induced Aqp2 trafficking process was not present. (Scale bars: 10 μm.)
The Colonic Water Loss in ILDR1 KO Mice.
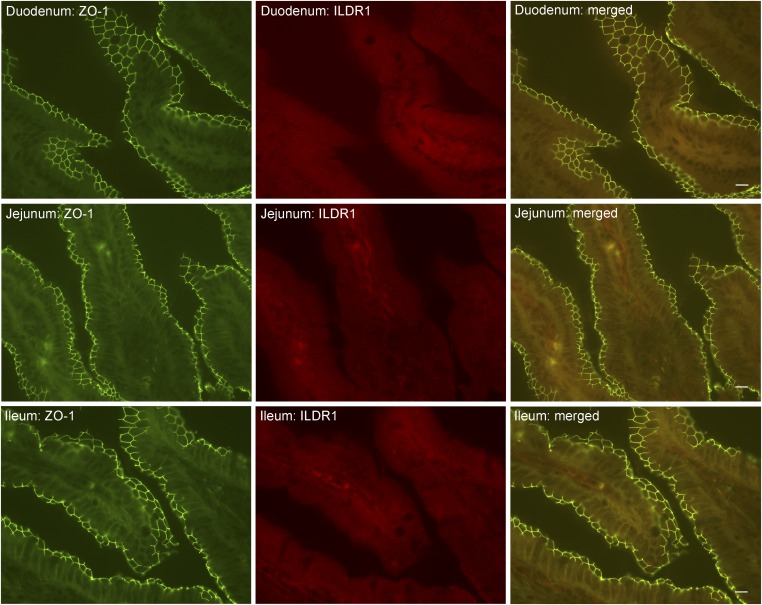
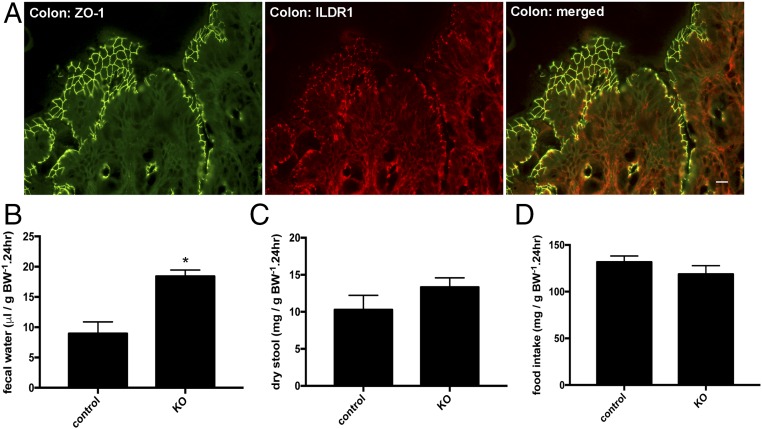
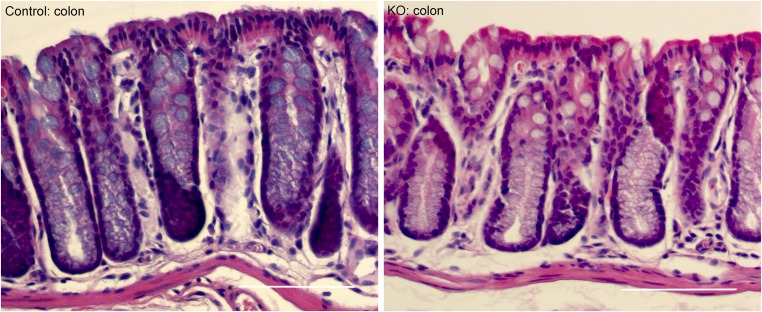
Because the fold of increase in water intake volume was higher than that in urinary output volume (Table 1), we asked whether there might exist any route of water loss in addition to the kidney. The intestine plays important roles in water absorption or secretion. We first addressed where the ILDR1 protein was localized in the intestine. The mouse small intestine (including the duodenum, the jejunum, and the ileum) was without any detectable expression of ILDR1 protein (Fig. S6). The colonic epithelium, by contrast, expressed the ILDR1 protein exclusively in the tricellular tight junction (Fig. 4A). Then, we analyzed the fecal content of age-matched (3-mo old) and sex-matched (male) ILDR1 KO and control mice in metabolic cages for 24 h. The fecal water volume excreted in the stool was 2.1-fold higher in KO than in control animals (Fig. 4B). Neither the dry stool weight (Fig. 4C) nor the food intake level (Fig. 4D) differed between KO and control animal groups. Knowing that colon inflammation may also cause excessive water loss, we performed histologic examination on age- and sex-matched ILDR1 KO and control mouse colons. Similar to the control mouse colon, the KO mouse colon was morphologically normal and showed no sign of leukocyte infiltration or epithelial necrosis (Fig. S7). Together, these results indicate that the paracellular water pathway may have a universal role in many epithelia including the colonic and the renal epithelia.
Fig. S6.
ILDR1 protein localization in the mouse small intestine. The duodenum, the jejunum, and the ileum were dissected, sectioned, and costained with anti-ZO1 and anti-ILDR1 antibodies. ZO-1 labeled the tight junctions of the enterocytes. There was no detectable ILDR1 expression in the enterocyte. (Scale bars: 10 μm.)
Fig. 4.
ILDR1 gene expression and physiology in the colon. (A) Double staining of ILDR1 protein with a tight junction marker (ZO-1) in the mouse colon. (Scale bar: 10 μm.) (B) Fecal water volume in KO and control animals. *P < 0.05, n = 6 animals. (C) Dry stool weight in KO and control animals. n = 6 animals. (D) Food intake levels in KO and control animals. n = 6 animals.
Fig. S7.
Colon histology in ILDR1 KO and control mice. Histologic examination of H&E-stained sections revealed that the KO mouse colon was morphologically normal, showing no sign of leukocyte infiltration or epithelial necrosis. (Scale bars: 100 μm.)
ILDR1 Inhibits Transepithelial Water and Solute Permeability.
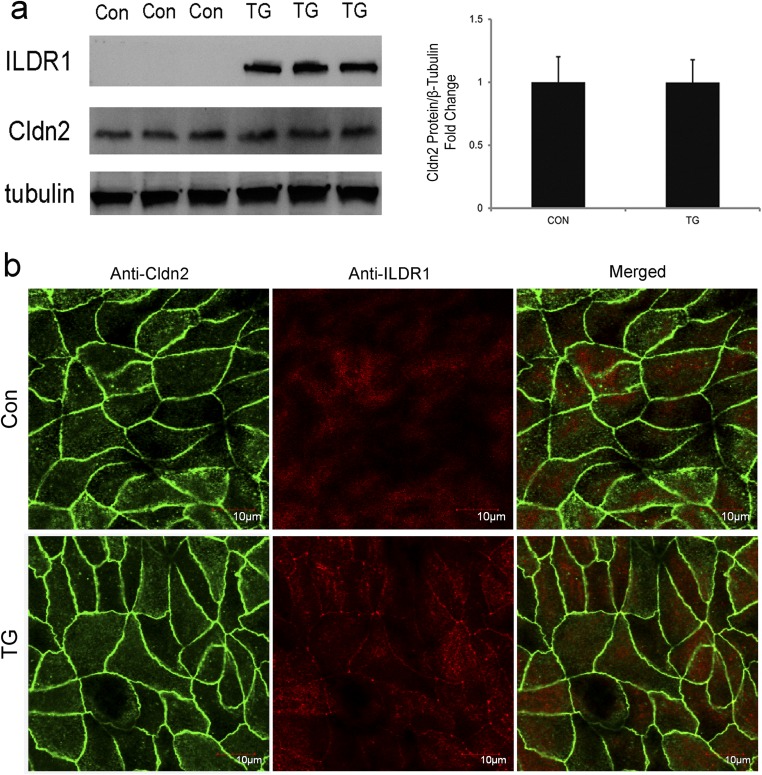
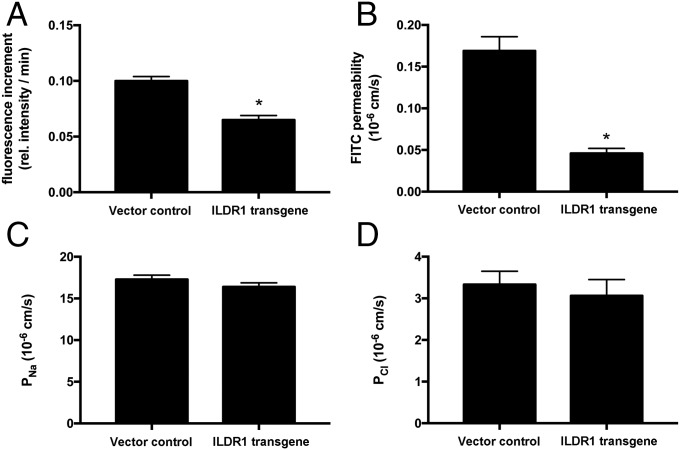
Rosenthal et al. previously have demonstrated that a putative paracellular water channel—claudin-2—mediates transepithelial water permeation in MDCK-II cells (3). We found that endogenous ILDR1 expression in MDCK-II cells was below the detection limit by immunoblotting or immunofluorescent labeling (Fig. S8). Transfection via retrovirus generated stable and homogenous overexpression of ILDR1 protein in the tricellular tight junctions of MDCK-II cells (Fig. S8). The claudin-2 protein expression or localization was not affected by the ectopic expression of ILDR1 (Fig. S8). Using a semiperfused diffusion chamber system (Materials and Methods), we measured the transepithelial water permeability in MDCK-II cells expressing ILDR1. A high molecular mass fluorescent dye (FITC-dextran, 150 kDa, 1 μM) was included in the apical solution. Then, the basolateral perfusate osmolality was increased by 100 mOsm/kg H2O to generate an apico-basal osmotic gradient. The increase in apical fluorescence intensity would be inversely proportional to the water loss. The apical fluorescence increment, measured as Δfluorescence intensity per minute, reflected the water permeation velocity. Compared with the baseline MDCK-II level, ILDR1 expression significantly decreased the water permeation velocity by 35% (Fig. 5A). The transepithelial permeability of fluorescein (332 Da) was reduced by 73% of the baseline MDCK-II level in ILDR1-expressing cells (Fig. 5B) whereas neither the paracellular Na+ permeability (PNa) (Fig. 5C) nor the paracellular Cl− permeability (PCl) (Fig. 5D) was significantly altered by ILDR1 expression. Together, these results demonstrate that ILDR1 regulates paracellular water and solute permeability with no effect on paracellular ionic permeability.
Fig. S8.
Transgenic overexpression of ILDR1 in MDCK-II cells. (A, Left) Western blots showing the protein levels of ILDR1 and Cldn2 versus β-tubulin levels. (Right) The densitometric comparison of Cldn2 protein levels in control and ILDR1 overexpressing cells. n = 3. (B) Immunofluorescent labeling showing the subcellular localization of ILDR1 and Cldn2 proteins. Note that the ILDR1 protein is localized to the tricellular tight junction. (Scale bars: 10 μm.)
Fig. 5.
In vitro recording of ILDR1 function in MDCK-II cells. (A) Transepithelial water permeability in MDCK-II cells expressing an empty vector control or ILDR1 transgene, as determined by the fluorescence increment. *P < 0.05, n = 5 clones. (B) Transepithelial FITC permeability in MDCK-II cells expressing control or ILDR1 transgene, as determined by the flux assay. *P < 0.05, n = 5 clones. (C and D) Paracellular Na+ permeability (PNa, C) and paracellular Cl− permeability (PCl, D) in MDCK-II cells expressing control or ILDR1 transgene, as determined by the transepithelial electrical resistance (TER) and dilution potential (DP) measurements. n = 5 clones.
Discussion
Permeability Property of the Tricellular Junction.
In freeze fracture replica electron micrographs, the bTJs are discontinuous at tricellular contacts (25, 26). The tTJ is composed of three pairs of TJ strands arranged vertically and known as the central sealing element (5). Unlike the bTJ, which contains ion channels of 4 to 7 Å in diameter (1), the tTJ is predicted to create a paracellular pathway with much a larger diameter—∼10 nm surrounded by the central sealing element (5). Such a large paracellular pathway would be deemed suitable for free water (∼3 Å in diameter) permeation as well as for permeation of other solutes such as fluorescein (∼9 Å in diameter). The water permeability of tTJ is likely to have important roles in many epithelia. Notably, the combined water excretion through the kidney and the colon accounted for only 20% of the increased water intake by the ILDR1 KO animal. Insensible water loss through the skin or the lung may also be increased in the absence of the ILDR1 protein. Judging from angulin-2/ILDR1’s barrier function, other angulins may regulate the tTJ permeability in a similar way to ILDR1. For example, angulin-1/LSR is important in regulating the blood–brain barrier permeability. Deletion of LSR in brain vasculature increased the tTJ permeability to biotin but not to albumin (27). The organization of the tricellular junction has been an interesting but understudied topic. By studying ZO-1–deficient MDCK cells, Choi et al. have proposed a model that the bicellular junctions are anchored “end-on” to the tricellular junctions (28). Compatible with this theory, knockdown of tricellulin in Eph4 cells rendered bicellular junctions discontinuous (7). Molecular interaction assays revealed that tricellulin could cis-interact with claudins to facilitate the anchoring of bTJ onto tTJ (29). It is not known whether ILDR1 may interact with claudins: e.g., claudin-2 to regulate their permeabilities. In mouse kidneys and in MDCK-II cells, manipulation of ILDR1 expression seemed to exert no effect on bTJ structure and function, which would suggest that ILDR1 is a tTJ-specific modulator. The barrier function of ILDR1 may derive from the trans-interaction between its extracellular immunoglobin-like domain, in a scenario similar to a class of bTJ protein—JAMs (30).
Paracellular Water Permeability and Urine Concentration Mechanism.
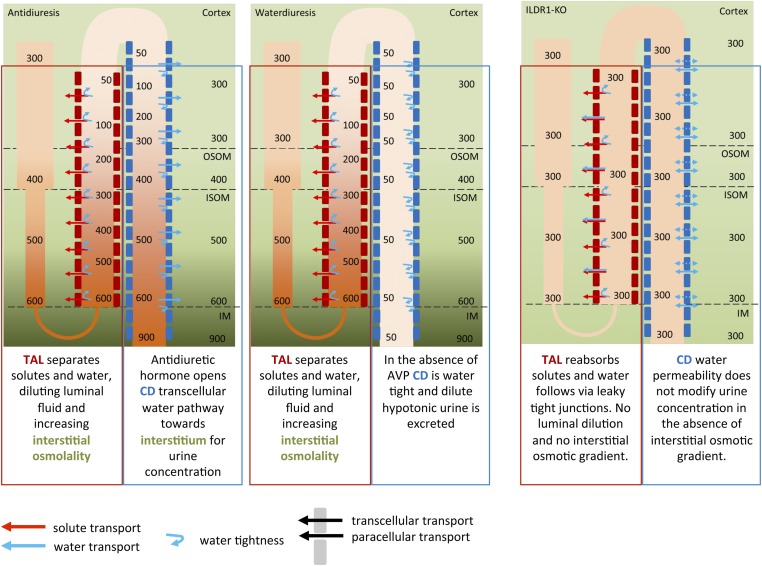
Polyuria with the production of an excessive amount of isotonic urine, known as isosthenuria, can be seen as a type of DI phenotype derived from an impaired water dilution mechanism in the loop of Henle. The two extreme states of water homeostasis that the kidney can handle are depicted in Fig. S9. Under both circumstances, the TAL has to dilute the luminal fluid and to fuel the countercurrent multiplication mechanism. To produce concentrated urine (Fig. S9, Left), the collecting duct has, in a second step, to allow water permeation and therefore equilibration of the luminal osmolality to the basolateral osmolality (water will be transported away continuously by the vasa recta, also part of the countercurrent mechanism). This process is under the tight control of vasopressin and is defective in DI. Urine produced by DI patients therefore resembles the dilute urine produced from the end of the TAL. If the water permeability of the TAL is increased, as is the case in ILDR1 KO mice, then the TAL is not diluting the luminal fluid properly to values below plasma tonicity, no hypotonic urine can be produced, and the interstitial osmotic gradient dissolves. The end result is no urinary concentration beyond isosthenuria. In mice, vasopressin challenge may still increase the urea transport in the collecting duct, which will partially increase the interstitial osmolality in the inner medulla and concentrate the urine to a certain degree. In the TAL, we also investigated paracellular ionic permeability properties, in addition to paracellular water permeability, and could not detect any difference although ions could likely permeate through the leakier tTJ. The bTJ already confers a huge ionic permeability, considering the typical meandering pattern of the bTJ in the segment. Some additional tTJ ionic permeability would be invisible under these conditions, a finding shown in a similar way in MDCK-II cell culture. In contrast, paracellular water permeability was clearly visible in the otherwise water-impermeable TAL. The increased water permeability across the TAL tight junction would suggest that the luminal fluid in the TAL remains isotonic to the serum. Generation of the lumen-positive diffusion potential (Vte in the TAL), however, depends upon the NaCl concentration difference between the lumen and the peritubular space (equal to the serum) (31). Vte, serving as a major driving force for the reabsorption of divalent cations (32), is therefore expected to diminish in the ILDR1 KO mouse TAL, causing increases in renal calcium excretion. The elevated luminal tonicity in the KO mouse TAL would also be expected to activate the tubuloglomerular feedback (TGF) mechanisms leading to a reduction in the GFR. Although our initial estimation of GFR based upon the creatinine clearance rate did not reveal a significant reduction, more accurate recording approaches, such as the single nephron glomerular filtration rate (SNGFR) measurement, will be needed to interrogate the real-time TGF response in each individual nephron.
Fig. S9.
Water concentration mechanism. This diagram illustrates the countercurrent multiplication mechanism in the loop of Henle that establishes the axial osmolality gradient important for urine concentration in the collecting duct.
In conclusion, we provide insights into tricellular junction permeability by showing that ILDR1 can function as a water barrier in the tricellular tight junction. Manipulating tricellular junction permeability may represent a mechanism to regulate epithelial water homeostasis.
Materials and Methods
All mice were bred and maintained according to the Washington University animal research requirements, and all procedures were approved by the Institutional Animal Care and Use Committee. SI Materials and Methods includes additional topics on animal metabolic studies, analyses of inner medullar osmolality, molecular cloning and retrovirus production, renal tubule perfusion, and transepithelial water permeability measurements.
SI Materials and Methods
Reagents, Antibodies, Cell Lines, and Animals.
The following antibodies were used: anti-ILDR1 (18), anti–claudin-16 (15), anti–claudin-19 (15), anti–ZO-1 (33), and anti-Aqp2 (Santa Cruz Biotechnology); L. tetragonolobus lectin (Vector Laboratories); anti-NCC (Santa Cruz Biotechnology); and anti-tricellulin (Invitrogen). MDCK-II (ATCC) were cultured in DMEM supplemented with 10% FBS, penicillin /streptomycin, and 1 mM sodium pyruvate. All mice were bred and maintained according to the Washington University animal research requirements, and all procedures were approved by the Institutional Animal Care and Use Committee. The ILDR1 knockout mice have been described before (18) and were backcrossed to the C57BL/6 background. All animals had free access to water and were housed in a 12-h light cycle. Blood samples were taken by cardiac puncture rapidly after initiation of terminal anesthesia and were centrifuged at 4 °C for 10 min. Kidney were dissected out and immediately frozen at −80 °C.
Animal Metabolic Studies.
Mice were housed individually in metabolic cages (Techniplast) with free access to water and food for 24 h. Urine was collected under mineral oil. The plasma and urine electrolyte levels were determined with a Roche Cobas clinical analyzer (Roche Diagnostics). The creatinine levels were measured with an enzymatic method that was independent of plasma chromogens (34). The fractional excretion of electrolytes was calculated using the following equation: fractional excretion rate of ion = UV × urinary concentration of ion/(CCR × plasma concentration of ion) [FEion = UV × Uion/(CCr × Pion)], where CCr was calculated according to the clearance rate of creatinine (CCr = UV × Ucreatinine/Pcreatinine). The plasma vasopressin levels were measured with the Arg8-Vasopressin ELISA kit (Enzo Life Sciences).
Analyses of Inner Medullar Osmolality.
The kidney inner medullar osmolality was analyzed from freshly prepared tissues as described before (35). Kidneys from each mouse were rapidly removed, and the entire inner medulla was excised. Each inner medulla was squeezed and blotted on a filter paper to remove urine. It was then cut into four pieces and weighed. The entire procedure for dissection and weighing took less than 2 min per kidney. The tissues were dried overnight at 60 °C and weighed to estimate water content. To each tube, 50 mL of water was added, which was then capped and heated for 3 min at 90 °C, followed by storage at 4 °C for 24 h. The tubes were centrifuged, and the supernatants were collected for osmolality measurement. The estimated tissue osmolality was calculated from the total osmoles of the supernatant and the volume of tissue water.
Molecular Cloning and Retrovirus Production.
The full-length mouse ILDR1 gene (NM_001285788) was cloned into the retroviral vector pQCXIN (Clontech) downstream of the cytomegalovirus (CMV) promoter for overexpression and recombinant protein production. Molecular clones for the full-length construct were verified by DNA sequencing. Vesicular stomatitis virus glycoprotein (VSV-G) pseudotyped retroviruses were produced in HEK293 cells and used to infect MDCK-II cells at a titer of 1 × 10⁶ cfu/mL, as described previously (36).
Real-Time PCR Quantification.
Total RNA including microRNA was extracted using TRIzol (Invitrogen). Cellular mRNA was reverse transcribed using the SuperScript-III kit (Invitrogen), followed by real-time PCR amplification using SYBR Green PCR Master Mix (Bio-Rad) and the Eppendorf Realplex2S system. Results were expressed as
Protein Electrophoresis and Immunoblotting.
Confluent cells were dissolved in lysis buffer (50 mM Tris⋅HCl, pH 7.5, 150 mM NaCl, 1% SDS, and protease inhibitor mixture; Roche). After shearing with a 23-gauge needle, lysates (containing 20 μg of total protein) were subjected to SDS/PAGE under denaturing conditions and transferred to a nitrocellulose membrane, followed by blocking with 3% nonfat milk, incubation with primary antibodies (diluted 1:1,000) and horseradish peroxidase-labeled secondary antibody (diluted 1:5,000), and exposure to an ECL Hyperfilm (Amersham). Molecular mass was determined relative to protein markers (Bio-Rad).
Immunolabeling and Fluorescence Microscopy.
Cells grown on coverslips were fixed with 1% paraformaldehyde in 1× PBS; cells grown on Transwell inserts (Corning) were fixed with cold methanol at –20 °C, followed by blocking with PBS containing 10% FBS and incubation with primary antibodies (diluted 1:300) and FITC- or rhodamine-labeled secondary antibodies (diluted 1:200). After washing with PBS, slides were mounted with Mowiol (CalBiochem). Epifluorescence images were collected with a Nikon 80i photomicroscope equipped with a DS-Qi1Mc digital camera. Confocal analyses were performed using the Nikon TE2000 confocal microscopy system equipped with Plan-Neofluar ×40 (N.A. 1.3 oil) and ×63 (N.A. 1.4 oil) objectives and krypton-argon laser (488 and 543 lines). For the dual imaging of FITC and rhodamine, fluorescent images were collected by exciting the fluorophores at 488 nm (FITC) and 543 nm (rhodamine) with argon and HeNe lasers, respectively. Emissions from FITC and rhodamine were detected with the bandpass FITC filter set of 500 to 550 nm and the long-pass rhodamine filter set of 560 nm, respectively. All images were converted to TIFF format and arranged using Photoshop CS4 (Adobe).
Renal Tubule Perfusion and Water Permeability Measurement.
Cortical thick ascending limbs (cTALs) of six male control and six male ILDR1-KO mice were dissected manually at 4 °C in dissection solution (Table S1). All cTALs were perfused by a double-barreled perfusion system at 37 °C on the heated stage of an inverted microscope (Axiovert 35M; Carl Zeiss). Transepithelial voltage Vte, transepithelial resistance Rte, and the equivalent short-circuit current I’sc were determined under symmetric conditions (solution 300, Table S1, at luminal and basolateral side), and paracellular electrophysiological properties were investigated as described before (37). In brief, after inhibition of secondary active transcellular NaCl transport by luminal application of 50 µmol/L furosemide, an NaCl diffusion potential under isosmotic conditions was established by exchange of the basolateral solution by solution 30 NaCl (Table S1). Permeability ratios (PNa/PCl) were calculated from the measured diffusion voltages, taking into account the respective ion activities at the given ionic strength of the solutions, and after correction for liquid junction voltages (37). In a second set of cTALs, after assessment of Vte, Rte, and I’sc, the luminal perfusate was supplemented with 30 µmol/L 150 kDa FITC dextran (Sigma) to visualize luminal perfusate concentration by fluorescence. Then, the open end of the cTAL was plugged at a constant pressure at the perfusion site. The basolateral osmolality was changed stepwise to solutions 350, 400, and 450 for 2 min, respectively, before returning to solution 300 (all solutions, Table S1). The luminal fluorescence emission intensity from the lumen at 490 nm excitation wavelength was monitored using a digital imaging system (Visitron Systems GmbH) and analyzed by MetaFluor software. Basolateral increase in osmolality induced an increase in luminal fluorescence intensity, with a slope dependent on the water permeability of the tubular epithelium. Only experiments from cTALs without any leak and with a luminal diameter in the physiological range were accepted for analysis.
In a similar manner, cortical collecting ducts (CCD) of six male control and six male ILDR1-KO mice were dissected and perfused for luminal fluorescence measurements. CCD did not tolerate basolateral changes in osmolality and were therefore perfused with solution 150 (Table S1) at the luminal side, supplemented with 30 µmol/L 150 kDa FITC dextran. The open end of the CCD was closed by the holding pipette at a constant pressure at the perfusion site, which represented time point 0 s of the experiment. After a 20- to 50-s period used for focusing and adjustment of the system, monitoring of the fluorescence emission intensity from the lumen started. At time point 300 s, 50 nM antidiuretic hormone (AVP) was applied at the basolateral side, and luminal fluorescence was monitored for another 240 s. Fluorescence intensity over time was analyzed by MetaFluor software and normalized to the intensity at time point 60 s. Slopes as measure for the water permeability were calculated before (unstimulated) and after application of AVP.
Electrophysiological Measurements and FITC Flux Assays.
Electrophysiological recordings were performed on epithelial monolayers in an Ussing chamber (U9926/T; Harvard Apparatus) that had been modified to adapt Transwells (23, 38). Voltage and current clamps were performed using the EC-800 epithelial amplifier (Warner Instruments) with Ag/AgCl electrodes and an Agarose bridge containing 3 M KCl. The TER was measured under the “Resistance” mode by passing a constant bipolar current pulse (Io) of 10 μA (<2 kΩ) or 1 μA (>2 kΩ) through the epithelium and recording voltage deflection (Vo). Ohm’s law was used to calculate TER from Vo and Io. The series resistance (Rs) was measured in the absence of the epithelium and was subtracted from TER. Dilution potentials (DPs) were measured under the “Current Clamp” mode by clamping the transepithelial current to zero and recording the equilibrium voltage generated by NaCl diffusion. All experiments were conducted at 37 °C. Electrical potentials obtained from blank inserts were subtracted from those obtained from inserts with epithelial monolayers. The ion permeability ratio (η) for the monolayer was calculated from the dilution potential using the Goldman–Hodgkin–Katz equation:
where η is the ratio of permeability of the monolayer to Na+ over the permeability to Cl– (η = PNa/PCl); ε is the dilution factor (ε = Cbasal/Capical); ν = eV/kT (V is the dilution potential, k is the Boltzmann constant, e is the elementary charge, and T is the Kelvin temperature). The absolute permeabilities of Na+ (PNa) and Cl– (PCl) were calculated by using the Kimizuka–Koketsu equation:
where C is the concentration, R is the gas constant, and F is the Faraday constant.
The permeability of the paracellular marker (fluorescein) was calculated from the flux measurements, which were performed in the Ussing chambers under voltage-clamp conditions. Fluorescein (fluorescein-sodium salt; Sigma) in a final concentration of 100 μM was added to the apical (donor) side, and samples were collected from the basolateral (receiving) side at t = 10 min. Fluorescence signals were calibrated using defined dilutions in standard bath solution. Flux was calculated as the increase in tracer quantity (corrected for dilution) per time unit and filter area. Permeability was calculated as flux/concentration on the donor side.
Measurement of Transepithelial Water Permeability.
The semiperfused horizontal diffusion chamber system (Navicyte chamber; Harvard Apparatus) was assembled according to the manufacturer’s instructions. The apical solution (145 mM NaCl, 2 mM CaCl2, 1 mM MgCl2, 10 mM glucose, and 10 mM Hepes, pH 7.4) was supplemented with 1 µM 150 kDa FITC dextran (Sigma). The basolateral solution was perfused by gravity at the flow rate of 2 mL/min. A 0.2-psi compressed air pressure was applied to the apical side by a Picoliter Microinjector (PLI-100A; Harvard Apparatus) to counterbalance the hydrostatic pressure due to basolateral perfusion. After equilibration, the basolateral perfusate was changed to a hypertonic solution (145 mM NaCl, 2 mM CaCl2, 1 mM MgCl2, 10 mM glucose, 100 mM mannitol, and 10 mM Hepes, pH 7.4). The diffusion chamber was thermostatically controlled at 37 °C. The apical fluorescence level was determined at t = 0 and 10 min. Basolateral increase in osmolality induced an increase in apical fluorescence intensity, which can be linearly correlated to transepithelial water permeability.
Statistical Analyses.
The significance of differences between groups was tested by ANOVA (Statistica 6.0; Statsoft). When the all-effects F value was significant (P < 0.05), post hoc analysis of differences between individual groups was made with the Newman–Keuls test. Values were expressed as mean ± SEM, unless otherwise stated.
Acknowledgments
We thank Dr. Rodger Liddle and Dr. Rashmi Chandra (Duke University) for kindly providing the ILDR1 knockout mouse model and the ILDR1 antibody; Dr. Lushan Zhou and Dr. Lane Baker (Indiana University) for assistance with electrophysiological recording; and Dr. George Jarad for assistance with mouse intestinal dissection. This work was supported by National Institute of Diabetes and Digestive and Kidney Diseases Grant R01DK084059 and American Heart Association Grant 17SDG33410806.
Footnotes
The authors declare no conflict of interest.
This article is a PNAS Direct Submission.
This article contains supporting information online at www.pnas.org/lookup/suppl/doi:10.1073/pnas.1701006114/-/DCSupplemental.
References
- 1.Hou J, Rajagopal M, Yu AS. Claudins and the kidney. Annu Rev Physiol. 2013;75:479–501. doi: 10.1146/annurev-physiol-030212-183705. [DOI] [PMC free article] [PubMed] [Google Scholar]
- 2.Fischbarg J. Fluid transport across leaky epithelia: Central role of the tight junction and supporting role of aquaporins. Physiol Rev. 2010;90:1271–1290. doi: 10.1152/physrev.00025.2009. [DOI] [PubMed] [Google Scholar]
- 3.Rosenthal R, et al. Claudin-2, a component of the tight junction, forms a paracellular water channel. J Cell Sci. 2010;123:1913–1921. doi: 10.1242/jcs.060665. [DOI] [PubMed] [Google Scholar]
- 4.Kovbasnjuk O, Leader JP, Weinstein AM, Spring KR. Water does not flow across the tight junctions of MDCK cell epithelium. Proc Natl Acad Sci USA. 1998;95:6526–6530. doi: 10.1073/pnas.95.11.6526. [DOI] [PMC free article] [PubMed] [Google Scholar]
- 5.Staehelin LA. Further observations on the fine structure of freeze-cleaved tight junctions. J Cell Sci. 1973;13:763–786. doi: 10.1242/jcs.13.3.763. [DOI] [PubMed] [Google Scholar]
- 6.Tsukita S, Furuse M, Itoh M. Multifunctional strands in tight junctions. Nat Rev Mol Cell Biol. 2001;2:285–293. doi: 10.1038/35067088. [DOI] [PubMed] [Google Scholar]
- 7.Ikenouchi J, et al. Tricellulin constitutes a novel barrier at tricellular contacts of epithelial cells. J Cell Biol. 2005;171:939–945. doi: 10.1083/jcb.200510043. [DOI] [PMC free article] [PubMed] [Google Scholar]
- 8.Higashi T, et al. Analysis of the ‘angulin’ proteins LSR, ILDR1 and ILDR2: Tricellulin recruitment, epithelial barrier function and implication in deafness pathogenesis. J Cell Sci. 2013;126:966–977. doi: 10.1242/jcs.116442. [DOI] [PubMed] [Google Scholar]
- 9.Nayak G, et al. Tricellulin deficiency affects tight junction architecture and cochlear hair cells. J Clin Invest. 2013;123:4036–4049. doi: 10.1172/JCI69031. [DOI] [PMC free article] [PubMed] [Google Scholar]
- 10.Morozko EL, et al. ILDR1 null mice, a model of human deafness DFNB42, show structural aberrations of tricellular tight junctions and degeneration of auditory hair cells. Hum Mol Genet. 2015;24:609–624. doi: 10.1093/hmg/ddu474. [DOI] [PMC free article] [PubMed] [Google Scholar]
- 11.van den Ouweland AM, et al. Mutations in the vasopressin type 2 receptor gene (AVPR2) associated with nephrogenic diabetes insipidus. Nat Genet. 1992;2:99–102. doi: 10.1038/ng1092-99. [DOI] [PubMed] [Google Scholar]
- 12.Deen PM, et al. Requirement of human renal water channel aquaporin-2 for vasopressin-dependent concentration of urine. Science. 1994;264:92–95. doi: 10.1126/science.8140421. [DOI] [PubMed] [Google Scholar]
- 13.Deen PM, Croes H, van Aubel RA, Ginsel LA, van Os CH. Water channels encoded by mutant aquaporin-2 genes in nephrogenic diabetes insipidus are impaired in their cellular routing. J Clin Invest. 1995;95:2291–2296. doi: 10.1172/JCI117920. [DOI] [PMC free article] [PubMed] [Google Scholar]
- 14.Gong Y, et al. Claudin-14 regulates renal Ca++ transport in response to CaSR signalling via a novel microRNA pathway. EMBO J. 2012;31:1999–2012. doi: 10.1038/emboj.2012.49. [DOI] [PMC free article] [PubMed] [Google Scholar]
- 15.Hou J, et al. Claudin-16 and claudin-19 interaction is required for their assembly into tight junctions and for renal reabsorption of magnesium. Proc Natl Acad Sci USA. 2009;106:15350–15355. doi: 10.1073/pnas.0907724106. [DOI] [PMC free article] [PubMed] [Google Scholar]
- 16.Hoorn EJ, et al. The calcineurin inhibitor tacrolimus activates the renal sodium chloride cotransporter to cause hypertension. Nat Med. 2011;17:1304–1309. doi: 10.1038/nm.2497. [DOI] [PMC free article] [PubMed] [Google Scholar]
- 17.Nielsen S, DiGiovanni SR, Christensen EI, Knepper MA, Harris HW. Cellular and subcellular immunolocalization of vasopressin-regulated water channel in rat kidney. Proc Natl Acad Sci USA. 1993;90:11663–11667. doi: 10.1073/pnas.90.24.11663. [DOI] [PMC free article] [PubMed] [Google Scholar]
- 18.Chandra R, et al. Immunoglobulin-like domain containing receptor 1 mediates fat-stimulated cholecystokinin secretion. J Clin Invest. 2013;123:3343–3352. doi: 10.1172/JCI68587. [DOI] [PMC free article] [PubMed] [Google Scholar]
- 19.Marples D, Frøkiaer J, Dørup J, Knepper MA, Nielsen S. Hypokalemia-induced downregulation of aquaporin-2 water channel expression in rat kidney medulla and cortex. J Clin Invest. 1996;97:1960–1968. doi: 10.1172/JCI118628. [DOI] [PMC free article] [PubMed] [Google Scholar]
- 20.Gill JR, Jr, Bartter FC. On the impairment of renal concentrating ability in prolonged hypercalcemia and hypercalciuria in man. J Clin Invest. 1961;40:716–722. doi: 10.1172/JCI104305. [DOI] [PMC free article] [PubMed] [Google Scholar]
- 21.Sands JM, et al. Apical extracellular calcium/polyvalent cation-sensing receptor regulates vasopressin-elicited water permeability in rat kidney inner medullary collecting duct. J Clin Invest. 1997;99:1399–1405. doi: 10.1172/JCI119299. [DOI] [PMC free article] [PubMed] [Google Scholar]
- 22.Smith HW. The fate of sodium and water in the renal tubules. Bull N Y Acad Med. 1959;35:293–316. [PMC free article] [PubMed] [Google Scholar]
- 23.Hou J, et al. Claudin-16 and claudin-19 interact and form a cation-selective tight junction complex. J Clin Invest. 2008;118:619–628. doi: 10.1172/JCI33970. [DOI] [PMC free article] [PubMed] [Google Scholar]
- 24.Hou J, et al. Transgenic RNAi depletion of claudin-16 and the renal handling of magnesium. J Biol Chem. 2007;282:17114–17122. doi: 10.1074/jbc.M700632200. [DOI] [PubMed] [Google Scholar]
- 25.Wade JB, Karnovsky MJ. The structure of the zonula occludens: A single fibril model based on freeze-fracture. J Cell Biol. 1974;60:168–180. doi: 10.1083/jcb.60.1.168. [DOI] [PMC free article] [PubMed] [Google Scholar]
- 26.Friend DS, Gilula NB. Variations in tight and gap junctions in mammalian tissues. J Cell Biol. 1972;53:758–776. doi: 10.1083/jcb.53.3.758. [DOI] [PMC free article] [PubMed] [Google Scholar]
- 27.Sohet F, et al. LSR/angulin-1 is a tricellular tight junction protein involved in blood-brain barrier formation. J Cell Biol. 2015;208:703–711. doi: 10.1083/jcb.201410131. [DOI] [PMC free article] [PubMed] [Google Scholar]
- 28.Choi W, et al. Remodeling the zonula adherens in response to tension and the role of afadin in this response. J Cell Biol. 2016;213:243–260. doi: 10.1083/jcb.201506115. [DOI] [PMC free article] [PubMed] [Google Scholar]
- 29.Cording J, et al. In tight junctions, claudins regulate the interactions between occludin, tricellulin and marvelD3, which, inversely, modulate claudin oligomerization. J Cell Sci. 2013;126:554–564. doi: 10.1242/jcs.114306. [DOI] [PubMed] [Google Scholar]
- 30.Martìn-Padura I, et al. Junctional adhesion molecule, a novel member of the immunoglobulin superfamily that distributes at intercellular junctions and modulates monocyte transmigration. J Cell Biol. 1998;142:117–127. doi: 10.1083/jcb.142.1.117. [DOI] [PMC free article] [PubMed] [Google Scholar]
- 31.Greger R. Cation selectivity of the isolated perfused cortical thick ascending limb of Henle’s loop of rabbit kidney. Pflugers Arch. 1981;390:30–37. doi: 10.1007/BF00582707. [DOI] [PubMed] [Google Scholar]
- 32.Greger R. Ion transport mechanisms in thick ascending limb of Henle’s loop of mammalian nephron. Physiol Rev. 1985;65:760–797. doi: 10.1152/physrev.1985.65.3.760. [DOI] [PubMed] [Google Scholar]
- 33.Stevenson BR, Siliciano JD, Mooseker MS, Goodenough DA. Identification of ZO-1: A high molecular weight polypeptide associated with the tight junction (zonula occludens) in a variety of epithelia. J Cell Biol. 1986;103:755–766. doi: 10.1083/jcb.103.3.755. [DOI] [PMC free article] [PubMed] [Google Scholar]
- 34.Gong Y, et al. The Cap1-claudin-4 regulatory pathway is important for renal chloride reabsorption and blood pressure regulation. Proc Natl Acad Sci USA. 2014;111:E3766–E3774. doi: 10.1073/pnas.1406741111. [DOI] [PMC free article] [PubMed] [Google Scholar]
- 35.Schmidt-Nielsen B, Graves B, Roth J. Water removal and solute additions determining increases in renal medullary osmolality. Am J Physiol. 1983;244:F472–F482. doi: 10.1152/ajprenal.1983.244.5.F472. [DOI] [PubMed] [Google Scholar]
- 36.Hou J, Paul DL, Goodenough DA. Paracellin-1 and the modulation of ion selectivity of tight junctions. J Cell Sci. 2005;118:5109–5118. doi: 10.1242/jcs.02631. [DOI] [PubMed] [Google Scholar]
- 37.Plain A, et al. Corticomedullary difference in the effects of dietary Ca2+ on tight junction properties in thick ascending limbs of Henle’s loop. Pflugers Arch. 2016;468:293–303. doi: 10.1007/s00424-015-1748-7. [DOI] [PubMed] [Google Scholar]
- 38.Hou J, Renigunta A, Yang J, Waldegger S. Claudin-4 forms paracellular chloride channel in the kidney and requires claudin-8 for tight junction localization. Proc Natl Acad Sci USA. 2010;107:18010–18015. doi: 10.1073/pnas.1009399107. [DOI] [PMC free article] [PubMed] [Google Scholar]


