

Abstract
Mass spectrometry-based proteomics has experienced an unprecedented advance in comprehensive analysis of proteins and posttranslational modifications, with particular technical progress in liquid chromatography coupled to tandem mass spectrometry (LC-MS/MS) and isobaric labeling multiplexing capacity. Here we introduce a deep proteomics profiling protocol that combines 10-plex tandem mass tag (TMT) labeling with an optimized LC-MS/MS platform to quantitate whole proteome and phosphoproteome. The major steps include protein extraction and digestion, TMT labeling, two dimensional liquid chromatography, TiO2-mediated phosphopeptide enrichment, high resolution mass spectrometry, and computational data processing. This protocol routinely leads to confident quantification of more than 10,000 proteins and approximately 30,000 phosphosites in mammalian samples. Quality control steps are implemented for troubleshooting and evaluating experimental variation. Such a multiplexed robust method provides a powerful tool for dissecting proteomic signatures at the systems level in a variety of complex samples, ranging from cell culture, animal tissues to human clinical specimens.
Keywords: proteomics, mass spectrometry, phosphoproteome, isobaric labeling, tandem mass tags, liquid chromatography, bioinformatics
Introduction
The development of next generation sequencing technologies ushers in a new era in studying biological systems and human disease, in which high throughput measurements of the genome, transcriptome, proteome, metabolome, and other molecular landscapes becomes possible. In the proteomics field, technical progress over the past years has led to a major advance in mass spectrometry-based quantitative analysis, particularly in the isobaric labeling multiplexing capability combined with extensive liquid chromatography and mass spectrometry, which emerges as a mainstream approach for profiling proteins and posttranslational modifications in highly complex protein samples (Altelaar et al., 2013; Azimifar et al., 2014; Bensimon et al., 2012; Geyer et al., 2016; Hein et al., 2015; Kim et al., 2014; Wilhelm et al., 2014).
Multiplexed isobaric labeling methods (e.g., iTRAQ and TMT) have significantly improved the throughput of proteomics (Everley et al., 2013; McAlister et al., 2012; Pagala et al., 2015), although traditional quantification methods (e.g. label free quantification and SILAC) have provided successful examples (Bai et al., 2014; Bai et al., 2013; Kim et al., 2014; Thongboonkerd et al., 2014). For example, 10 protein samples can be analyzed together in one batch by the TMT 10-plex reagents. These structurally identical TMT tags bear the same overall mass, but heavy isotopes are differentially distributed on carbon or nitrogen atoms (Fig. 1). Therefore, each tag generates a unique reporter ion during MS/MS fragmentation, enabling relative quantification of the 10 samples by distinct reporter ions. The TMT strategy is commonly applied in dissecting biological pathways and cellular processes (Churchman et al., 2015; Mertz et al., 2015; Wang et al., 2016).
Fig. 1.
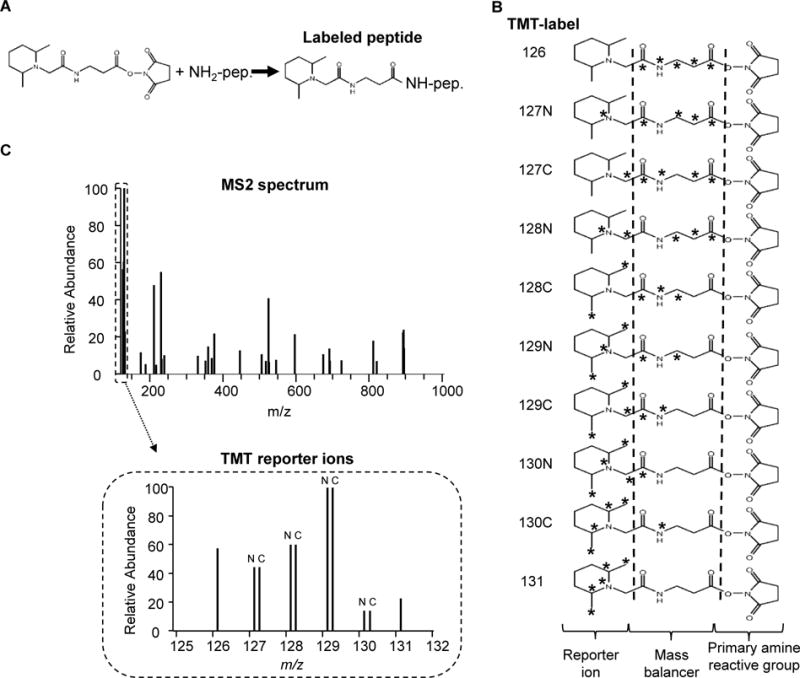
TMT10-plex reagents. (A) TMT reagents label amine-reactive group (e.g. Lys residues and the amino termini of peptides). (B) The 10 reagents in the TMT10-plex kit (asterisks indicate the positions of 13C and 15N heavy isotopes). (C) TMT reporter ions in an MS/MS spectrum. The intensities of these reporters are used for protein quantitation.
In addition, significant technical improvement has been made to enhance LC-MS/MS systems. The first-dimensional separation of peptides using LC with high orthogonal resolution is critical in this type of shotgun proteomics (Xu et al., 2009). High-pH reversed-phase liquid chromatography (RPLC) provides better performance than the conventional strong cation-exchange chromatography. Combined with the second dimension of low-pH RPLC, the system improves both analytical dynamic range and protein coverage, yielding impressive results in whole proteome and phosphoproteome analyses (Batth et al., 2014; Song et al., 2010; Wang et al., 2015; Yang et al., 2012). For analyzing protein posttranslational modifications, affinity enrichment is critical as modified proteins are normally present in low stoichiometry. Phosphopeptide enrichment by titanium dioxide (TiO2) has been demonstrated to be a selective, efficient, and reproducible method, and is widely used (Beltran and Cutillas, 2012; Tan et al., 2015; Thingholm and Larsen, 2016). Other technical advances include small C18 particles (1.9 μm) and extended long column (~1 meter) (Wang et al., 2015). Other notable improvements are new versions of mass spectrometers with rapid scan rates, high sensitivity and high resolution (Hebert et al., 2014), and revised bioinformatics pipelines for MS data mining (Wang et al., 2014).
Here, we describe a detailed protocol that incorporates the newly updated methodologies with modifications to improve sensitivity and throughput. The protocol includes protein extraction and digestion, TMT 10-plex labeling, basic pH and acid pH RPLC fractionation, phosphopeptide enrichment, high resolution MS detection, and MS data processing (Fig. 2). When analyzing a range of samples (e.g. cell culture, animal tissues and clinical specimens), we routinely identify and quantify over 10,000 proteins and ~30,000 phosphosites with high confidence from protein samples (0.1–1 mg of protein per sample). Moreover, we implement several quality control steps for troubleshooting and evaluating experimental variation.
Fig. 2.
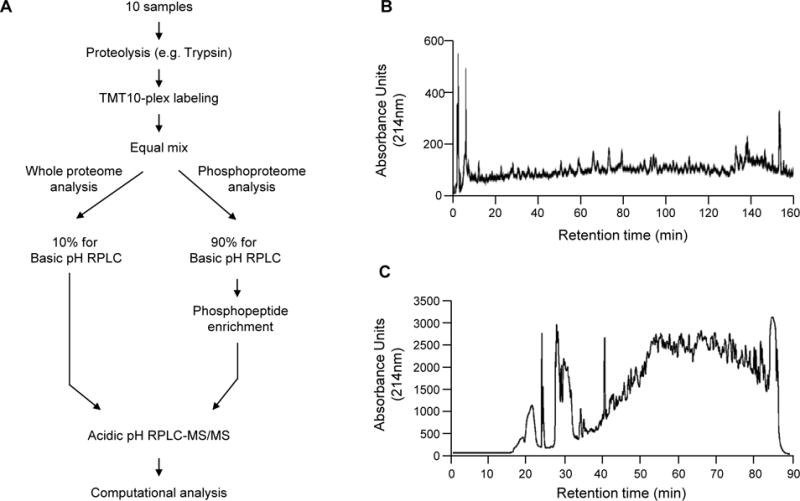
Workflow of TMT-LC/LC-MS/MS for profiling whole proteome and phosphoproteome. (A) The analysis scheme. (B) Basic pH RPLC fractionation for whole proteome analysis. (C) Basic pH RPLC fractionation for phosphoproteome analysis.
Sample preparation by harvesting cells and tissues
In this protocol, TMT 10-plex™ isobaric label reagent set (Thermo Scientific) is used for the proteome or phosphoproteome quantification of 10 samples simultaneously. One mg protein (100 μg per sample) is recommended as starting material for whole proteome quantification, although the analysis may be performed with as low as 100 μg protein (10 μg per sample). For phosphoproteome quantification, 10 mg of proteins are typically used (1 mg per sample) due to the low stoichiometry of phosphorylation. Approximately 1 mg of proteins can be extracted from 10 million mammalian cells on a 15-cm plate with 80% confluence, while the protein yield of tissues is 5–10% of the weight. Considering that protein content varies in different samples, a pilot experiment is often carried out to examine protein yield. Moreover, the samples should be harvested by the identical manner in the shortest period of time to minimize variation.
Suspension cell harvest: collect cells in 15-ml tubes, wash twice with 10 ml ice cold phosphate-buffered saline (PBS), transfer into 1.5-ml tubes and centrifuge to remove supernatant completely.
Adherent cell harvest: wash twice with 10 ml ice cold PBS, scrape and collect cells in PBS, transfer to 1.5-ml tubes and remove PBS by centrifugation. Store cell pellets at −80°C until lysis. Alternatively, the adherent cells can be lysed on plate by directly adding lysis buffer (see below) on the plate after wash. The on-plate lysis is highly recommended for collecting adherent cell samples during phosphoproteome analysis because it is critical to minimize phosphoproteome perturbation during the harvest, given that phosphorylation is highly sensitive to cellular condition changes. To maintain the desired concentration of lysis buffer, the PBS in the wash steps should be removed completely.
Tissue collection: collect tissues in 1.5 ml tubes, weigh and keep tissues in liquid nitrogen immediately after dissection and store at −80°C. For the 10 samples, the tissue sizes and anatomic regions should be similar to reduce sample heterogeneity. For possible blood contamination, the samples should be rinsed with ice cold PBS, as highly abundant blood proteins negatively affect protein quantification and downstream data analysis.
Protein extraction, quality control western blotting, in-solution digestion and peptide purification
The lysis buffer used in this protocol contains 50 mM HEPES, pH 8.5, 8 M urea and 0.5% sodium deoxycholate. For phosphoproteome analysis, 1X PhosSTOP phosphatase inhibitor cocktail (Roche) is added. Handling each of the 10 samples the same way during any step before the pooling of TMT labeled samples is critical to reduce variation. Incomplete sample lysis and partial protein denaturation affect protein digestion efficiency. Therefore, it is important to maintain 8 M urea concentration by considering that the urea itself occupies volume (100 mg of urea occupies ~73 μl in solution), and the volume of cell pellets or tissues should also be taken into account as well.
Add appropriate amount of lysis buffer to cell pellets or tissues (e.g. 10: 1 volume ratio between buffer and samples) to achieve a final protein concentration of 5–10 mg/ml. For on-plate lysis of adherent cells, add lysis buffer on plate, scrape and collect the cells to 1.5-ml tubes. Add in ~20% of the final volume of glass beads (1 mm diameter, Sigma).
Cap the tubes tightly, lyse the samples in Bullet Blender (Next Advance) at 4°C (speed 8, 30 sec on and 5 sec off for 5 cycles) until the samples are homogenized. Alternatively, the samples may be lysed by vortex for 30 sec at room temperature (RT) with 30 sec cooling in between on ice for ~10 cycles. The exact lysis condition may vary upon samples.
-
Mix the lysate well without centrifugation and make at least 3 aliquots: two small aliquots (~15 μl) for measuring protein concentration and positive control validation by western blotting, and the remaining large aliquot for the proteomics analysis.
Note 1: The insoluble debris is kept in the final aliquot, which allow the digestion of insoluble proteins (Pirmoradian et al., 2013).
Note 2: One small aliquot of each sample is used to test for predicted protein changes before proteomics analysis that is time consuming and expensive. Perform western blotting analysis on these samples to confirm positive and negative control proteins that behave the way anticipated. This quality control step also allows the detection of possible mislabeling or other sample issues during sample preparation (Fig. 3).
Measure protein concentration by a standard BCA protein assay (Thermo Scientific) or by a Coomassie stained short SDS gel (10%) (Xu et al., 2009) with bovine serum albumin (BSA) as a standard.
Add 10% acetonitrile (ACN) and LysC (Wako) at an enzyme-to-substrate ratio of 1:100 (w/w) to digest proteins under highly denaturing conditions at RT for 2 h (Pagala et al., 2015). Also add dithiothreitol (DTT) to 1 mM to reduce disulfide bonds in proteins.
Dilute samples to 2 M urea with 50 mM HEPES (pH 8.5) and further digest samples with trypsin (Promega) at RT for 3 h or overnight. The trypsin to protein ratio is 1:50 (w/w).
Further reduce peptides by adding DTT to 1 mM for 2 h at RT.
Add iodoacetamide (IAA) to 10 mM at RT for 30 min in the dark to alkylate Cys-containing peptides.
Quench unreacted IAA by adding DTT to 30 mM and incubate for 30 min at RT.
Terminate the digestion reaction by adding trifluoroacetic acid (TFA) to 1% and check pH by applying a small drop of the solution to pH paper. The pH should be ~2 to 3.
Centrifuge at 20,000 × g at RT for 10 min and collect the supernatant.
Choose the size of C18 desalting cartridge: either an excessive or limited amount of resin may lead to low recovery of peptides during desalting. The size of C18 cartridge should be selected based on the amount of input material. Cartridge capacities are about 3–5% of the sorbent weight (Villen and Gygi, 2008), alternatively we use 1 μl of C18 resin for every 10 μg of peptides as our criteria (Pagala et al., 2015).
Wash cartridge with 5X bed volumes of methanol, 5X bed volumes of 60% ACN/0.1%TFA and condition cartridge with at least of 5X bed volumes of 0.1% TFA.
Load sample on cartridge and wash cartridge with at least 5X bed volumes of 0.1% TFA, elute with 5X bed volumes of 60% ACN/0.1%TFA.
Dry the eluted peptides by Speedvac and store at −80 °C until further analysis.
Fig. 3.
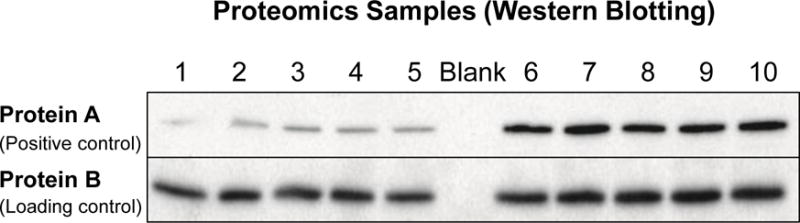
Quality control analysis of one batch of 10 samples by Western blotting analysis. Protein A is a positive control protein expressed at a higher level in samples 6–10. Protein B is a loading control showing no difference in the samples.
TMT labeling of peptides
Isobaric labeling (e.g. TMT and iTRAQ) has become a versatile technique in relative protein quantification by examining up to 10 biological samples simultaneously in a single run. It provides a fast and easy way for protein quantification with high throughput. To achieve an accurate quantification result, the TMT labeling efficiency should be examined to ensure all samples are fully labeled by TMT. This is a critical step as the amount of TMT label used, alterations in pH, or incorrect protein quantitation can lead to inefficient labelling and thus negatively alter all downstream results. In addition, a premix ratio test should be performed to determine the correct ratio for equal mixing before pooling for the remainder of the protocol. Again this is extremely important as pipetting errors can occur along the way that will change concentrations. The premix ratio test is the best way to assure that the amount of each of the 10 samples used for the final mix are all at an equal ratio.
-
Resuspend each desalted peptide sample in 50 mM HEPES buffer (pH 8.5), keep ~ 1 μg of each unlabeled sample for later TMT labeling efficiency test.
Note: pH value should be checked by pH paper. Sample may be acidic if not dried completely after desalting which will affect the labeling efficiency.
Reconstitute TMT reagents in anhydrous acetonitrile and label peptide samples by following the manufacture’s instruction and incubate at RT for 1 h.
Test labeling efficiency: desalt ~1 μg of each TMT labeled and unlabeled samples by Ziptips (Millipore) and analyze TMT labeled samples and unlabeled samples by LC-MS/MS. In a completely TMT labeled sample, the unlabeled peptide should not be detected in the labeled samples (Fig. 4).
If fully labeled, quench the reaction by adding 8 μl of 5% hydroxylamine and incubate for 15 min.
Premix ratio test: mix a small aliquot of each TMT labeled sample, desalt and analyze by LC-MS/MS to determine the global peptide ratio of all 10 samples.
-
Equally mix 10 samples based on the result of the premix ratio test.
Note: The premix ratio test determines which of the 10 samples has the lowest amount of peptides. Use this sample as the baseline to adjust the amounts of other 9 samples.
Desalt the pooled TMT labeled samples by C18 cartridge to remove byproducts of the quenching reaction.
Fig. 4.
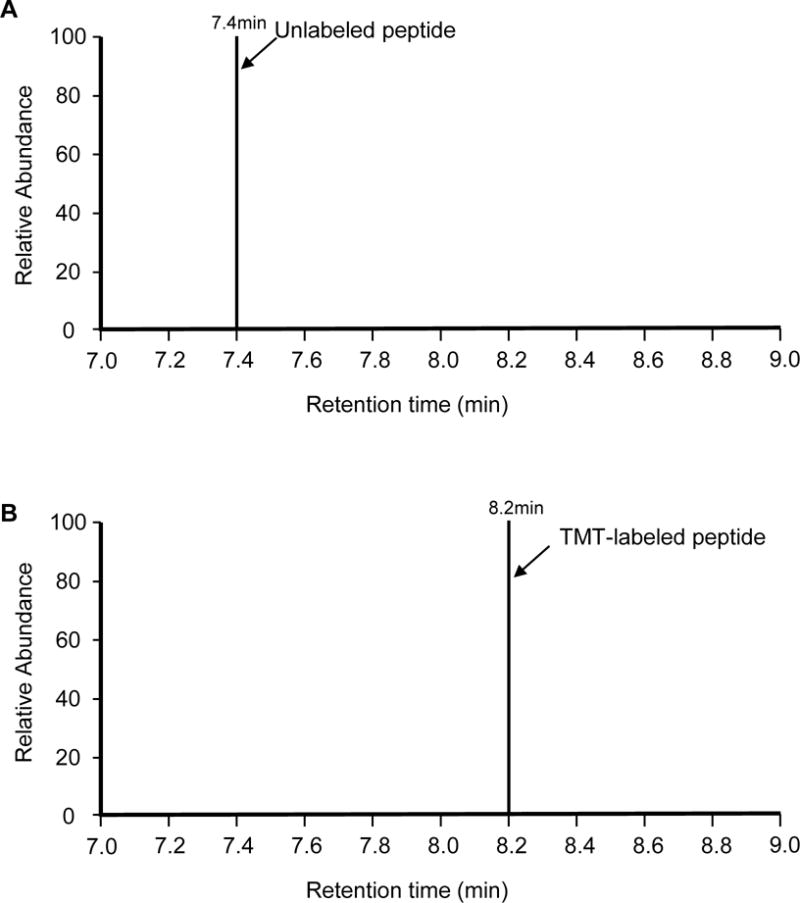
Labeling efficiency analysis. (A) An unlabeled peptide of strong intensity at retention time of 7.4 min during LC-MS/MS. (B) Complete absence of the same peptide at 7.2 min and the presence of the labeled peptide at 8.2 min, indicating fully TMT labeling.
Offline basic pH RPLC fractionation
The number of peptides or proteins that can be identified in one single conventional LC-MS/MS analysis is limited due to sample complexity (dynamic range and number of peptides) even with the latest platform. Several peptide fractionation approaches, such as strong cation exchange (SCX) and hydrophilic interaction chromatography (HILIC), have been applied before standard acidic pH reversed-phase LC-MS/MS analysis to reduce sample complexity. Recently, high pH RPLC has become favored due to its high resolving power and its salt-free solvent system making it compatible with the downstream acidic pH RPLC-MS/MS analysis (Batth et al., 2014).
Set up an XBridge C18 column (4.6 mm × 25 cm, 3.5 μm particle size, Waters) by Agilent 1220 infinity pump for fractionation.
Install a 100 μl loop for whole proteome analysis and a 1 ml loop for phosphoproteome analysis. Wash the loop with 3X loop volume of methanol, water and buffer A (10 mM Ammonium formate, pH 8.0) sequentially.
Wash the column with 100 μl equally mixed isopropanol, methanol, acetonitrile and water and equilibrate the column in 95% buffer A for 1 h.
Solubilize the desalted pooled TMT-labeled peptide sample in buffer A. The sample volume should not be bigger than 70% of the loop volume. Verify the sample pH ~8.0. If still acidic then use ammonium hydroxide to adjust pH to 8.0.
Fractionate whole proteome sample using the following gradient with buffer B (buffer A plus 90% ACN): 15%–20% for 15 min, 20%–35% for 100 min and 35%–50% for 30 min. The fraction collector (FC 203B, Gilson) is set to collect fractions every 2 min including loading time. Alternatively, fractionate phosphoproteome sample in 1 h gradient from 15% to 45% buffer B and collect fractions every min. The flow rate for both runs is 0.4 ml/min.
For whole proteome samples, ~40 fractions (every other fraction, a total of 80 fractions) are selected and dried by Speedvac and used for LC-MS/MS analysis. If ultra-deep proteome coverage is required, all 80 fractions are analyzed. For phosphoproteome samples, dry all fractions (~40 fractions in total) for TiO2 phosphopeptide enrichment.
TiO2 phosphopeptide enrichment
TiO2 phosphopeptide enrichment is dependent on the affinity binding of a phosphate group to TiO2 through co-ordinate bonds. The nonspecific binding of carboxyl groups is reduced by the addition of competitors, such as 2, 5-dihydroxybenzoic acid, glutamic acid, and lactic acid. Previously, we presented a refined TiO2 phosphopeptide enrichment protocol using a low concentration of phosphate as an additive to improve selectivity. Compared with other non-phosphopeptide competitor, phosphate is easy to prepare, effective and robust while giving similar or higher selectivity. Due to the hydrophilicity of phosphopeptides, there are more phosphopeptides eluted in the early basic pH RPLC fractions compared with later fractions. Therefore, slightly lower concentrations of phosphate and increased amounts of TiO2 beads are used in early fractions.
Reconstitute each dried peptide fraction in binding buffer (65% ACN, 2% TFA, 1 μg/μl).
Add KH2PO4 to 0.5 mM for first 5 fractions and 1 mM for other fractions.
Weigh TiO2 beads: 1 mg TiO2 beads/fraction for first 20 fractions, 0.7 mg/fraction for fractions 21–35 and 0.5 mg/fraction for all remaining fractions.
Wash TiO2 beads twice with washing buffer (65% ACN, 0.1% TFA, 200 μl per mg beads) and mix with the peptide solution of the fractions.
Incubate the samples by end-over-end rotation at RT for 20 min.
-
Briefly centrifuge to collect the beads to the bottom of tube, transfer the supernatant to another tube which can be used for consecutive phosphopeptide enrichment if desired.
Note: The supernatant contains non-phosphopeptides that can be used for whole proteome TMT analysis if desired.
Wash phosphopeptide-bound beads twice with wash buffer (200 μl per mg beads), resuspend into 50 μl of wash buffer and transfer beads to a C18 StageTip (Thermo Fisher Scientific) sitting on the top of a 2-ml centrifuge tube. Collect residual beads in the incubation tube by adding another 50 μl of wash buffer and transferring to the StageTip as well.
Centrifuge StageTip to remove the wash buffer, and elute the phosphopeptides with 20 μl of elution buffer (15% NH4OH, 40% ACN, pH =~11). The eluents are dried to completeness rapidly.
Dissolve the enriched phosphopeptides in 5% formic acid (FA) immediately prior to LC-MS/MS analysis to minimize sample loss.
Acidic pH RPLC-MS/MS analysis
During TMT based quantification, peptide ions are indistinguishable in survey MS spectra but are usually quantified based on the intensity of reporter ions after the peptide ion is fragmented and analyzed in MS/MS spectra. A common limitation is that the TMT report ion ratios may be suppressed due to the coelution of TMT-labeled ions, and the co-isolation and co-fragmentation of these interfering ions (Ting et al., 2011). Several strategies have been detailed recently to address the ratio suppression effect. One is to narrow ion isolation window (Savitski et al., 2011). In regards to this, mass spectrometers with quadrupole mass filters (e.g. Q Exactive HF and Orbitrap Fusion Lumos) have higher isolation efficiency at narrower mass windows than instruments using waveform based isolation such as the linear ion trap (e.g. Orbitrap Elite and Velos). Alternatively, MS-based separation, such as gas-phase purification (Wenger et al., 2011) and MultiNotch MS3 method (McAlister et al., 2014), enables more accurate quantifications, but the loss of spectral identifications can be significant. Another approach is to reduce sample complexity by extensive fractionation, including multi-dimensional LC, small C18 particles and long gradients {Zhou, 2013 #7941). In this protocol, we combine offline basic pH RPLC, high resolving power acidic pH RPLC and MS/MS quantification method using optimized isolation width to reduce ratio suppression without diminishing the number of identified peptides or proteins.
To sufficiently resolve near-isobaric reporter ions of some 10-plex TMT reagents (6.32 mDa difference), MS/MS resolution must be at least 30,000 at 400 m/z. Higher energy collision dissociation (HCD) is used for TMT10-plex reporter ion fragmentation. Electron transfer dissociation (ETD) is not recommended for TMT10-plex reagents because ETD cleavage sites are different from HCD and this results in reporter ion overlap. The mass spectrometer used in this protocol is Q Exactive HF (Thermo Scientific).
Pack empty columns (New objective, 75 μm ID for whole proteome sample and 50 μm ID for phosphoproteome samples) with 1.9 μm C18 resin (Dr. Maisch GmbH, Germany) to ~30 cm length. Bed volume of the two columns is 1.3 μl and 0.6 μl respectively. Heat the columns at 65 °C by a butterfly portfolio heater (Phoenix S&T) to reduce backpressure.
Prepare buffer A (5% dimethyl sulfoxide, 0.2% formic acid) and buffer B (buffer A plus 65% ACN) and wash the columns thoroughly with 95% buffer B and equilibrate in 95% buffer A.
Examine the quality of the LC-MS/MS system by two runs using 100 ng of rat brain peptides before analyzing precious TMT labeled samples. The following parameters should be monitored and evaluated: survey MS signal intensity, quality of MS/MS spectra, peak width, overall retention time, the pressure of LC system as well as the run-to-run variability. Clean, calibrate and tune MS instrument regularly and use fresh LC buffers to improve the performance of the system.
For whole proteome samples: reconstitute the dried peptides in 5% FA, load ~0.2 μg on the column and elute by 15–45% of buffer B gradient in 150 min (~0.3 μl/min flow rate). Adjust the gradient slightly for early and late basic pH RPLC fractions. The mass spectrometer is operated in data-dependent mode with a survey scan in Orbitrap (60,000 resolution, 1 × 10⁶ AGC target and 50 ms maximal ion time) and 20 MS/MS high resolution scans (60,000 resolution, 1 × 10⁵ AGC target, ~100 ms maximal ion time, 31 HCD normalized collision energy, 0.4 m/z isolation window, and 20 s dynamic exclusion).
For phosphoproteome samples: resuspend the dried phosphopeptides in 2 μl of 5% FA, load all on the column and elute with 9–35% of buffer B in 200 min and 35–65% buffer B for 40 min (0.15 μl/min flow rate). Adjust the gradient slightly for early and late basic pH RPLC fractions. Mass spectrometer setting is the same as the above except larger isolation window to improve sensitivity (1 m/z isolation width with 0.3 m/z offset).
MS Data analysis
Database search: The MS/MS raw files are processed by the SEQUEST algorithm (Eng et al., 1994), or the newly developed tag-based hybrid search engine JUMP (Wang et al., 2014). Pattern-based database search (e.g. SEQUEST) and tag-based de novo sequencing (e.g. PEAKS but with limited sensitivity) are common computer algorithms. The JUMP algorithm combines pattern matching and de novo sequencing to score putative peptides, and shows better sensitivity and specificity. The search is typically against the UniProt human database (or other appropriate species specific database) concatenated with a reverse protein sequence decoy database. Briefly, the spectra are converted to mzXML files and then JUMP first performs preprocessing of precursor ions and MS/MS spectra to generate tags and then does MS/MS pattern matching against a database and provides a ranking score (J score). The target-decoy strategy is used to evaluate false discovery rate (FDR) of peptide and protein identification (Peng et al., 2003). Searches were performed using a 10 ppm mass tolerance for precursor ions and fragment ions, fully tryptic restriction with two maximal missed cleavages, three maximal modification sites, and the assignment of a, b, and y ions. TMT tags on Lys residues and N termini (+229.162932 Da) and carbamidomethylation of Cys residues (+57.021 Da) are used for static modifications. Dynamic modifications include Met oxidation (+15.99492 Da) and Ser/Thr/Tyr phosphorylation (+79.96633, only for phosphoproteome data).
Data filtering for whole proteome data: To remove false positive matches and low quality peptide spectrum matches (PSM), the assigned peptides are filtered by minimal peptide length (7 amino acid), m/z accuracy (e.g., 5 ppm) and matching scores (J score and deltaCn). The peptides are then divided into groups according to peptide length, trypticity, and charge state, and then further filtered by matching scores to reduce protein FDR to below 1%. For proteins identified by a single spectral count, higher matching scores are required. If peptides are shared by multiple members of a protein family, the matched protein members are clustered into one group. According to the parsimony principle, the group is represented by the protein with the highest number of assigned peptides and other proteins matched by unique peptides.
Data filtering for phosphoproteome data is similar to whole proteome data except peptide FDR is used as a cutoff as opposed to protein FDR.
To evaluate the confidence of assigned phosphosites in peptides, we used the concept of the phosphoRS algorithm (Taus et al., 2011). Another available option to evaluate phosphosite localization is the Ascore algorithm (Beausoleil et al., 2006).
Quantification: proteins or phosphopeptides are quantified by summing reporter ion counts across all matched PSMs using an in-house program in the JUMP software suite. Briefly, for each identified PSM, TMT reporter ion intensities are extracted and corrected based on isotopic distribution of labeling reagents. For example, the TMT126 reagent generates 91.8% 126 m/z reporter ion, 7.9% 127C m/z reporter ion, and 0.3% of 128C m/z reporter ion. PSMs with zero intensities are recorded but not used for further calculation. PSMs with low intensities are filtered by user-defined thresholds. High noise PSMs are also discarded by percentage of precursor ion in the isolation window of the survey scan (e.g. at least 80%). Then the average of all 10 reporter ions are used to calculate a relative signal between each reporter ion and the average. The relative signals of PSMs are summed for identified proteins or phosphopeptides. Finally, these relative signals are converted to absolute signals by multiplying the averaged reporter ion intensity of the top 3 PSMs in corresponding proteins or phosphopeptides.
The protein or phosphopeptide quantification values are exported in Excel for further analysis. In general, the method of analysis of variance (ANOVA) is used to identify proteins or phosphopeptides that are differentially expressed.
Proteomics results and selected validation
In the table of proteome data, the following information is exported for each quantified protein: protein accession number, protein annotation, gene name, PSM number, total peptide number, unique peptide number, percentage of coverage, matching scores (J score and deltaJn) of the top scored peptide, and the final reporter ion intensities of each protein. The phosphoproteome data is quantified at phosphopeptide level, including the related protein information (protein accession number, protein annotation and gene name), the phosphopeptide’s PSM number, phosphosite ambiguity score (e.g. from phosphoRS or Ascore), and reporter ion intensities.
To differentiate experimental variance from biological alteration, the biological replicates are compared as a null experiment (Fig. 5). The log2 ratio distribution of the null comparison is closer to zero compared with that of case-control comparison, indicating that the biological alteration of the case-control comparison is larger than experimental variance.
Fig. 5.
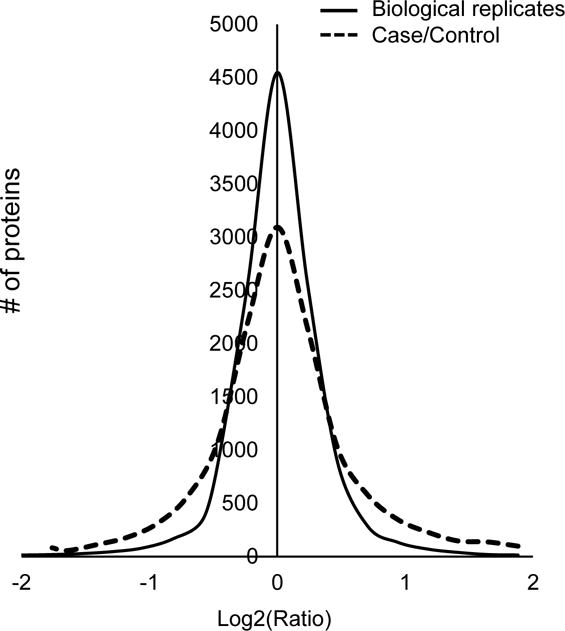
Analysis of experimental variance and control-case comparison. Distribution of log2 ratios between biological replicates (null experiment) and the control-case comparison.
Although the data processing can significantly reduce false positives in the steps of identification and quantification, we cannot completely eliminate false results, and find that there are more false positives in the group of proteins or peptides identified by only one single peptide. Inaccuracy in quantification also exists due to low intensity, errors in data processing (e.g. missing reporter ions due to irregular mass shift), peptide sharing, and ambiguity of phosphosite assignment. Therefore, it is highly recommend that extra validation steps are applied to confirm the MS data. (1) Manually examine the MS/MS spectra of proteins or phosphosite of interest to validate the peptide sequence and TMT reporter ion quantification. (2) Use known protein or phosphosite quantification data to confirm MS results. (3) Verify protein or phosphosite changes by antibody-based approaches (e.g., Western blotting and immunohistochemistry). (4) Chemically synthesize the peptides of interest, and then use them as internal standards to confirm the identification of native peptides. Their MS/MS patterns and retention time during LC-MS/MS should be identical. (5) Verify protein changes by targeted MS strategy approaches. At least one if not multiple methods of validation need to be performed before proceeding with time-consuming biological experiments for testing derived hypothesis.
Conclusions and discussion
Here we describe a high throughput protocol for quantification of proteins and posttranslational modifications by isobaric labeling. In this routine protocol, from 10 protein samples analyzed in a batch, we analyze over 10,000 proteins and ~30,000 phosphosites with high consistency. In this protocol, phosphopeptides are enriched after labeling to reduce variance. However, for some protein modifications (e.g. ubiquitination), if the TMT conjugation interferes with the enrichment process, the enrichment has to be carried out before the isobaric labeling (Kim et al., 2011). With slight procedure rearrangement, this protocol can be widely used as a general proteomics approach to the study of proteins and multiple modifications. In summary, the protocol here provides a powerful technique to obtain deep protein coverage and alleviate ratio suppression during quantification. Such comprehensive proteomics analysis can be integrated with genomics, transcriptomics, and possibly metabolomics, for comprehensive understanding of biological systems and novel discoveries of molecular mechanisms, biomarkers and therapeutic targets in human disease {Li, 2016 #7939;Yuan, 2014 #7940;Wang, 2016 #9;Zhou, 2013 #7941;Nesvizhskii, 2014 #7942;Fagerberg, 2014 #7943}.
Acknowledgments
The authors thank all other members in the Peng lab and St. Jude Proteomics Facility for insightful discussion. This work was partially supported by National Institutes of Health grants R01AG047928 (J.P.), R01AG053987 (J.P.), R01GM114260 (J.P.) and ALSAC (American Lebanese Syrian Associated Charities). The MS analysis was performed in St. Jude Proteomics Facility, partially supported by NIH Cancer Center Support Grant (P30CA021765).
References
- Altelaar AF, Munoz J, Heck AJ. Next-generation proteomics: towards an integrative view of proteome dynamics. Nat Rev Genet. 2013;14(1):35–48. doi: 10.1038/nrg3356. [DOI] [PubMed] [Google Scholar]
- Azimifar SB, Nagaraj N, Cox J, Mann M. Cell-type-resolved quantitative proteomics of murine liver. Cell Metab. 2014;20(6):1076–1087. doi: 10.1016/j.cmet.2014.11.002. [DOI] [PubMed] [Google Scholar]
- Bai B, Chen PC, Hales CM, Wu Z, Pagala V, High AA, Levey AI, Lah JJ, Peng J. Integrated approaches for analyzing U1-70K cleavage in Alzheimer’s disease. J Proteome Res. 2014;13(11):4526–4534. doi: 10.1021/pr5003593. [DOI] [PMC free article] [PubMed] [Google Scholar]
- Bai B, Hales CM, Chen PC, Gozal Y, Dammer EB, Fritz JJ, Wang X, Xia Q, Duong DM, Street C, Cantero G, Cheng D, Jones DR, Wu Z, Li Y, Diner I, Heilman CJ, Rees HD, Wu H, Lin L, Szulwach KE, Gearing M, Mufson EJ, Bennett DA, Montine TJ, Seyfried NT, Wingo TS, Sun YE, Jin P, Hanfelt J, Willcock DM, Levey A, Lah JJ, Peng J. U1 small nuclear ribonucleoprotein complex and RNA splicing alterations in Alzheimer’s disease. Proc Natl Acad Sci U S A. 2013;110(41):16562–16567. doi: 10.1073/pnas.1310249110. [DOI] [PMC free article] [PubMed] [Google Scholar]
- Batth TS, Francavilla C, Olsen JV. Off-line high-pH reversed-phase fractionation for in-depth phosphoproteomics. J Proteome Res. 2014;13(12):6176–6186. doi: 10.1021/pr500893m. [DOI] [PubMed] [Google Scholar]
- Beausoleil SA, Villen J, Gerber SA, Rush J, Gygi SP. A probability-based approach for high-throughput protein phosphorylation analysis and site localization. Nat Biotechnol. 2006;24(10):1285–1292. doi: 10.1038/nbt1240. [DOI] [PubMed] [Google Scholar]
- Beltran L, Cutillas PR. Advances in phosphopeptide enrichment techniques for phosphoproteomics. Amino Acids. 2012;43(3):1009–1024. doi: 10.1007/s00726-012-1288-9. [DOI] [PubMed] [Google Scholar]
- Bensimon A, Heck AJ, Aebersold R. Mass spectrometry-based proteomics and network biology. Annu Rev Biochem. 2012;81:379–405. doi: 10.1146/annurev-biochem-072909-100424. [DOI] [PubMed] [Google Scholar]
- Churchman ML, Low J, Qu C, Paietta EM, Kasper LH, Chang Y, Payne-Turner D, Althoff MJ, Song G, Chen SC, Ma J, Rusch M, McGoldrick D, Edmonson M, Gupta P, Wang YD, Caufield W, Freeman B, Li L, Panetta JC, Baker S, Yang YL, Roberts KG, McCastlain K, Iacobucci I, Peters JL, Centonze VE, Notta F, Dobson SM, Zandi S, Dick JE, Janke L, Peng J, Kodali K, Pagala V, Min J, Mayasundari A, Williams RT, Willman CL, Rowe J, Luger S, Dickins RA, Guy RK, Chen T, Mullighan CG. Efficacy of Retinoids in IKZF1-Mutated BCR-ABL1 Acute Lymphoblastic Leukemia. Cancer Cell. 2015;28(3):343–356. doi: 10.1016/j.ccell.2015.07.016. [DOI] [PMC free article] [PubMed] [Google Scholar]
- Eng JK, McCormack AL, Yates JR. An approach to correlate tandem mass spectral data of peptides with amino acid sequences in a protein database. J Am Soc Mass Spectrom. 1994;5(11):976–989. doi: 10.1016/1044-0305(94)80016-2. [DOI] [PubMed] [Google Scholar]
- Everley RA, Kunz RC, McAllister FE, Gygi SP. Increasing throughput in targeted proteomics assays: 54-plex quantitation in a single mass spectrometry run. Anal Chem. 2013;85(11):5340–5346. doi: 10.1021/ac400845e. [DOI] [PubMed] [Google Scholar]
- Fagerberg L, Hallstrom BM, Oksvold P, Kampf C, Djureinovic D, Odeberg J, Habuka M, Tahmasebpoor S, Danielsson A, Edlund K, Asplund A, Sjostedt E, Lundberg E, Szigyarto CA, Skogs M, Takanen JO, Berling H, Tegel H, Mulder J, Nilsson P, Schwenk JM, Lindskog C, Danielsson F, Mardinoglu A, Sivertsson A, von Feilitzen K, Forsberg M, Zwahlen M, Olsson I, Navani S, Huss M, Nielsen J, Ponten F, Uhlen M. Analysis of the human tissue-specific expression by genome-wide integration of transcriptomics and antibody-based proteomics. Mol Cell Proteomics. 2014;13(2):397–406. doi: 10.1074/mcp.M113.035600. [DOI] [PMC free article] [PubMed] [Google Scholar]
- Geyer PE, Kulak NA, Pichler G, Holdt LM, Teupser D, Mann M. Plasma Proteome Profiling to Assess Human Health and Disease. Cell Syst. 2016;2(3):185–195. doi: 10.1016/j.cels.2016.02.015. [DOI] [PubMed] [Google Scholar]
- Hebert AS, Richards AL, Bailey DJ, Ulbrich A, Coughlin EE, Westphall MS, Coon JJ. The one hour yeast proteome. Mol Cell Proteomics. 2014;13(1):339–347. doi: 10.1074/mcp.M113.034769. [DOI] [PMC free article] [PubMed] [Google Scholar]
- Hein MY, Hubner NC, Poser I, Cox J, Nagaraj N, Toyoda Y, Gak IA, Weisswange I, Mansfeld J, Buchholz F, Hyman AA, Mann M. A human interactome in three quantitative dimensions organized by stoichiometries and abundances. Cell. 2015;163(3):712–723. doi: 10.1016/j.cell.2015.09.053. [DOI] [PubMed] [Google Scholar]
- Kim MS, Pinto SM, Getnet D, Nirujogi RS, Manda SS, Chaerkady R, Madugundu AK, Kelkar DS, Isserlin R, Jain S, Thomas JK, Muthusamy B, Leal-Rojas P, Kumar P, Sahasrabuddhe NA, Balakrishnan L, Advani J, George B, Renuse S, Selvan LD, Patil AH, Nanjappa V, Radhakrishnan A, Prasad S, Subbannayya T, Raju R, Kumar M, Sreenivasamurthy SK, Marimuthu A, Sathe GJ, Chavan S, Datta KK, Subbannayya Y, Sahu A, Yelamanchi SD, Jayaram S, Rajagopalan P, Sharma J, Murthy KR, Syed N, Goel R, Khan AA, Ahmad S, Dey G, Mudgal K, Chatterjee A, Huang TC, Zhong J, Wu X, Shaw PG, Freed D, Zahari MS, Mukherjee KK, Shankar S, Mahadevan A, Lam H, Mitchell CJ, Shankar SK, Satishchandra P, Schroeder JT, Sirdeshmukh R, Maitra A, Leach SD, Drake CG, Halushka MK, Prasad TS, Hruban RH, Kerr CL, Bader GD, Iacobuzio-Donahue CA, Gowda H, Pandey A. A draft map of the human proteome. Nature. 2014;509(7502):575–581. doi: 10.1038/nature13302. [DOI] [PMC free article] [PubMed] [Google Scholar]
- Kim W, Bennett EJ, Huttlin EL, Guo A, Li J, Possemato A, Sowa ME, Rad R, Rush J, Comb MJ, Harper JW, Gygi SP. Systematic and quantitative assessment of the ubiquitin-modified proteome. Mol Cell. 2011;44(2):325–340. doi: 10.1016/j.molcel.2011.08.025. [DOI] [PMC free article] [PubMed] [Google Scholar]
- Li Y, Wang X, Cho JH, Shaw TI, Wu Z, Bai B, Wang H, Zhou S, Beach TG, Wu G, Zhang J, Peng J. JUMPg: an Integrative Proteogenomics Pipeline Identifying Unannotated Proteins in Human Brain and Cancer Cells. J Proteome Res. 2016 doi: 10.1021/acs.jproteome.6b00344. [DOI] [PMC free article] [PubMed] [Google Scholar]
- McAlister GC, Huttlin EL, Haas W, Ting L, Jedrychowski MP, Rogers JC, Kuhn K, Pike I, Grothe RA, Blethrow JD, Gygi SP. Increasing the multiplexing capacity of TMTs using reporter ion isotopologues with isobaric masses. Anal Chem. 2012;84(17):7469–7478. doi: 10.1021/ac301572t. [DOI] [PMC free article] [PubMed] [Google Scholar]
- McAlister GC, Nusinow DP, Jedrychowski MP, Wuhr M, Huttlin EL, Erickson BK, Rad R, Haas W, Gygi SP. MultiNotch MS3 enables accurate, sensitive, and multiplexed detection of differential expression across cancer cell line proteomes. Anal Chem. 2014;86(14):7150–7158. doi: 10.1021/ac502040v. [DOI] [PMC free article] [PubMed] [Google Scholar]
- Mertz JL, Tan H, Pagala V, Bai B, Chen PC, Li Y, Cho JH, Shaw TI, Wang X, Peng J. Sequential elution interactome analysis of the Mind bomb 1 ubiquitin ligase reveals a novel role in dendritic spine outgrowth. Mol Cell Proteomics. 2015 doi: 10.1074/mcp.M114.045898. [DOI] [PMC free article] [PubMed] [Google Scholar]
- Nesvizhskii AI. Proteogenomics: concepts, applications and computational strategies. Nat Methods. 2014;11(11):1114–1125. doi: 10.1038/nmeth.3144. [DOI] [PMC free article] [PubMed] [Google Scholar]
- Pagala VR, High AA, Wang X, Tan H, Kodali K, Mishra A, Kavdia K, Xu Y, Wu Z, Peng J. Quantitative protein analysis by mass spectrometry. Methods Mol Biol. 2015;1278:281–305. doi: 10.1007/978-1-4939-2425-7_17. [DOI] [PubMed] [Google Scholar]
- Peng J, Elias JE, Thoreen CC, Licklider LJ, Gygi SP. Evaluation of multidimensional chromatography coupled with tandem mass spectrometry (LC/LC-MS/MS) for large-scale protein analysis: the yeast proteome. J Proteome Res. 2003;2(1):43–50. doi: 10.1021/pr025556v. [DOI] [PubMed] [Google Scholar]
- Pirmoradian M, Budamgunta H, Chingin K, Zhang B, Astorga-Wells J, Zubarev RA. Rapid and deep human proteome analysis by single-dimension shotgun proteomics. Mol Cell Proteomics. 2013;12(11):3330–3338. doi: 10.1074/mcp.O113.028787. [DOI] [PMC free article] [PubMed] [Google Scholar]
- Savitski MM, Sweetman G, Askenazi M, Marto JA, Lang M, Zinn N, Bantscheff M. Delayed fragmentation and optimized isolation width settings for improvement of protein identification and accuracy of isobaric mass tag quantification on Orbitrap-type mass spectrometers. Anal Chem. 2011;83(23):8959–8967. doi: 10.1021/ac201760x. [DOI] [PubMed] [Google Scholar]
- Song C, Ye M, Han G, Jiang X, Wang F, Yu Z, Chen R, Zou H. Reversed-phase-reversed-phase liquid chromatography approach with high orthogonality for multidimensional separation of phosphopeptides. Anal Chem. 2010;82(1):53–56. doi: 10.1021/ac9023044. [DOI] [PubMed] [Google Scholar]
- Tan H, Wu Z, Wang H, Bai B, Li Y, Wang X, Zhai B, Beach TG, Peng J. Refined phosphopeptide enrichment by phosphate additive and the analysis of human brain phosphoproteome. Proteomics. 2015;15(2–3):500–507. doi: 10.1002/pmic.201400171. [DOI] [PMC free article] [PubMed] [Google Scholar]
- Taus T, Kocher T, Pichler P, Paschke C, Schmidt A, Henrich C, Mechtler K. Universal and confident phosphorylation site localization using phosphoRS. J Proteome Res. 2011;10(12):5354–5362. doi: 10.1021/pr200611n. [DOI] [PubMed] [Google Scholar]
- Thingholm TE, Larsen MR. The Use of Titanium Dioxide for Selective Enrichment of Phosphorylated Peptides. Methods Mol Biol. 2016;1355:135–146. doi: 10.1007/978-1-4939-3049-4_9. [DOI] [PubMed] [Google Scholar]
- Thongboonkerd V, LaBaer J, Domont GB. Recent advances of proteomics applied to human diseases. J Proteome Res. 2014;13(11):4493–4496. doi: 10.1021/pr501038g. [DOI] [PubMed] [Google Scholar]
- Ting L, Rad R, Gygi SP, Haas W. MS3 eliminates ratio distortion in isobaric multiplexed quantitative proteomics. Nat Methods. 2011;8(11):937–940. doi: 10.1038/nmeth.1714. [DOI] [PMC free article] [PubMed] [Google Scholar]
- Villen J, Gygi SP. The SCX/IMAC enrichment approach for global phosphorylation analysis by mass spectrometry. Nat Protoc. 2008;3(10):1630–1638. doi: 10.1038/nprot.2008.150. [DOI] [PMC free article] [PubMed] [Google Scholar]
- Wang H, Sun S, Zhang Y, Chen S, Liu P, Liu B. An off-line high pH reversed-phase fractionation and nano-liquid chromatography-mass spectrometry method for global proteomic profiling of cell lines. J Chromatogr B Analyt Technol Biomed Life Sci. 2015;974:90–95. doi: 10.1016/j.jchromb.2014.10.031. [DOI] [PubMed] [Google Scholar]
- Wang H, Yang Y, Li Y, Bai B, Wang X, Tan H, Liu T, Beach TG, Peng J, Wu Z. Systematic optimization of long gradient chromatography mass spectrometry for deep analysis of brain proteome. J Proteome Res. 2015;14(2):829–838. doi: 10.1021/pr500882h. [DOI] [PMC free article] [PubMed] [Google Scholar]
- Wang X, Li Y, Wu Z, Wang H, Tan H, Peng J. JUMP: a tag-based database search tool for peptide identification with high sensitivity and accuracy. Mol Cell Proteomics. 2014;13(12):3663–3673. doi: 10.1074/mcp.O114.039586. [DOI] [PMC free article] [PubMed] [Google Scholar]
- Wang X, Pandey AK, Mulligan MK, Williams EG, Mozhui K, Li Z, Jovaisaite V, Quarles LD, Xiao Z, Huang J, Capra JA, Chen Z, Taylor WL, Bastarache L, Niu X, Pollard KS, Ciobanu DC, Reznik AO, Tishkov AV, Zhulin IB, Peng J, Nelson SF, Denny JC, Auwerx J, Lu L, Williams RW. Joint mouse-human phenome-wide association to test gene function and disease risk. Nat Commun. 2016;7:10464. doi: 10.1038/ncomms10464. [DOI] [PMC free article] [PubMed] [Google Scholar]
- Wenger CD, Lee MV, Hebert AS, McAlister GC, Phanstiel DH, Westphall MS, Coon JJ. Gas-phase purification enables accurate, multiplexed proteome quantification with isobaric tagging. Nat Methods. 2011;8(11):933–935. doi: 10.1038/nmeth.1716. [DOI] [PMC free article] [PubMed] [Google Scholar]
- Wilhelm M, Schlegl J, Hahne H, Moghaddas Gholami A, Lieberenz M, Savitski MM, Ziegler E, Butzmann L, Gessulat S, Marx H, Mathieson T, Lemeer S, Schnatbaum K, Reimer U, Wenschuh H, Mollenhauer M, Slotta-Huspenina J, Boese JH, Bantscheff M, Gerstmair A, Faerber F, Kuster B. Mass-spectrometry-based draft of the human proteome. Nature. 2014;509(7502):582–587. doi: 10.1038/nature13319. [DOI] [PubMed] [Google Scholar]
- Xu P, Duong DM, Peng J. Systematical optimization of reverse-phase chromatography for shotgun proteomics. J Proteome Res. 2009;8(8):3944–3950. doi: 10.1021/pr900251d. [DOI] [PMC free article] [PubMed] [Google Scholar]
- Yang F, Shen Y, Camp DG, 2nd, Smith RD. High-pH reversed-phase chromatography with fraction concatenation for 2D proteomic analysis. Expert Rev Proteomics. 2012;9(2):129–134. doi: 10.1586/epr.12.15. [DOI] [PMC free article] [PubMed] [Google Scholar]
- Yuan Y, Van Allen EM, Omberg L, Wagle N, Amin-Mansour A, Sokolov A, Byers LA, Xu Y, Hess KR, Diao L, Han L, Huang X, Lawrence MS, Weinstein JN, Stuart JM, Mills GB, Garraway LA, Margolin AA, Getz G, Liang H. Assessing the clinical utility of cancer genomic and proteomic data across tumor types. Nat Biotechnol. 2014;32(7):644–652. doi: 10.1038/nbt.2940. [DOI] [PMC free article] [PubMed] [Google Scholar]
- Zhou F, Lu Y, Ficarro SB, Adelmant G, Jiang W, Luckey CJ, Marto JA. Genome-scale proteome quantification by DEEP SEQ mass spectrometry. Nat Commun. 2013;4:2171. doi: 10.1038/ncomms3171. [DOI] [PMC free article] [PubMed] [Google Scholar]