. 2017 Mar 27;6:e24669. doi: 10.7554/eLife.24669

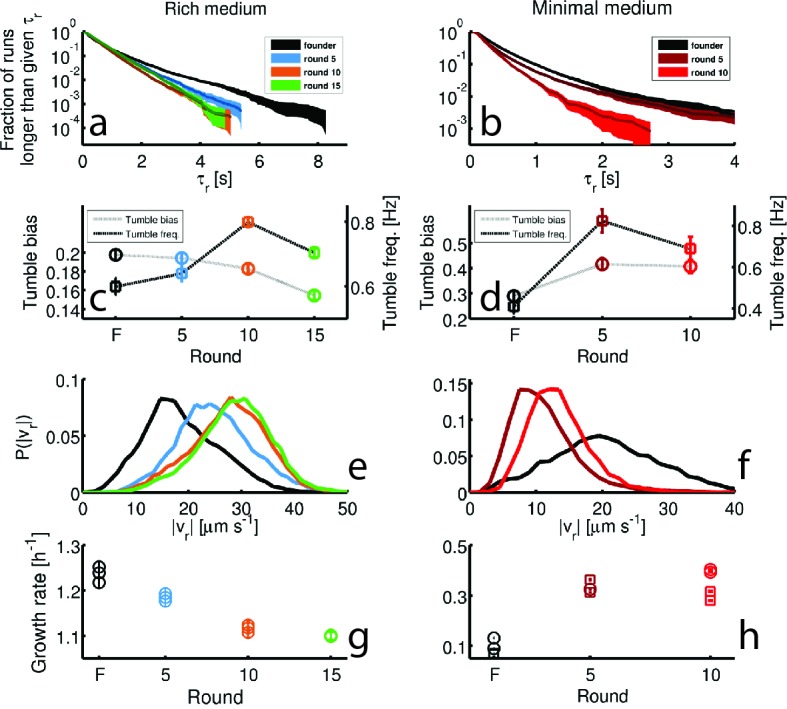
Figure 3. Dynamics of phenotypic evolution in rich and minimal media.

(a–f) Show single-cell swimming phenotypes (run duration (τr), run speed (|vr|), tumble bias and tumble frequency, see Materials and methods). Tracking was performed for founding strain (140 cells, 19,597 run events), strains isolated after 5 (79 cells, 12,217 run events), 10 (97 cells, 18,505 run events) and 15 (96 cells, 15,928 run events) rounds in rich media and in minimal media for the founding strain (72 cells, 7556 run events), round 5 (45 cells, 9724 run events) and round 10 (25 cells, 4892 run events). (a) Shows the fraction of runs longer than a given τr for strains evolved in rich media (95% confidence intervals from bootstrapping). The mean and standard deviation in run duration for founder is 0.66 ± 0.78 s, for round 5: 0.63 ± 0.61 s, for round 10: 0.58 ± 0.50 s and for round 15: 0.65 ± 0.57 s. Round 5, 10 and 15 strains exhibit shorter average run durations than founder (p<0.05). (b) Shows the same distribution for strains in minimal medium with founder exhibiting average run duration 0.49 ± 0.52 s, round 5: 0.44 ± 0.48 s and round 10: 0.33 ± 0.28 s. Rounds 5 and 10 exhibit shorter average run durations than founder (p<108). (c–d) Show average fraction of time spent tumbling (tumble bias) and tumble frequency (tumbles per second) for rich medium and minimal medium respectively. Note the two vertical axes. In rich medium only the round 15 tumble bias is significantly different from founder (p<0.001), but the tumble frequency is higher than founder for both rounds 10 and 15 (p<0.001). In minimal medium all tumble biases and frequencies are significantly different from founder for all strains (p<0.001). (e) Shows run speed distributions for strains evolved in rich medium, legend in (a) applies. The average ± standard deviation run speeds are, for founder: 18.7 ± 7.1 μm s−1, round 5: 24.9 ± 7.1 μm s−1, round 10: 27.6 ± 7.0 μm s−1, and for round 15: 28.7 ± 6.8 μm s−1. Average run speeds for rounds 5, 10 and 15 are greater than founder (f) Shows the same distributions for strains evolved in minimal medium, average run speed for founder: 20.7 ± 10.8 μm s−1, for round 5: 11.2 ± 4.8 μm s−1 and for round 10: 13.3 ± 4.4 μm s−1. Both rounds 5 and 10 exhibit slower average run speeds than founder, the legend in (b) applies. (g–h) Show growth rates in well mixed liquid culture for all strains studied in panels (a–f) in the medium in which the strains were selected. (g) Shows triplicate measurements from each of the four strains isolated in rich medium. Rounds 5, 10 and 15 exhibit slower growth than founder (p<0.01). (h) Shows growth rates for strains isolated from minimal medium selection experiment. Four replicate measurements were made for founder and round 10 and three replicate measurements for round 5. Squares and circles demarcate measurements made on separate days. Rounds 5 and 10 have higher growth rates than founder (p<10-5).
DOI: http://dx.doi.org/10.7554/eLife.24669.015

Figure 3.

Figure 3—figure supplement 1. Microfluidic device and single-cell swimming trajectory.
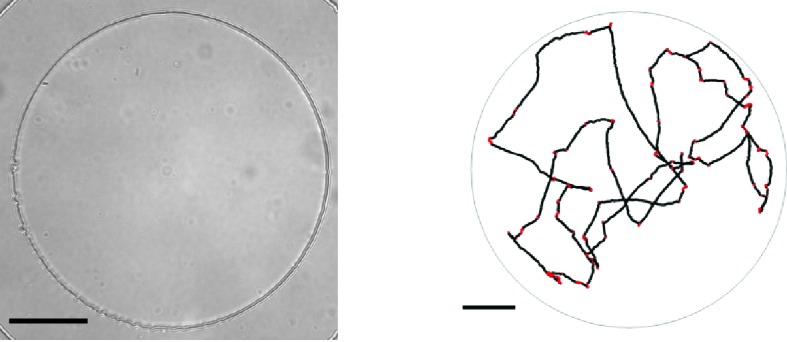
Figure 3—figure supplement 1.

(left) Bright-field image at 20× magnification of the PDMS microfluidic chamber used to trap single bacteria.The boundary of the chamber can be seen as the high contrast circle. Scale bar is 50 μm. (right) A segmented trajectory of a single cell in a chamber like the one shown on the left. Dots indicate locations of the centroid. Black portions indicate running events and red portions tumbles. Image processing and run-tumble detection are described in the Materials and methods section of the main text.
Figure 3—figure supplement 2. Tumble durations and run lengths for evolved strains.
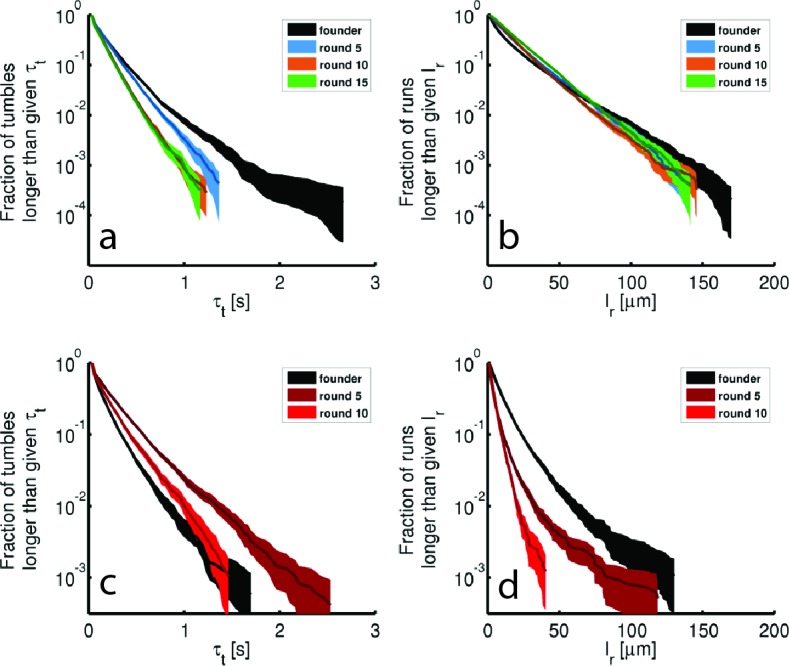
Figure 3—figure supplement 2.

Tumble durations (τt) and run lengths (lr) for single-cell tracking shown in Figure 3 of the main text. (a) Shows the complementary cumulative distribution of tumble durations for rich media evolved strains. Shaded regions are 95% confidence intervals from bootstrapping. Averages and standard deviations are: 0.18 ± 0.20 s, 0.17 ± 0.16 s, 0.14 ± 0.13 s, 0.14 ± 0.12 s for founder, round 5, 10 and 15 respectively. (b) Identical to (a) except constructed for run lengths. The run length is found by computing the arc-length between tumble events for each run. The averages and standard deviations are 13.5 ± 17.7 μm, 16.5 ± 17.4 μm, 16.5 ± 16.0 μm, 19 ± 17.8 μm respectively. (c) and (d) are identical to (a) and (b) for minimal medium evolved strains (replicate 1, Figure 1e). The tumble durations are 0.17 ± 0.17 s, 0.25 ± 0.28 s, 0.20 ± 0.21 s for founder, round 5 and 10. The respective run lengths are 10.0 ± 13.0 μm, 5.0 ± 7.5 μm and 4.6 ± 4.6 μm.
Figure 3—figure supplement 3. Reproducibility of the evolved phenotype.
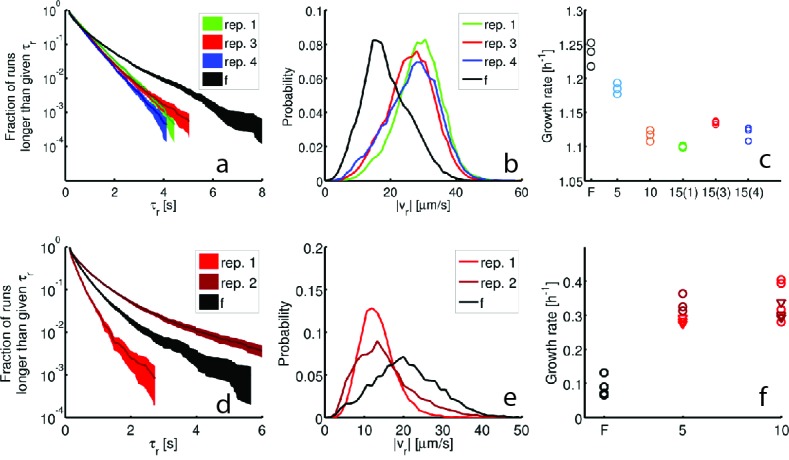
Figure 3—figure supplement 3.

Single-cell tracking and growth rate measurements were performed on independently selected strains in rich medium (15 rounds, (a–c)) and minimal medium (10 rounds, (d–f)). Panels show run durations (a,d), run speeds (b,e) and growth rates (c,f). The founder population is shown in black in all panels. Single-cell tracking experiments were performed on two additional round 15 strains from the rich medium experiment (replicates 3 and 4, Figure 1c main text). For replicates 1, 3 and 4– 96, 85 and 98 individuals were tracked for a total of 15,928, 16,639 and 18,171 run events respectively. (a) shows the run duration distributions for these three strains with mean ± standard deviations: 0.65 ± 0.57 s, 0.60 ± 0.53 s, 0.57 ± 0.49 s respectively. (b) Run speed (|vr|) distributions for the same three strains with means 28.7 μm s−1, 26.2 μm s−1 and 26.7 μm s−1 respectively. (c) maximum growth rates (kg) for the same two independently evolved strains (with 15(3) denoting replicate 3 and 15(4) denoting replicate 4). The decline in growth rate relative to founder is significant for both replicate 3 (p<103) and replicate 4 (p<103). (d–f) show swimming statistics and growth rates for independently evolved strains in minimal medium, replicate 1 and 2 correspond to Figure 1e in the main text. (d) Run duration distributions for constructed for 25 individuals from replicate 1 and 80 individuals from replicate 2 corresponding to 4892 and 9357 run events respectively. The mean ± standard deviations are: 0.33 ± 0.26 s and 0.65 ± 0.87 s. (e) Run speed distributions for independently evolved minimal medium strains. Means for replicates 1 and 2 are 13.3 μm s−1 and 15.25 μm s−1 respectively. (f) Growth rates for founder, rounds 5 and 10 reproduced from Figure 1e, main text (circles) along with growth rate measurements for strain isolated from round 5 of replicate 2 (dark red triangles) and round 10 of replicate 2 (light red triangles). Means are 0.3h-1and 0.24h-1 Round 5 growth rates do not differ significantly (p=0.24) while round 10 growth rates do (p<0.02). Both replicate 2 strains from rounds 5 and 10 exhibit growth rates larger than founder (p<0.001).
Figure 3—figure supplement 4. Swimming statistics as a function of culture density.
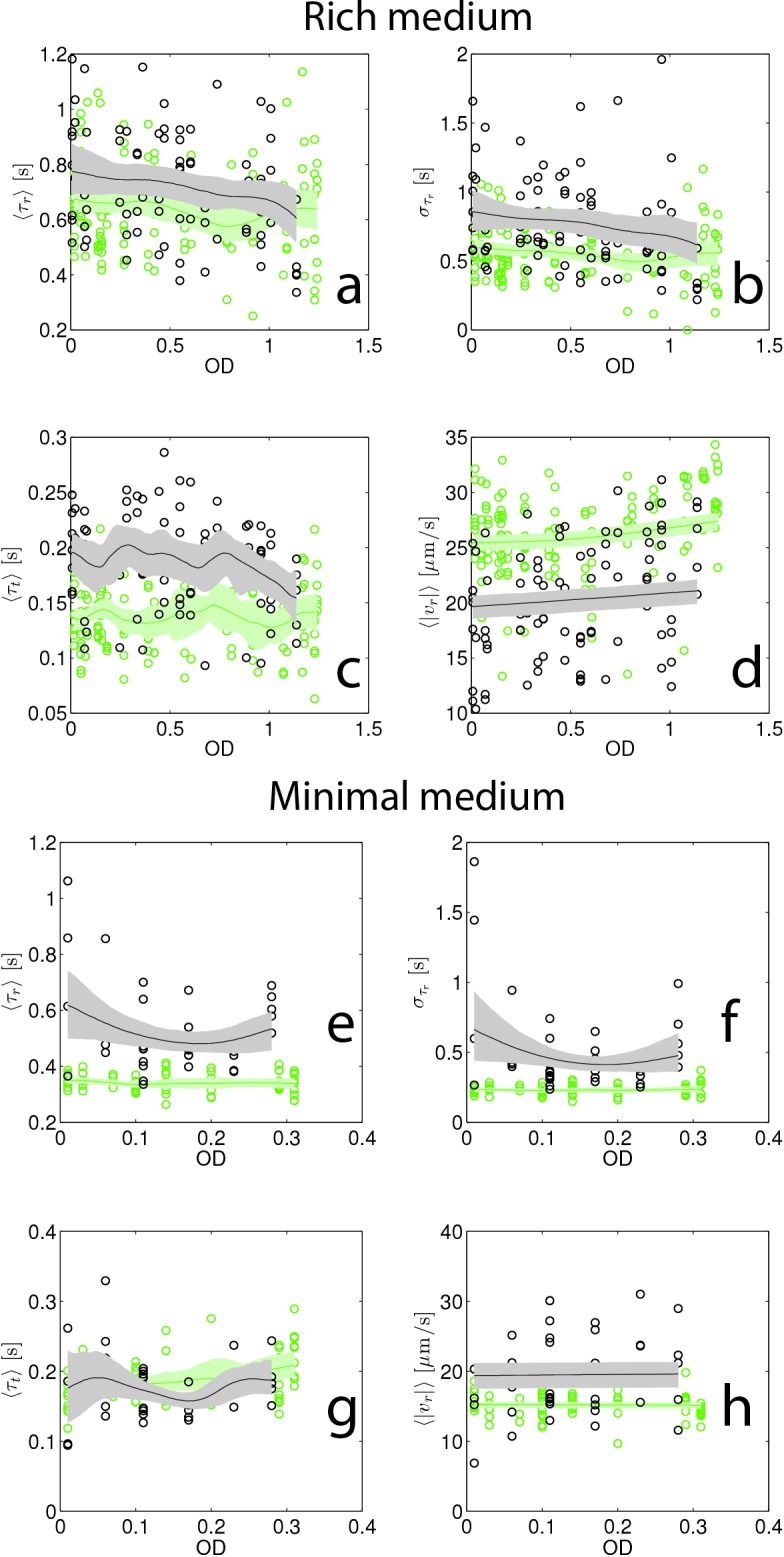
Figure 3—figure supplement 4.

(a–d) Show swimming statistics (τr, στr, τt and |vr|) as a function of culture optical density for rich medium founding (black) and evolved (green, round 15, replicate 1). Each point corresponds to a single individual tracked for up to 5 min. 141 individuals were tracked from founder and 96 individuals were tracked from round 15. Trend lines are from non-parametric kernel regressions and shaded regions represent 95% confidence intervals from bootstrapping. The shorter run duration in round 15 is apparent in the reduced στr relative to founder. (e–h) Show identical plots for minimal medium founding (black) strain (38 cells) and evolved (green, 64 cells, round 10 replicate 1).