Abstract
The visualization of lesion formation in real time is one potential benefit of carrying out radiofrequency ablation under magnetic resonance (MR) guidance in the treatment of atrial fibrillation. MR thermometry has the potential to detect such lesions. However, performing MR thermometry during cardiac radiofrequency ablation requires high temporal and spatial resolution and a high signal-to-noise ratio. In this study, a local MR coil (2-cm diameter) was developed to investigate the feasibility of performing limited field of view MR thermometry with high accuracy and speed. The local MR coil allowed high-resolution (1 × 1 × 3 mm3) image acquisitions in 76.3 ms with a field of view 64 × 32 mm2 during an open-chest animal experiment. This represents a 4-fold image acquisition acceleration and an 18-fold field of view reduction compared to that achieved using external MR coils. The signal sensitivity achieved using the local coil was over 20 times greater than that achievable using external coils with the same scan parameters. The local coil configuration provided fewer artifacts and sharper and more stable images. These results demonstrate that MR thermometry can be performed in the heart wall and that lesion formation can be observed during radiofrequency ablation procedures in a canine model.
Keywords: lesion visualization, MR thermometry, RF coil, cardiac arrhythmia, RF ablation
INTRODUCTION
One benefit of performing catheter ablation to treat atrial fibrillation (AF) under magnetic resonance (MR) guidance is the potential to visualize real-time lesion formation. MR temperature imaging (1–3) has the demonstrated ability to detect 1°C temperature changes with sampling rates of only a few seconds in tissues such as breast, brain, muscle, and uterus (4–8). In principle, MR thermometry could help determine the quality of lesions (place, size, depth, and extent of damage) created while radiofrequency (RF) ablation is performed in the heart and enhance the procedure outcome. A previous study (9) showed that temperature images could be acquired in the ventricle. However, each image was acquired over 10 s because of the large field of view (FOV) necessary to avoid aliasing and the low signal-to-noise ratio (SNR) provided by the external coil arrays used. These conditions are not adequate for clinical procedures where lesion formation needs to be observed and assessed in real time.
For RF ablations performed at high power (40–50 W) for a short time (7–15 s) during AF treatment (10,11), a temperature map should be acquired every cardiac cycle (approximately 1 image/s). Ideally, each image acquisition would be significantly shorter than the cardiac cycle, to minimize image artifacts due to cardiac and respiratory motion, especially when arrhythmia is present. Typical thicknesses of the left atrial (LA) and ventricular (LV) walls are 3–5 and 8–12 mm, respectively. Thus, the spatial resolution of the temperature maps should be at least 1–1.5 mm for atrial ablation and 2–3 mm for ventricular ablation. Furthermore, the spatial resolution of the temperature maps should be adequate to ensure complete ablation and that surrounding anatomical structures (the esophagus, etc.) are not affected by the ablation (12,13). The images also need sufficient SNR to achieve the desired temperature measurement accuracy (±2°C) within the region of interest (ROI).
A local RF coil, placed near the ablation site, could allow faster MR thermometry image acquisition on a smaller FOV with a higher signal sensitivity (increased SNR) compared to external coils. Although a small solenoid (14–18), a loopless design (19–21), or an active MR stent (22,23) are possible, a conductive loop (24–31) seemed the most appropriate to image cardiac RF ablation lesions. A loop coil would have to be folded into a catheter and inserted into the blood vessels before being deployed in the heart (25,30). However, whether such a coil could acquire images with the spatial and temporal resolution, SNR, and temperature accuracy needed to be clinically relevant remains to be demonstrated.
In this study, the feasibility and associated limitations of using such a local coil were investigated, including the assessment of attainable resolution, acquisition speed, phase stability, and temperature accuracy. The results will help to assess the potential for success of catheter-mounted intracardiac coils for real-time lesion visualization during clinical myocardial ablation procedures.
METHODS
Initial evaluations of our prototype coil were performed in phantoms to determine the coil 3D volume sensitivity profiles and associated SNR maps and to adjust and optimize pulse sequence parameters for temperature measurements. After phase image stability was assessed in a moving phantom, temperature studies were conducted in phantoms and in vivo. All MRI scans were done on either a TIM Trio or a Verio 3T MRI scanner (Siemens Healthcare, Erlangen, Germany). An RF generator system (Stockert 70, Stockert GmbH, Freiburg, Germany) was used to deliver power for the RF ablations via a novel, 9Fr, MR-compatible, irrigated, temperature sensing, mapping, and ablation catheter (MRI Interventions, Inc., Irvine, CA). The catheter thermoregulator was set to dynamically adjust the catheter power to keep the catheter tip temperature at a maximum of 65°C. The catheter was irrigated with saline solution only in vivo.
RF Coil Construction and Evaluation
The coil was designed as a receive-only 2-cm diameter circular loop to fit the typical LA chamber of AF patients and animal models (Fig. 1a) (32). This diameter is comparable to cryoablation balloons (23 and 28 mm, Artic Front, Medtronic) and Lasso mapping catheters (12–35 mm, BiosenseWebster) used for the treatment of AF. The inductive loop of the coil was formed with a 26-AWG (American Wire Gauge) tinned and insulated copper wire because of its availability, ease of construction, and minimal susceptibility artifact close to the coil. Capacitor components were placed away from the loop to minimize phase variation patterns associated with capacitors in the loop (33). The loop was closed by twisting the wire at the coil input for greater mechanical stability (Fig. 1c). A 24-cm length (~λ/10) microcoaxial cable connected the RF coil to the receiver circuit board that included a cable trap to minimize common-mode currents on the cable (34), and a phase shifter to maintain λ/2 phase shift between the coil and the low input impedance preamplifier (35). The coil characteristics including resonance frequency, quality factor, and the active decoupling circuit effectiveness, were assessed in several imaging experiments using both phantoms and live animals.
FIG. 1.
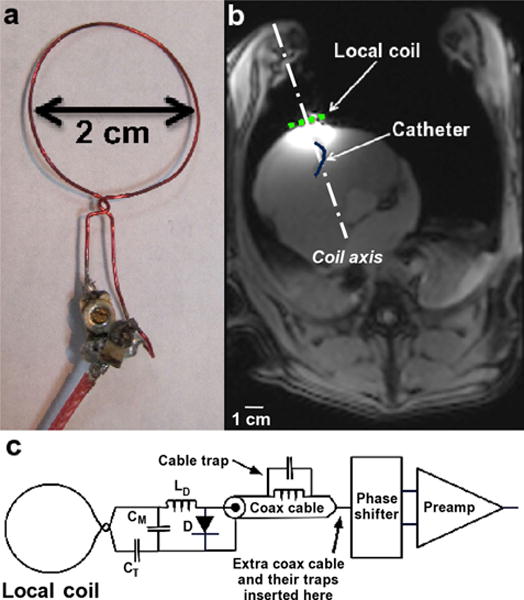
Coil and in vivo study setup. a: Coil design used for the entire study; b: axial MR image from an open-chest animal study acquired with the local coil, the spine coil array, and the custom-made torso array combined. The light dotted line represents the coil location on the heart surface, and the dark solid line represents the catheter within the RV; and c: circuit diagram of the coil circuit layout. [Color figure can be viewed in the online issue, which is available at wileyonlinelibrary.com.]
Moving Phantom Studies
The benefits of the coil for fast image acquisition and phase signal consistency were tested on a moving phantom. Images were obtained with the small FOV that would be used for the local cardiac loop (limited FOV) and the large FOV required by the external array coils (large FOV), respectively. However, only the local coil was used for these studies to keep the coil sensitivity over the ROI the same for both FOVs.
The phantom consisted of a stack of two pieces of pork muscle meat with the coil placed between them (Fig. 2a). To mimic in vivo conditions, this phantom was positioned on top of an air bladder that was manually inflated and deflated with a frequency of approximately 1 Hz. The air bladder created a vertical-only continuous phantom translation along the coil axis, with a displacement of 0.5–0.75 cm.
FIG. 2.
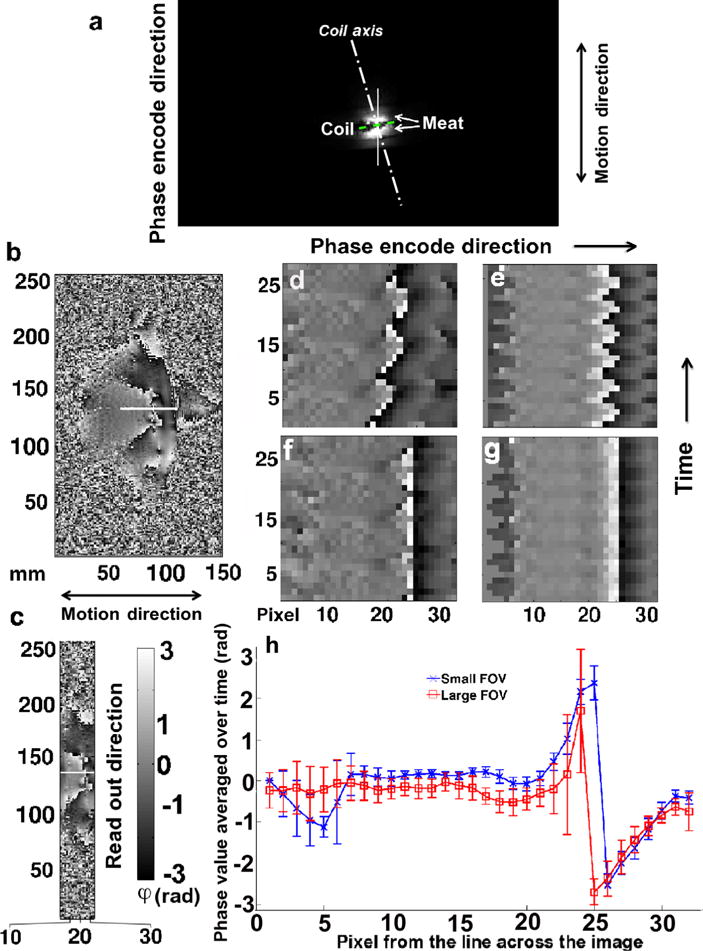
Moving phantom image analysis. Images acquired with the local coil. a: Large FOV magnitude image indicating the experiment setup with the coil (dashed line) positioned in between two pieces of meat (bright signal); phase image over the large (b) and limited (c) FOV at time point t = 15 without gating; (d) and (e) display the phase signal of the same phase encode step (row) over consecutive time frames (column), acquired across the white line in (a), (b), and (c), respectively; (f) and (g) display the same phase signal as in (d) and (e), respectively, but after a manual correction was applied to compensate for the imperfection of the moving phantom; and h: phase values averaged over time along the white solid lines for both the large and the limited FOV and their corresponding standard deviation. The sharp change in phase signal value around pixel 25 is due to the interface of the two pieces of meat. [Color figure can be viewed in the online issue, which is available at wileyonlinelibrary.com.]
A 2D spoiled gradient echo (GRE) sequence was used to image this phantom with the following parameters: pulse repetition time/echo time/flip angle = 9.9 ms/6.0 ms/12°, pixel size = 1 × 1 mm2, slice thickness = 3 mm, partial (0.75) Fourier acquisition in the phase-encoding direction, and bandwidth = 300 Hz/pixel. The limited and large FOVs were 256 × 32 and 256 × 152 mm2, respectively. No gating or interimage delay was used to acquire both image series. The acquisition time per image was 240 ms for the small FOV and 1130 ms for the large FOV. To acquire 30 image frames required a total scan time of 7.2 s for the small FOV and 33.9 s for the large FOV. The phase encode direction was set along the coil axis (phantom motion direction) to enhance motion artifacts and better demonstrate the differences between the limited and large FOV imaging results.
Both data sets were evaluated for motion artifacts over the 30 frames. Thirty-two pixels along the coil axis, corresponding to the region where ablation might occur, were extracted from each frame. The individual lines of phase data were compiled into a single image (30 time frames × 32 pixels) to show the phantom motion and phase variations as a function of time. As the volume of air pumped into the bladder each cycle was variable, and the phantom motion was not synchronized with the acquisition, uneven translation effects could be observed in the images. The position variations were manually corrected to align the phase signal from the different frames with one another prior to analyzing the data. The alignment was made on the sharp phase change occurring at the interface of the two pieces of meat. On the assumption that the columns of corrected data images represented the same voxel over time, the average and standard deviation of the phase signal for each pixel over time (30 measurements) along the selected line was determined and plotted for both the small and the large FOV.
MR Temperature Measurement Acquisition and Processing Techniques
For both phantoms (agar and meat) and in vivo experiments, the temperature images were acquired with a segmented echo-planar imaging (segmented EPI) proton resonance frequency (PRF) shift sequence. The temperature maps and temperature evolution graphs were generated using either the Referenced or the Referenceless MR thermometry methods (2,36).
The segmented EPI PRF scan parameters were: pulse repetition time/echo time/flip angle = 10.9 ms/6.0 ms/15°, echotrain = 5, in-plane resolution = 1 × 1 mm2, slice thickness = 3 mm, and bandwidth = 930 Hz/pixel with seven consecutive shots per image. The limited FOV used was 64 × 32 mm2. For these studies, the phase encode direction was set perpendicular to the coil axis to minimize motion artifacts. During the in vivo experiments, prospective cardiac triggering was used, and one image was acquired every heartbeat with a scan time of 76.3 ms. Up to 120 image frames were acquired for each ablation (between 15- and 30-s long) with up to 15 W of delivered ablation power. Up to 25 frames were acquired prior to the start of ablation to allow for reference-based temperature calculations. Additional frames were also acquired after the ablation ended to measure the sample cooling profile.
While digital imaging and communications in medicine (DICOM) phase images were displayed in real time on the scanner console, raw k-space data were processed offline with an in-house MATLAB program (Version 7.9; Mathworks, Inc., Natick, MA) to reconstruct the images and generate the corresponding temperature maps. Image interpolation by a factor of 4 in both directions using k-space zero-filling was performed to reduce partial volume effect. Temperature maps were generated from the phase of the complex difference between subsequent frames to eliminate phase wraparound that can occur if the absolute value of the phase signal extends beyond the interval [−π, π] during the reconstruction processes.
Temperature values and variations were determined using the relationship between the MR signal phase and temperature (37):
where γ is the gyromagnetic ratio (42.576 MHz/T), B0 the main magnetic field strength (3 T), Δϕ the phase difference between the phase image during heating and the reference frame (Referenced method) or reference ROI (Referenceless method), and α the temperature-dependent water proton chemical shift coefficient (= −0.01 ppm/°C). The temperature measurements calculated using the Referenced method were based on a single reference image, averaged from all the images acquired prior to the ablation. The temperature measurements calculated using the Referenceless method were based on a background phase determined from a least-squares polynomial fit to a manually defined custom mask (2) directly surrounding the heating region. The temperature in this region was considered stable during the entire ablation. The fit was calculated for each frame acquired during ablation using the polynomial functions determined on an image acquired prior to the ablation and extrapolated to the heating region. Temperature evolution graphs were plotted for single pixels.
Phantom Temperature Measurement Accuracy Studies
Two different types of accuracy studies were conducted on nonperfused phantoms. The first experiments (Fig. 3a) assessed the feasibility of MR thermometry measurements during RF ablation procedures in a small custom-made agar phantom containing sucrose and sodium chloride (35.8 g/L) and simulating a heart. The temperature measurements determined using both the Reference and the Referenceless methods were compared to each other.
FIG. 3.
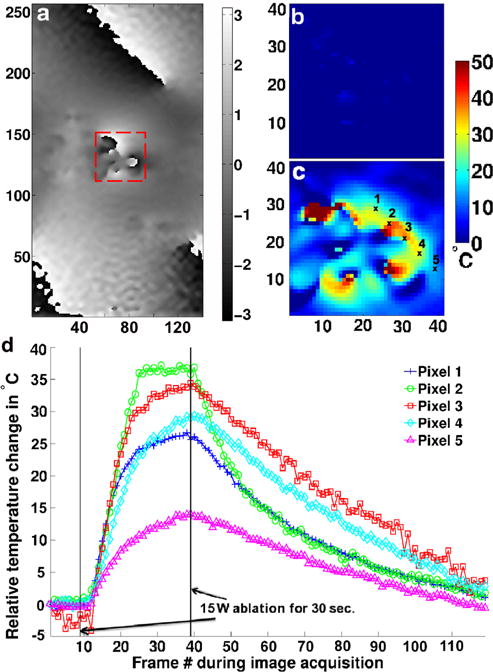
Limited FOV temperature measurement in a stationary agar phantom. a: Reference phase image in the plane centered at the catheter tip and perpendicular to the catheter shaft direction; temperature maps prior to the start of RF ablation (b) and at the end of the ablation (c) over the dashed line box in (a) using the Referenced calculation method; d: single pixel temperature evolution plots for five different pixels indicated in (c) before, during, and after ablation using the Referenced calculation method. To avoid any correlation caused by the zero-filling interpolation, the measurements are spaced every four pixels. [Color figure can be viewed in the online issue, which is available at wileyonlinelibrary.com.]
The second experiments tested the accuracy of the MR temperature measurements during ablation on a meat phantom (Fig. 4b). Two MR compatible fiber optic probes (Opsens, Quebec City, Quebec, Canada) were placed: (1) at the ablation position as close to the catheter tip as possible and (2) approximately 1 cm away from the catheter tip, a distance representing the edge of a standard lesion. A series of high-resolution 3D GRE images was acquired to locate each probe tip. The MR temperature measurements were obtained using the Reference method and compared with the fiber optic probe recordings.
FIG. 4.
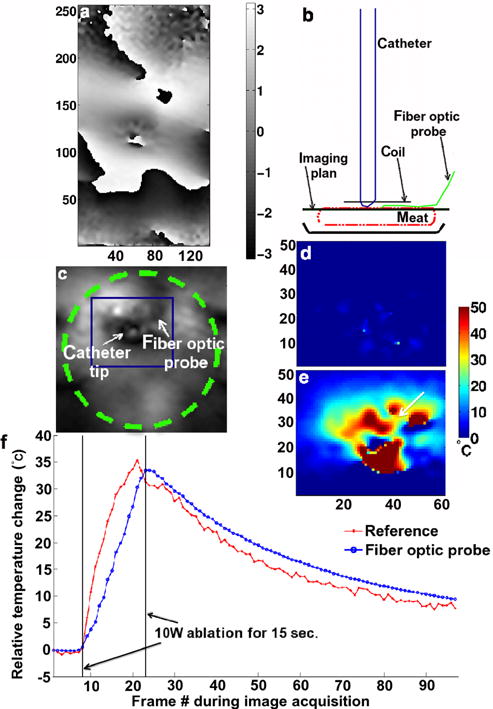
Limited FOV temperature measurements in a stationary meat phantom. a: Reference phase image obtained with the segmented echo-planar imaging sequence in the plane perpendicular to the catheter shaft and centered at the catheter tip; b: schematic of the experimental setup and image plane selection; c: magnified magnitude image. The dashed line circle in (c) represents the local coil. The dark square in (c) indicates where the temperature maps in (d) and (e) were derived. Magnified temperature maps, in the same orientation as in (c), determined using the Referenced calculation method prior to the start of the RF ablation (d) and at the end of the RF ablation (e); f: temperature evolution over time in one pixel in the ablation lesion next to the fiber optic probe [1 mm, arrow tip in (e)] using the Referenced MR thermometry methods and the fiber optic temperature relative recordings. The large fluctuations between the pixels in the near field of the catheter tip are the results of magnetic susceptibility artifact. [Color figure can be viewed in the online issue, which is available at wileyonlinelibrary.com.]
In Vivo SNR Tests
The SNR tests were performed in vivo on open-chest dog models as the size and inflexibility of the coil did not allow insertion into the heart through the blood vessels (25,30). All animal experiments were performed with approval from the local Institution Animal Care and Use Committee. The studies were conducted on blue hound dogs (n = 3), as the dog anatomy is comparable to humans and the animals were stable for open-chest studies. The mean animal weight was 21.2 (±0.7) kg. Preparation and MR measurements were completed under general anesthesia induced and maintained by intravenous injection of sodium pentobarbital. Surgical cutdowns were performed for intravenous access for the ablation catheter. The animal vital signs were monitored continuously with a Veris MR vital signs monitor (Medrad, Inc., Warendale, PA). Blood pressure was kept in the range of 160–120/50–80 mmHg at heart rates between 70 and 80 beats/min. The body internal temperature was kept at approximately 36°C. A ventilator maintained the animal respiration rate between 10 and 15 breaths/min.
The local coil was attached to a low-density open-cell piece of foam mounted at the end of a rigid articulated positioning arm. The foamed arm kept the coil against the outer surface of the right ventricle (RV) through the open chest with little to no pressure on the heart wall. The coil could follow the beating heart motion without restraining its rhythm (Fig. 1b), with a range of motion estimated to be no more than 5 mm. The coil was wrapped in plastic (Parafilm, Pechiney Plastic Packaging Company, Chicago, IL) to keep it from getting wet and losing its performance characteristics. Extra coaxial cables of 24-cm length (RG-316, Thermal wire and cable, LLC, Naples, FL) with cable traps were added to the coil circuit to keep the preamplifier circuit away from the open chest. For MR measurements, the animal was placed supine head first on the MR patient table.
Magnitude images were acquired with an SNR-specific spoiled GRE sequence (38) to evaluate the performance and sensitivity gains achieved with the local coil in situ. SNR maps and corresponding profiles were generated for the local coil and compared to the SNR measured for the external coils currently used in developmental myocardial ablation procedures (39). Two different chest phased array coils were used and combined with a spine phased array coil (Siemens Healthcare, Erlangen, Germany). The first array consisted of a six-channel torso coil (Siemens Healthcare, Erlangen, Germany). The second was an eight-channel custom-made torso coil comprising two bilateral four-channel arrays placed on each side of the animal’s chest. The imaging parameters used for the SNR measurements were: pulse repetition time/echo time/flip angle = 87.6 ms/3.6 ms/10°, pixel size =1 × 1 mm2, slice thickness = 3 mm, bandwidth= 200 Hz/pixel, and FOV = 192 × 192 mm2. The images were acquired with cardiac gating and suspended respiration. The phase encode direction was set perpendicular to the coil axis to minimize motion artifacts. To minimize motion artifacts in the images cardiac gating was optimized first. A cine imaging sequence was performed prior to ablation to find the stationary phase of the cardiac cycle in the ROI and the corresponding value for the delay after the R wave of the surface electrocardiogram signal. Intermittent breath-hold, achieved by turning the ventilator off, was used to minimize motion artifacts in the images.
In Vivo Temperature Measurement Stability Studies
Rapid image acquisition (76–250 ms) was optimized along with the cardiac gating to further minimize motion artifacts in the images. For temperature measurement stability, up to 25 frames were acquired without RF ablation using the segmented EPI PRF sequence. The temporal standard deviation of the phase and temperature images using the local coil was compared to similar images acquired using the external coils.
In Vivo Temperature Studies
Using the setup described in the SNR tests and Temperature stability studies, in vivo temperature measurements were performed during ablation (40). Thirty-watt RF power was delivered for up to 30 s. The image datasets acquired included up to 100 frames, consisting of up to 25 prior to the start of the ablation and more than 30 after the ablation had ended to measure the tissue cooling profile.
At the end of each animal study, the heart was excised, filled with alginate to maintain its natural shape and placed in a saline bath. A high-resolution 3D GRE sequence and a wrist coil (USA Instruments, Inc., Aurora, OH) were used to image the entire heart and assess the ablation lesions with the parameters: pulse repetition time/echo time/flip angle = 17 ms/6 ms/15°, voxel size = 1 × 1 × 1 mm3, and bandwidth = 592 Hz/pixel.
RESULTS
RF Coil Construction and Evaluation
The local coil was tuned and matched for the heart wall at 123.23 MHz (3 T). The maximum return loss was −20 dB, when the coil was loaded. The coil resonance frequency did not change significantly with cardiac and respiratory motion. The match variations were cyclic, but minimal. The coil active detuning was set to a maximum of −20 dB to properly decouple the local coil from the other coils (body, spine, and torso) used during the experiments. The quality factor (Q) of the loaded coil was 36 ± 5 and 45 ± 3 when unloaded.
Moving Phantom Studies
Imaging results using the local coil while the meat phantom was in motion are shown in Figure 2. Phase images from the large FOV are shown in Figure 2b and those from the small FOV in Figure 2c. The time evolution of the phase signal from a single line of pixels along the phase encode direction in the middle of the coil is presented in Figure 2d (large FOV) and 2e (small FOV) without any motion correction and in Figure 2f (large FOV) and 2g (small FOV) after manual motion correction was applied. Figure 2h displays the average and standard deviation of the phase signal from the same line of pixel data (32 pixels), over time, for both the large and the small FOV acquisition. The sharp change in phase at pixel 25 reflects the discontinuity between the two pieces of meat forming the phantom. The frames presented in Figure 2 show that the data acquired with the larger FOV are not as consistent as the data acquired with the smaller FOV, though the local coil was used for both acquisitions. The standard deviation of the signal obtained using the large FOV is approximately 1.75 times the standard deviation of the signal obtained using the small FOV over what appears to be the most stable part of the image acquisition. Pixels 7–21 in the phase encode direction indicate where the catheter would be located during an MR-guided RF ablation with the local coil placed between pixels 23 and 26. The local coil and its limited FOV allowed faster image acquisition (<1 s) resulting in less artifact and sharper and more stable image quality.
Phantom Temperature Measurement Accuracy Studies
Figure 3 illustrates the use of the Referenced MR thermometry method for a static agar phantom when no fiber optic probe was present. A reference phase image is presented in Figure 3a, whereas a magnified portion of a temperature map frame prior to the start of the RF ablation is presented in Figure 3b, and a map generated using the Referenced method and taken at the end of the ablation in Figure 3c. The temperature evolution plots are displayed in Figure 3d. The plot demonstrates that the temperatures can be determined using the Referenced MR thermometry method. Referenceless method could not be used because of the large catheter susceptibility artifact present in the images. A maximum temperature increase of 36.9°C was observed during the 30 s, 15 W ablation (Fig. 3c) for pixel 3.
Results from the MR thermometry accuracy studies in a stationary meat phantom are displayed in Figure 4. While a reference phase image is presented in Figure 4a, arrows indicate the relative location of the catheter tip to the fiber optic probe on the magnitude image in Figure 4c. A temperature map frame generated using the Referenced method is shown in Figure 4e and a background map in Figure 4d. The corresponding temperature evolution plot from 1 pixel close to the fiber optic probe is indicated in Figure 4f along with the fiber optic probe recording. A maximum temperature increase of 35.3°C was observed at the center of the ablation formed during a 15 s, 10 W ablation. This temperature increase was obtained from both the Referenced temperature measurements and the fiber optic probe. On average, the MR temperature measurements were within 8% of the fiber-optic-probe readings.
In Vivo SNR Tests
In vivo coil sensitivity results are presented in Figure 5. The 2-cm diameter coil provided high SNR over an ROI in tissue, close to the coil (Fig. 5f), and very weak signal sensitivity away from the coil (32). The sensitivity region of this local coil, over 2 × 2 cm2 (Fig. 5a,d), was larger than a typical RF ablation lesion (0.5–1 cm in diameter and 3- to 5-mm deep assuming that the catheter tip is in contact with the cardiac wall). However, it was significantly smaller than the sensitivity region of the external coils (Fig. 5b,c) giving adequate coverage for ablation purposes over limited FOV images (64 × 32 mm2) with minimum aliasing (Fig. 5a). These results demonstrated that MR thermometry in the heart wall could be acquired four times faster with the small FOV of the local coil than images acquired at the larger FOV (192 × 192 mm2, a factor of 18 larger than the small FOV) required for nonaliased imaging using the external coils. The SNR map and profile comparisons (Fig. 5e,f) between the local coil and the external coil combination in two different orientations, perpendicular to and parallel with the local coil axis, indicate that the local coil had significantly higher signal sensitivity (>factor of 20) for identical in vivo imaging acquisition parameters. These plots demonstrate that the SNR of the local coil is much greater than the SNR of external coils over at least a 20-mm radius from the center of the local coil for the high-resolution (1 × 1 × 3 mm3) scan. The sharp signal drop observed on both graphs is due to air present next to the heart because of the open-chest conditions.
FIG. 5.
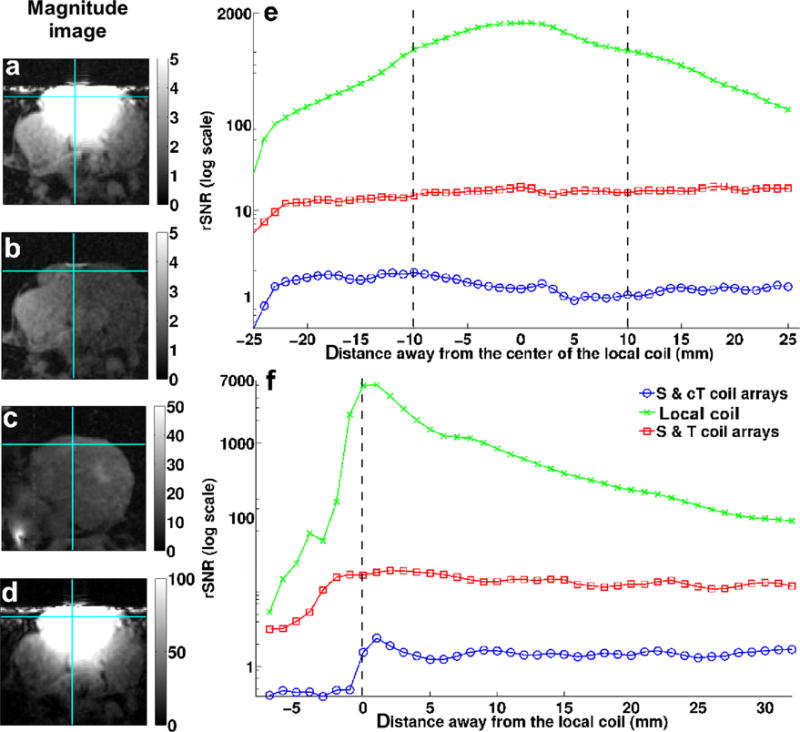
In vivo SNR map and profiles from an axial view. Magnified images acquired using: (a) the spine coil, the custom-made torso array, and the local coil; (b) the spine and custom-made torso arrays (S & cT); (c) the spine and torso coil arrays (S & T); and (d) the local coil; SNR profiles through the images (b), (c), and (d) along the horizontal solid line (e) and along the vertical solid line (f). The black vertical dash lines represent the coil’s location on both (e) and (f). The original FOV for these images was 192 × 192 mm2. [Color figure can be viewed in the online issue, which is available at wileyonlinelibrary.com.]
In Vivo Temperature Measurement Studies
The in vivo temperature stability measurements, performed without any heating, are shown in Figure 6. The temperature accuracy was better than 1°C within a distance of 5 mm from the coil, about the thickness of the RV wall, when the local coil was used with the limited FOV (Fig. 6b). Measurement error is minimal close to the coil and increased with distance from the coil. These changes in stability were mainly caused by physiological noise such as residual heart motion and blood flow. Acquisitions using only the external coils required the FOV to be increased to 200 × 200 mm2 to limit aliasing requiring an increase in acquisition time from 76 to 250 ms. To increase the external coil SNR, the large FOV image resolution was also decreased from 1 × 1 × 3 to 1.6 × 1.6 × 3 mm3. The temperature accuracy for this coil/resolution configuration was at best 2°C over the entire image (Fig. 6c). No useful temperature map could be generated with this suboptimal configuration.
FIG. 6.
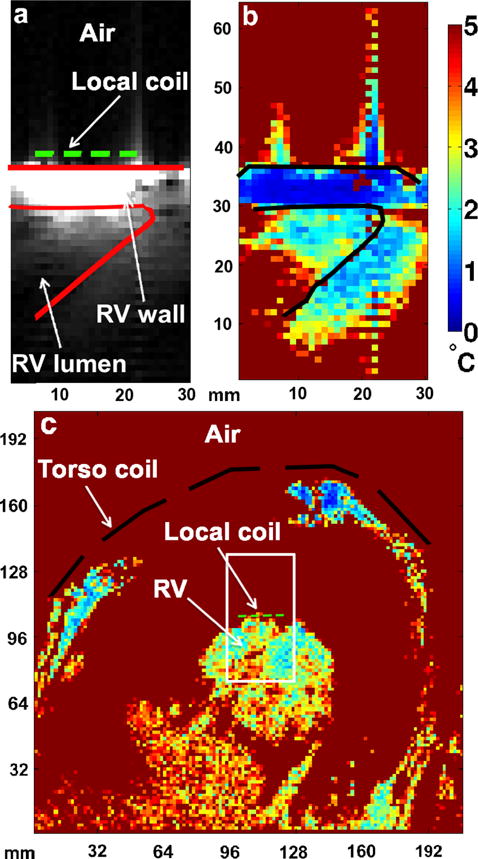
Temperature accuracy maps in vivo. a: Magnitude image of the RV depicting the anatomy of the ROI acquired using the local coil in a beating heart; corresponding temperature accuracy maps determined from the phase images acquired using (b) the local coil and (c) the external coils (spine and torso coil arrays) during a dog open-chest experiment. The short-dashed line represents the local coil and the long-dashed line represents the torso coil (c). The spine coil was located outside of the FOV. The solid lines in (a) and (b) define the bottom of the RV where the catheter was placed. The white box in (c) represents the limited FOV used to acquire the images in (a). The resolution of the map in (c) was 1.6 × 1.6 × 3 mm3, whereas the resolution of the maps in (b) was 1 × 1 × 3 mm3. [Color figure can be viewed in the online issue, which is available at wileyonlinelibrary.com.]
Results from the in vivo MR thermometry studies in the RV wall performed using the local coil are illustrated in Figure 7. The local coil location and the limited FOV frame are displayed in Figure 7a. The magnified temperature images (Fig. 7e–g) are indicated by a dashed line square on the limited FOV magnitude image in Figure 7b. The mask used in the Referenceless method is shown in Figure 7d. The background temperature map (reference t =0) prior to the start of ablation is shown in Figure 7e. Figure 7f,g shows the temperature maps at the end of the ablation (t =29 s) and were calculated with the Referenced and Referenceless MR thermometry methods, respectively. Figure 7h displays the temperature evolution graphs created from the temperature maps presented in Figure 7f,g, over a single pixel located 5 mm from the catheter tip and indicated by a white arrow. Both methods give similar results. The curves are within 6.7% of each other on average with a maximum difference of 19% or 5.7°C occurring when no breath-hold was applied. A maximum temperature increase of 31°C was observed at the center of a lesion formed during an ablation of 30 W during 29 s, which was in correlation with the ablation catheter thermistor recording (within 10%). Figure 8 shows the ex vivo MR images of the lesion created during ablation at the bottom of the RV (Fig. 8a,b) as well as a photograph of the cross-section of this lesion (Fig. 8c).
FIG. 7.
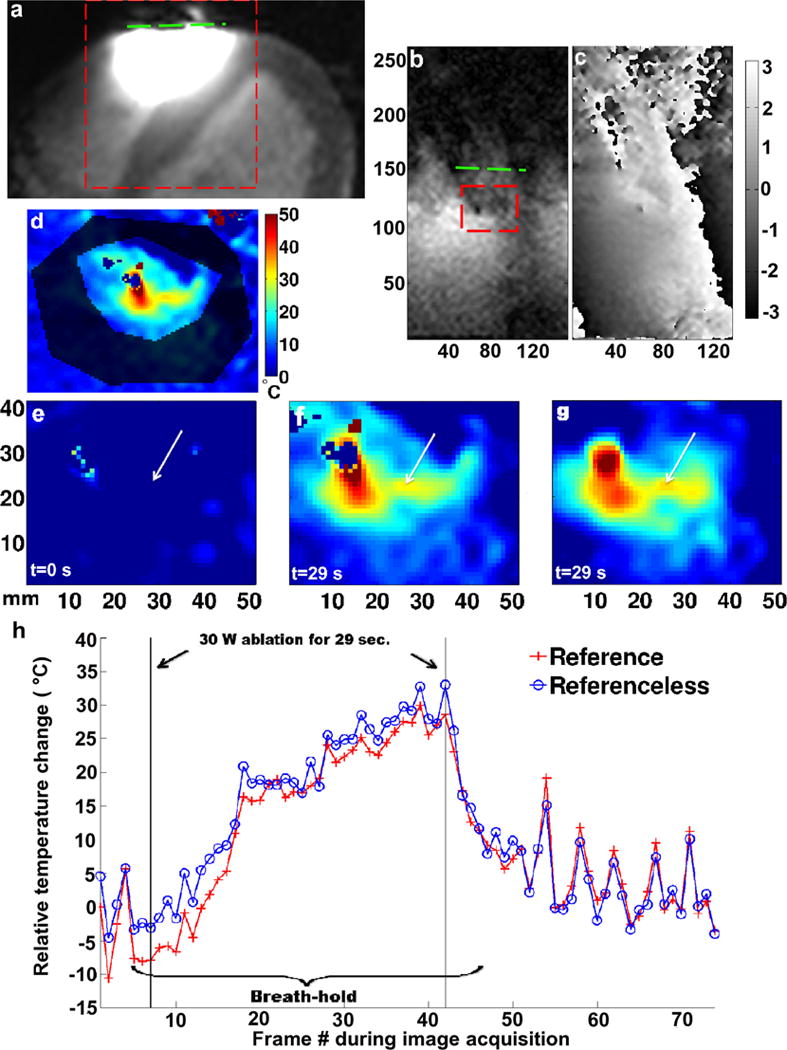
In vivo limited FOV temperature measurements in the RV wall of a dog beneath the local coil and near the catheter tip. a: Magnified large FOV magnitude image of the heart indicating the local coil location (dashed line); limited FOV magnitude image (b) and corresponding reference phase image (c) of the ROI where the ablation took place [dashed line box in (a)]; d: mask used to generate the Referenceless temperature maps; temperature maps over the dashed line box in (b), before (e) and at the end of the RF ablation using the Referenced (f), and the Referenceless (g) method; h: temperature evolution over time of a single representative pixel at the position of the arrow tip in (e), (f), and (g), at the center of the ablation using both processing methods. The colorbar of (d) also applies to (e), (f), and (g). [Color figure can be viewed in the online issue, which is available at wileyonlinelibrary.com.]
FIG. 8.
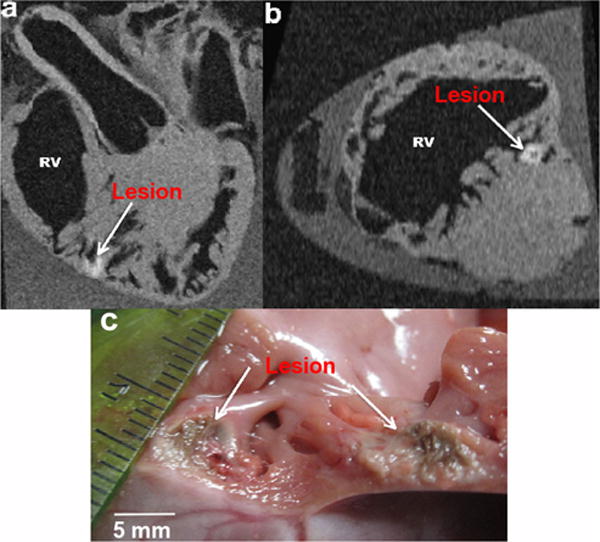
Analysis of excised heart from open-chest animal study. Ex vivo high-resolution GRE image showing the lesion created while ablating and monitoring the temperature changes indicating the change in tissue properties due to the ablation heat. a: Long axis; b: short axis; and c: gross pathology photograph of a cut through cross-section of the same lesion. The lesion was deep inside the trabecular portion of the myocardial wall at the apex where the catheter was placed. [Color figure can be viewed in the online issue, which is available at wileyonlinelibrary.com.]
DISCUSSION
In this study, we assessed the ability to visualize real-time RF ablation lesion formation in live cardiac tissue using MR thermometry and a local coil placed directly on the heart surface. We demonstrated that a small RF coil located near the myocardium surface could provide the image acquisition speed and temperature measurement accuracy needed to clinically monitor and control RF ablation within a small FOV in the RV. Although this study was performed on the RV, the coil size and imaging techniques could be applied to monitor temperature in the left atrium. The substantial advantages of the local coil over external coils include the following: (1) the coil is more spatially selective without the use of spatially selective RF pulses because of its small size; (2) the coil SNR is significantly higher than the SNR of the external coils because of its close proximity to the sample; (3) the coil allows for faster reduced FOV image acquisition without aliasing, resulting in reduced artifact from cardiac and respiratory motion. Taken together, these three characteristics allow for accurate temperature measurements in the myocardium wall and show the potential to visualize lesions as they form in real time.
The available SNR is of primary concern when obtaining information from a small ROI. The SNR obtained from the local coil in this study was always more than a factor of 20 greater than the SNR obtained from the external coils (Fig. 5). The high sensitivity of the local coil within the ROI allowed the temperature changes to be recorded with an accuracy of 1°C within the ventricle wall. Figure 6b shows that 1°C accuracy could not be achieved at the desired spatial resolution with external coils. This can be explained by the low signal sensitivity of the external coils at the ablation location (Fig. 5) and the extra noise acquired with the large coil-sensitive volume. The external coils also required longer acquisition times, which resulted in more cardiac motion and blood flow image artifact.
The near-field effects of a small coil were minimal due to the small size of the copper wire used to build the coil as well as the distance between the coil and the lesion location (3–7 mm). The catheter tip caused the biggest artifact in the images. The spatial variation in temperature observed in the agar phantom (Fig. 3) is likely caused by the susceptibility of catheter tip present in the images and its changes with temperature, because the catheter tip was not irrigated during phantom studies. In the meat phantom, the spatial variation in temperature (Fig. 4) can be explained by susceptibility changes as in Figure 3 and by the presence of air and fat in the meat. The strong susceptibility artifacts and sharp phase changes present in the images (Fig. 3) limited the use of the Referenceless method for temperature calculations.
The Referenced and Referenceless temperature measurement methods proved feasible for in vivo cardiac ablation with cardiac gating and breath-holds. Cooling from catheter tip irrigation and flowing blood in vivo reduced the temperature-dependent catheter susceptibility changes. The artifacts seen in Figures 3a and 4a were not observed in Figure 7c. The image interpolation performed on in vivo data shows the smooth temperature changes in the lesion being formed, and Referenced and Referenceless methods give similar results. However, differences in the temperature maps generated using the two different methods occurred due to suboptimal cardiac gating during the image acquisition, though the Referenceless method was less sensitive to respiration motion than the Reference method (Fig. 7).
Only cardiac gating and breath-hold were used to acquire the in vivo images in these studies. No systematic or automatic motion compensation or registration was applied to any dataset. The multibaseline method (3,41) was not used when applying the Referenced method to determine the temperature change. No navigator was used to detect respiratory motion during image acquisition, which increased the misregistration of images perpendicular to the catheter tip. The implementation of a navigator in the pulse sequence could enhance the two MR thermometry methods (3,41). For the Referenceless method, the MR thermometry images generated might be enhanced by assessing the catheter susceptibility characteristics and changes with temperature, modeling them, and incorporating them in a polynomial fit would help this implementation (42).
It is worth noting that the temperature maps presented here were generated offline, as the temperature calculation was not implemented in the acquisition software. Despite the delay in observing temperature change in tissue, the phase images demonstrated a definite change in real time. Integration of the postprocessing methods with the acquisition software would enable real-time temperature map generation.
CONCLUSIONS
This work has shown that the combination of characteristics unique to the local coil enables the acquisition of rapid, stable, and accurate high-resolution temperature maps from the cardiac wall of a beating heart. The temperature maps can be used for real-time monitoring and visualization of lesion formation during RF ablation procedures. This capability may allow for the characterization of heart wall tissue damage and aid with the prediction of the outcome effectiveness following the cardiac ablation procedures.
The results of this work validate the usefulness of temperature mapping on the heart for the purposes of lesion visualization and justify the pursuit of catheter deployable coils that could be inserted into the heart via the superior vena cava to perform MR thermometry noninvasively during RF ablation procedures.
Acknowledgments
The authors thank Joshua J. Blauer, Jose Reyes, Gene H. Payne, Sathya Vijayakumar, Koji Higuchi, and Mehmet Akkaya for their technical assistance during the animal open-chest experiments and Rob S. MacLeod, Nicholas E. Todd, and Ravi Ranjan for their helpful discussions.
Grant sponsors: University of Utah Seed Grant 2011, The Ben B. and Iris M. Margolis Foundation, MRI Interventions, Inc., and Siemens Healthcare.
References
- 1.Dennis de Senneville B, Quesson B, Moonen CTW. Magnetic resonance temperature imaging. Int J Hyperthermia. 2005;21:515–531. doi: 10.1080/02656730500133785. [DOI] [PubMed] [Google Scholar]
- 2.Rieke V, Vigen KK, Sommer G, Daniel BL, Pauly JM, Butts K. Referenceless PRF shift thermometry. Magn Reson Med. 2004;51:1223–1231. doi: 10.1002/mrm.20090. [DOI] [PubMed] [Google Scholar]
- 3.Grissom WA, Rieke V, Holbrook AB, Medan Y, Lustig M, Santos J, McConnell MV, Pauly KB. Hybrid referenceless and multibaseline substraction MR thermometry for monitoring thermal therapies in moving organs. Med Phys. 2010;37:5014–5026. doi: 10.1118/1.3475943. [DOI] [PMC free article] [PubMed] [Google Scholar]
- 4.MacFall JR, Prescott DM, Charles HC, Samulski TV. 1H MRI phase thermometry in vivo in canine brain, muscle, and tumor tissue. Med Phys. 1996;23:1775–1782. doi: 10.1118/1.597760. [DOI] [PubMed] [Google Scholar]
- 5.Quesson B, Laurent C, Maclair G, Dennis de Senneville B, Mougenot C, Ries M, Carteret T, Rullier A, Moonen CTW. Real-time volumetric MRI thermometry of focused ultrasound ablation in vivo: a feasibility study in pig liver and kidney. NMR Biomed. 2011;24:145–153. doi: 10.1002/nbm.1563. [DOI] [PubMed] [Google Scholar]
- 6.McDannold N, Tempany CM, Fennessy FM, So MJ, Rybicki FJ, Stewart EA, Jolesz FA, Hynynen K. Uterine leiomyomas: MR imaging-based thermometry and thermal dosimetry during focused ultrasound thermal ablation. Radiology. 2006;240:263–272. doi: 10.1148/radiol.2401050717. [DOI] [PMC free article] [PubMed] [Google Scholar]
- 7.Huber PE, Jenne JW, Rastert R, Simiantonakis I, Sinn H-P, Strittmatter H-J, von Fournier D, Wannenmacher MF, Debus J. A new noninvasive approach in breast cancer therapy using magnetic resonance imaging-guided focused ultrasound surgery. Cancer Res. 2001;61:8441–8447. [PubMed] [Google Scholar]
- 8.McDannold N, Clement GT, Black P, Jolesz FA, Hynynen K. Transcranial magnetic resonance imaging-guided focused ultrasound surgery of brain tumors: initial findings in 3 patients. Neurosurgery. 2010;66:323–332. doi: 10.1227/01.NEU.0000360379.95800.2F. [DOI] [PMC free article] [PubMed] [Google Scholar]
- 9.Kolandaivelu A, Zviman MM, Castro V, Lardo AC, Berger RD, Halperin HR. Non-invasive assessment of tissue heating during cardiac radiofreqeuncy ablation using MRI thermography. Circ Arrhythmia Electrophysiol. 2010;3:521–529. doi: 10.1161/CIRCEP.110.942433. [DOI] [PMC free article] [PubMed] [Google Scholar]
- 10.Verma A, Marrouche NF, Natale A. Pulmonary vein antrum isolation: intracardiac echocardiography-guided technique. J Cardiovasc Electrophysiol. 2004;15:1335–1340. doi: 10.1046/j.1540-8167.2004.04428.x. [DOI] [PubMed] [Google Scholar]
- 11.Marrouche NF, Guenther J, Segerson NM, et al. Randomized comparison between open irrigation technology and intracardiac-echo-guided energy delivery for pulmonary vein antrum isolation: procedural parameters, outcomes, and the effect on esophageal injury. J Cardiovasc Electrophysiol. 2007;18:583–588. doi: 10.1111/j.1540-8167.2007.00879.x. [DOI] [PubMed] [Google Scholar]
- 12.Denis de Senneville B, Roujol S, Jaïs P, Moonen CTW, Herigault G, Quesson B. Feasibility of fast MR-thermometry during cardiac radiofequency ablation. NMR Biomed. 2012;25:556–562. doi: 10.1002/nbm.1771. [DOI] [PubMed] [Google Scholar]
- 13.Hey S, Cernicanu A, Dennis de Senneville B, Roujol S, Ries M, Jaıïs P, Moonen CTW, Quesson B. Towards optimized MR thermometry of the human heart at 3T. NMR Biomed. 2012;25:35–45. doi: 10.1002/nbm.1709. [DOI] [PubMed] [Google Scholar]
- 14.Sathyanarayana S, Bottomley PA. MRI endoscopy using intrinsically localized probes. Med Phys. 2009;36:908–919. doi: 10.1118/1.3077125. [DOI] [PMC free article] [PubMed] [Google Scholar]
- 15.Ichimura S, Quan W, Matsunaga Y, Kuroda K, Haga Y. Development of multilayer coil using non-planar MEMS process for intraluminal MRI probe In Proceedings of the 18th Annual Meeting of. ISMRM; Stockholm, Sweden: 2010. p. 3906. [Google Scholar]
- 16.Hillenbrand CM, Elgort DR, Wong EY, Reykowski A, Wacker FK, Lewin JS, Duerk JL. Active device tracking and high-resolution intravascular MRI using a novel cathete-based, opposed-solenoid phased array coil. Magn Reson Med. 2004;51:668–675. doi: 10.1002/mrm.20050. [DOI] [PubMed] [Google Scholar]
- 17.Martin AJ, Plewes DB, Henkelman RM. MR imaging of blood vessels with an intravascular coil. J Magn Reson Imaging. 1992;2:421–429. doi: 10.1002/jmri.1880020411. [DOI] [PubMed] [Google Scholar]
- 18.Martin AJ, Henkelman RM. Intravascular MR imaging in a porcine animal model. Magn Reson Med. 1994;32:224–229. doi: 10.1002/mrm.1910320211. [DOI] [PubMed] [Google Scholar]
- 19.Ocali O, Atalar E. Intravascular magnetic resonance imaging using a loopless catheter antenna. Magn Reson Med. 1997;37:112–118. doi: 10.1002/mrm.1910370116. [DOI] [PubMed] [Google Scholar]
- 20.El-Sharkawy AM, Qian D, Bottomley PA. The performance of interventional loopless MRI antennae at higher magentic field strengths. Med Phys. 2008;35:1995–2006. doi: 10.1118/1.2905027. [DOI] [PMC free article] [PubMed] [Google Scholar]
- 21.Shunk KA, Lima JAC, Heldman AW, Atalar E. Transesophageal magnetic resonance imaging. Magn Reson Med. 1999;41:722–726. doi: 10.1002/(sici)1522-2594(199904)41:4<722::aid-mrm10>3.0.co;2-e. [DOI] [PubMed] [Google Scholar]
- 22.Quick HH, Ladd ME, Nanz D, Mikolajczyk KP, Debatin JF. Vascular stents as RF antennas for intravascular MR guidance and imaging. Magn Reson Med. 1999;42:738–745. doi: 10.1002/(sici)1522-2594(199910)42:4<738::aid-mrm16>3.0.co;2-y. [DOI] [PubMed] [Google Scholar]
- 23.Kivelitz D, Wagner S, Schnorr J, Wetzler R, Busch M, Melzer A, Taupitz M, Hamm B. A vascualr stent as an active component for locally enhanced magnetic resonance imaging. Invest Radiol. 2003;38:147–152. doi: 10.1097/01.RLI.0000052981.82153.A1. [DOI] [PubMed] [Google Scholar]
- 24.Quick HH, Ladd ME, Zimmermann-Paul GG, Erhart P, Hofmann E, von Schulthess GK, Debatin JF. Single-loop coil concepts for intravascular magnetic resonance imaging. Magn Reson Med. 1999;41:751–758. doi: 10.1002/(sici)1522-2594(199904)41:4<751::aid-mrm14>3.0.co;2-v. [DOI] [PubMed] [Google Scholar]
- 25.Homagk A-K, Umathum R, Korn M, Weber M-A, Hallscheidt P, Semmler W, Bock M. An expandable catheter loop coil for intravascular MRI in larger blood vessels. Magn Reson Med. 2010;63:517–523. doi: 10.1002/mrm.22228. [DOI] [PubMed] [Google Scholar]
- 26.Ahmad MM, Syms RRA, Young IR, Mathew B, Casperz W, Taylor-Robinson SD, Wadsworth CA, Gedroyc WMW. Catheter-based flexible microcoil RF detectors for internal magnetic resonance imaging. J Micromech Microeng. 2009;19:1–10. [Google Scholar]
- 27.Zimmermann-Paul GG, Quick HH, Vogt P, von Schulthess GK, Kling D, Debatin JF. High-resolution intravascular magentic resonance imaging: monitoring of plaque formation in heritable hyperlipidemic rabbits. Circulation. 1999;99:1054–1061. doi: 10.1161/01.cir.99.8.1054. [DOI] [PubMed] [Google Scholar]
- 28.Qin L, Schmidt EJ, Hoge WS, Santos J, Tempany-Afdhal C, Butts-Pauly K, Dumoulin CL. Prospective motion correction using an MR-tracking tetrahedron for intra-cavity MRI In Proceedings of the 18th Annual Meeting of. ISMRM; Stockholm, Sweden: 2010. p. 293. [Google Scholar]
- 29.Qin L, Schmidt EJ, Tse ZT, Santos J, Hoge WS, Tempany-Afdhal C, Butts-Pauly K, Dumoulin CL. Prospective motion correction using tracking coils. Magn Reson Med. 2013;69:749–759. doi: 10.1002/mrm.24310. [DOI] [PMC free article] [PubMed] [Google Scholar]
- 30.Schmidt EJ, Qin L, Santos J, Michaud GF, Kwong RK, Butts-Pauly K, Stevenson WG, Dumoulin CL. Intra-cardiac MRI catheter for EP ablation monitoring: preliminary studies In Proceedings of the 19th Annual Meeting of. ISMRM; Montreal, Canada: 2011. p. 3741. [Google Scholar]
- 31.Grabek JR, Hoey MF, Inventors. Beck & Tysver, P.L.L.C. Assignee The intrapericardial MRI device and method. 10/641,474. US Patent Application. 2003 Aug.
- 32.Volland NA, Kholmovski EG, Hadley JR, Parker DL. Limited FOV MR thermometry using a local cardiac RF coil in atrial fibrillation treatment In Proceedings of the 19th Annual Meeting of. ISMRM; Montreal, Canada: 2011. p. 1764. [Google Scholar]
- 33.McVeigh ER, Bronskill MJ, Henkelman RM. Phase and sensitivity of receiver coils in magnetic resonance imaging. Med Phys. 1986;13:806–814. doi: 10.1118/1.595967. [DOI] [PMC free article] [PubMed] [Google Scholar]
- 34.Peterson DM, Beck BL, Duensing GR, Fitzsimmons JR. Common mode signal rejection methods for MRI: reduction of cable shield currents for high static magnetic field systems. Concepts Magn Reson B. 2003;19:1–8. [Google Scholar]
- 35.Reykowski A, Wright SM, Porter JR. Design of matching networks for low noise preamplifiers. Magn Reson Med. 1995;33:848–852. doi: 10.1002/mrm.1910330617. [DOI] [PubMed] [Google Scholar]
- 36.Rieke V, Pauly KB. MR thermometry. J Magn Reson Imaging. 2008;27:376–390. doi: 10.1002/jmri.21265. [DOI] [PMC free article] [PubMed] [Google Scholar]
- 37.Ishihara Y, Calderon A, Watanabe H, Okamoto K, Suzuki Y, Kuroda K, Suzuki Y. A precise and fast temperature mapping using water proton chemical shift. Magn Reson Med. 1995;34:814–823. doi: 10.1002/mrm.1910340606. [DOI] [PubMed] [Google Scholar]
- 38.Kellman P, McVeigh ER. Image reconstruction in SNR units: a general method for SNR measurement. Magn Reson Med. 2005;54:1439–1447. doi: 10.1002/mrm.20713. [DOI] [PMC free article] [PubMed] [Google Scholar]
- 39.Vergara GR, Vijayakumar S, Kholmovski EG, et al. Real-time magnetic resonance imaging-guided radiofrequency atrial ablation and visualization of lesion formation at 3 Tesla. Heart Rythm. 2011;8:295–303. doi: 10.1016/j.hrthm.2010.10.032. [DOI] [PMC free article] [PubMed] [Google Scholar]
- 40.Volland NA, Kholmovski EG, Hadley JR, Parker DL. In vivo limited FOV MR thermometry using a local cardiac RF coil in atrial fibrillation treatment In Proceedings of the 20th Annual Meeting of. ISMRM; Melbourne, Australia: 2012. p. 2933. [Google Scholar]
- 41.Vigen KK, Daniel BL, Pauly JM, Butts-Pauly K. Triggered, navigated, multi-baseline method for proton resonance frequency temperature map-pong with respiratory motion. Magn Reson Med. 2003;50:1003–1010. doi: 10.1002/mrm.10608. [DOI] [PubMed] [Google Scholar]
- 42.Schenck JF. The role of magnetic susceptibility in magnetic resonance imaging: MRI magnetic compatibility of the first and second kinds. Med Phys. 1996;23:815–850. doi: 10.1118/1.597854. [DOI] [PubMed] [Google Scholar]


