Abstract
Background
Colorectal cancer is a leading cause of cancer related mortality, has a very broad mutational spectrum, and there is no clinically available biomarker that can predict which patients with stage II or stage III colorectal cancer will develop metastatic disease.
Patients and Methods
We used a targeted next-generation sequencing approach to analyze the mutational spectra in stage II and III colon cancer patient samples.
Results
Amidst a broad range of acquired mutations and variants, we found evidence of tumor heterogeneity that distinguished the tumors in different groups. When heterogeneity was quantified using the Mutant-Allele Tumor Heterogeneity (MATH) score, there was a strong correlation between higher MATH score and risk of metastases.
Conclusions
Measures of tumor heterogeneity may be useful biomarkers for identifying patients with colon cancer that are at risk of developing metastases. This may allow for more specific, tailored follow-up and adjuvant therapies after standard surgery.
Keywords: stage II, stage III, biomarker, sequencing, tumor evolution
MICROABSTRACT
There is no clinical biomarker that predicts which patients with stage II–III colon cancers are at risk for developing metastases. A bioinformatics approach using the MATH score for tumor heterogeneity may identify this high-risk subset of patients to tailor adjuvant therapies and surveillance.
Colorectal cancer remains a leading cause of cancer related mortality worldwide. The vast majority of deaths from this disease are not from the primary tumor itself, but from metastatic disease. Identifying the patients that are most likely to develop metastases remains an important clinical and research goal. The current paradigm for treatment is based on gross pathologic evaluation. Early staged (I and II) low risk tumors are treated with surgical resection alone. As standard of care, adjuvant therapies are not offered, but up to 20% of patients diagnosed as early stage will go on to develop metastatic disease (1–3). Patients with lymph node metastasis, Stage III, are treated with resection and are offered adjuvant cytotoxic chemotherapies as standard of care. Despite this aggressive, multi-modality approach, approximately 50% of Stage III patients will subsequently develop metastatic disease (3). Unfortunately, there is no clinically available biomarker to reliably predict which stage II and III patients are at risk of developing advanced metastatic disease.
Next-generation sequencing provides a powerful new approach to characterize tumors, and has ushered in a new era of ‘personalized medicine’, by providing a means of matching patients whose tumors harbor specific driver mutations to drugs that specifically target those lesions. However, detailed analysis of tumor mutations, made possible by “deep” sequencing at high read-depth to detect rare mutations, has revealed extraordinary heterogeneity in tumors, especially as they evolve and progress to become metastatic (4). This may be especially true in colorectal cancer, which is often associated with mutations in genes that affect DNA repair pathways (5, 6). Intra-tumoral heterogeneity has been linked to metastatic potential in animal models (7), and is likely to be an important prognostic feature of human disease. Human tumors that are more heterogeneous are thought to include tumor sub-clones that have evolved to evade standard therapies or to increase their ability to metastasize to distant sites (8).
Recently, next-generation sequencing approaches that make use of “deep” sequencing to analyze tumor sub-clones have been described for evaluating the importance of tumor heterogeneity in diverse cancer types, including leukemias, head and neck tumors and rectal cancer (4, 9–11). We hypothesized that these approaches would also provide information about the tumor heterogeneity, and perhaps the potential for metastasis, in colon cancer. Our results suggest that measures of tumor heterogeneity could be useful biomarkers for identifying patients at highest risk of metastatic disease.
PATIENTS AND METHODS
Seven patients with either stage II or III colon cancer were identified in a prospective database in the Division of Surgical Oncology. After IRB approval, corresponding normal and colon tumor formalin fixed, paraffin embedded blocks of these patient samples were obtained from the UNM Cancer Center Human Tissue Repository. Upon successful extraction of DNA using standard techniques, samples were analyzed using the Ion Ampliseq Comprehensive Cancer panel assay, which targets more than 400 cancer-relevant genes. Sequencing was performed on the Ion Proton instrument as described by the manufacturer, (Thermo Fisher Scientific, Waltham, MA), generating average read depths of >1000× across the targeted regions. As quality control, only samples that yielded >500× average coverage for all 4 multiplexed primer pools were used for downstream analyses. Variants were called by the Torrent Server Variant Caller (versions 4.21, 4.421, 4.607 or 5.021 with interchangeable results). The resulting Variant Caller Format (VCF) files were compared using customized bioinformatics scripts (R v 3.2.2) (12) with Bioconductor (v 3.2) (13). Analyses were limited to single nucleotide variants (no indels) with read depth greater than 50 and at least 5 reads in each direction. Note: only tumor samples were analyzed with this 409-gene panel. Although some of the variants detected arise from the germline, no germline (normal) samples were analyzed for these studies. The R scripts and the VCF files used for these analyses are available for download (14). (Note: although these data were collected before the implementation of the current NIH policy on genome data sharing, the de-identified VCF files are considered Level 3 and are not subject to controlled-access.)
Variant Allele Frequencies (VAF) were calculated as the ratio of alternate allele observations to the read depth at each position. Since we did not analyze normal germline samples, we modified the Mutant Allele Tumor Heterogeneity (MATH) score (10) to include all heterozygous (genotype “0/1”) variants with VAF between 0.05 and 0.75, calculated as 100× median absolute deviation (MAD)/median of the VAF. The comparisons of MATH score between stages were conducted using t-test statistics after checking the required assumptions of the distribution and equal variance. For Principal Components Analysis, the data set was first limited to a subset of SNPs that differed the most between stage II and III patients, then plots were prepared using plotMDS, part of the Bioconductor package LIMMA (15).
To test the reproducibility of this test above, we identified 3 additional colon tumor samples that had originally been diagnosed as stage II tumors, but subsequently went on to develop metastatic disease. As described above, the same procedure was employed to quantify the tumor heterogeneity by determine the corresponding the MATH score.
RESULTS
We performed high read-depth (“deep”) sequencing of >400 cancer-relevant genes on a group of 7 colon cancer samples divided between stages II and III, which were obtained from the UNM Cancer Center Human Tissue Repository. The DNA samples were obtained from diagnostic FFPE samples, analyzed using the Ion Ampliseq Comprehensive Cancer Panel assay, and sequencing was performed on the Ion Proton next-generation sequencing instrument, generating average read depths of >1000× across the targeted regions. Matched normal samples were analyzed using Ion Ampliseq Exome sequencing assays, which generated average read depths of >100× across the targeted regions. For these studies, only tumor samples were analyzed, similar to practices commonly performed by clinical laboratories performing diagnostic tests.
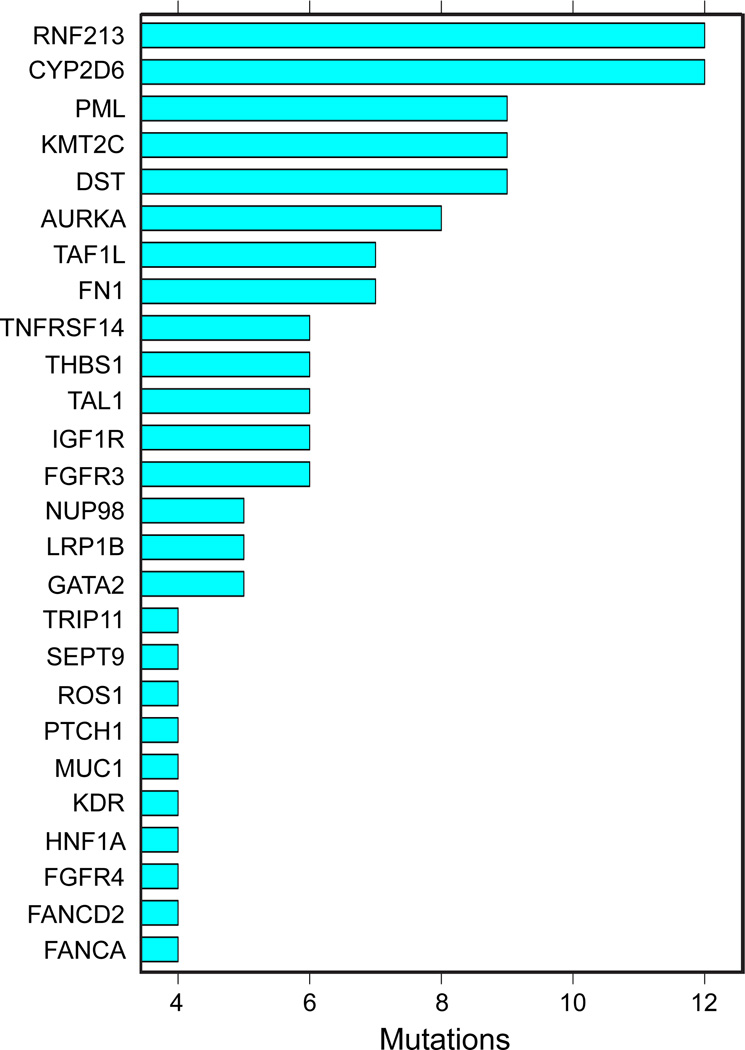
As summarized in Figure 1, heterozygous tumor-specific mutations were detected in numerous genes, and the same genes were often found mutated in several tumor samples. These results fit with models of colon cancer carcinogenesis that predict the involvement of a limited number of driver mutations involved in the development of the primary tumor (16, 17). Thus, the mutational spectrum observed in colon carcinoma, even in this small cohort of samples, is quite diverse.
Figure 1. Most Common Mutations.
The bar chart shows the most common nonsynonymous mutations detected in the cohort of 7 colon cancer samples analyzed by deep sequencing.
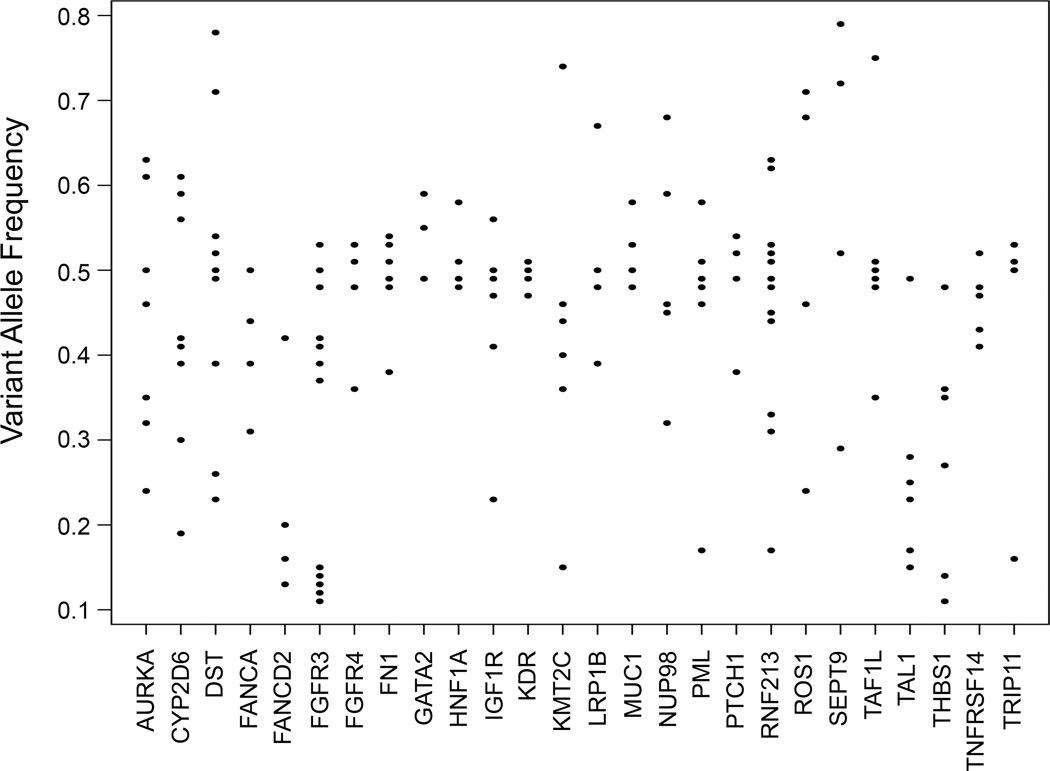
However, a more complicated picture emerged when we investigated the Variant Allele Frequencies (VAF) detected in various samples. In the DNA of normal cells, allele frequencies are expected to cluster around 50% for heterozygous variants, and around 0% or 100% for homozygous alleles. Figure 2 shows the distributions of VAF for heterozygous tumor variants for the 26 most commonly mutated genes in the tumors analyzed. The results show that VAF varied considerably, from as low as 10% to as high as 80%. For example, we detected mutations in the KMT2C (MLL3) gene at VAF between 0.15 and 0.45 in several samples. Since these mutations are heterozygous, the results suggest that the percentage of cells harboring the observed mutations varies from about 30% to about 90% of the cells in the tumors. Similar results were obtained for all of the detected tumor-specific mutations. Since all of the tumors were judged to be at least 40% tumor cells by microscopic analysis, these results suggest that sub-clones with different sets of mutations exist in many of the tumors.
Figure 2. Variant Allele Frequencies.
Plots of variant allele frequencies (VAF) for heterozygous mutations in most commonly mutated genes are shown. Note the wide spread in VAF’s indicating tumor heterogeneity.
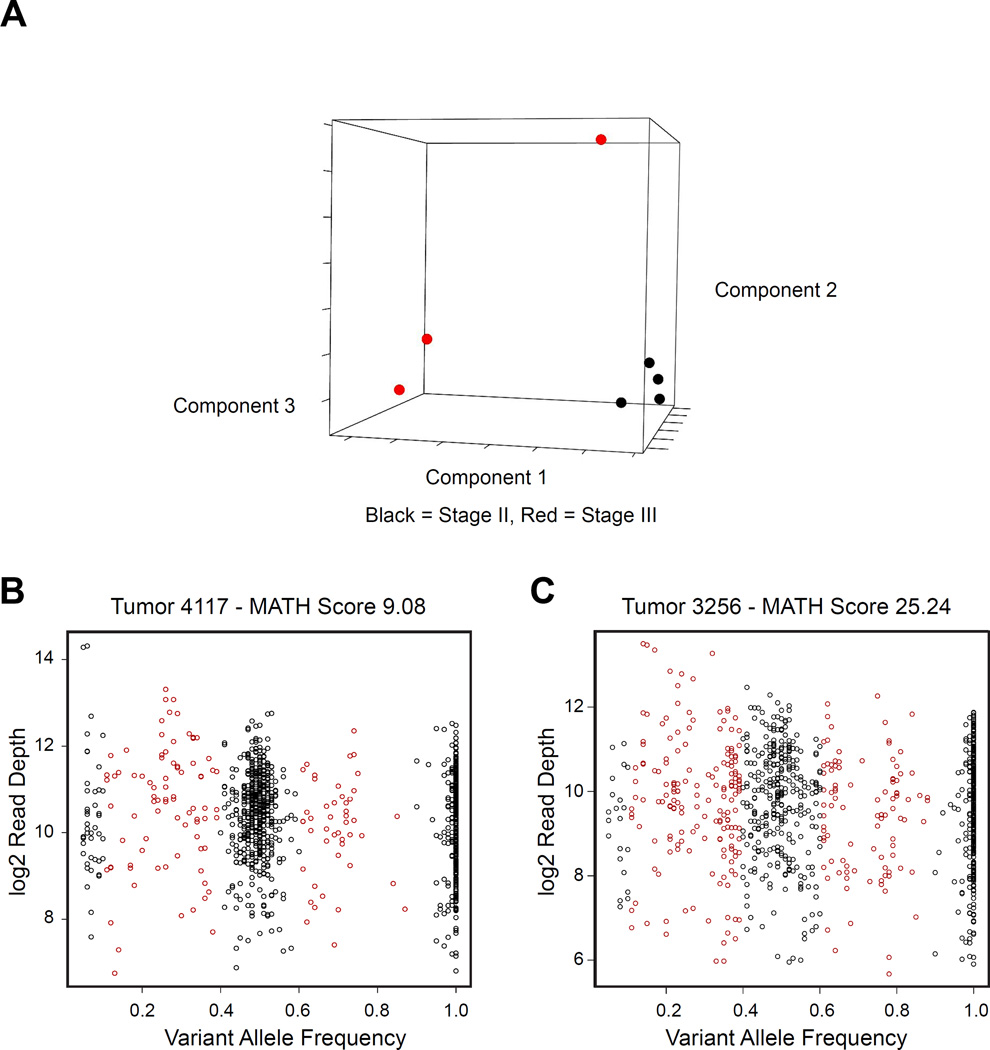
Although some of the tumor heterogeneity is due to the presence of both normal and tumor cells in the samples, there is also evidence that the tumors are themselves heterogeneous, suggesting the presence of multiple tumor sub-clones. As a first step in analyzing the tumor heterogeneity in these samples, we performed Principal Components Analysis (PCA) on the variant allele frequencies observed in the tumors. As shown in Figure 3A, the stage II tumors (black) clustered tightly together, while the stage III tumors (red) were more heterogeneous and more scattered.
Figure 3. Tumor Heterogeneity.
(A) Principal Components Analysis of variant allele frequencies (VAF) for mutations detected in the tumors analyzed. Black and red indicate stage II and III tumors, respectively. (B) and (C) show plots of VAF vs. read depth for samples 4117 (MATH=9.08) and 3256 (MATH=25.24), respectively. Note the greater horizontal spread in the VAF scores for the latter sample, resulting in the higher MATH score.
Tumor heterogeneity has been extensively analyzed in acute myeloid leukemias, and several types of plots have been described for displaying the data (9). Figures 3B and 3C show plots of variant allele frequency vs. read depth (9) for two tumor samples, which had similar numbers of tumor-specific heterozygous mutations. In panel 3B (tumor 4117), there is a distinct cluster of variants at approximately 50% variant allele frequency and smaller clusters at 0% and 100%. Although there are some mutations at intermediate variant allele frequencies (shaded red), most of the variants cluster near 50%. However, we noted that some samples had a more complex composition. Figure 3C (tumor 3256) shows a much more spread-out, diverse spectrum of VAF. This “spread” may be evidence of significant tumor heterogeneity, likely caused by the presence of several sub-clones within the tumor. This type of heterogeneity in tumors is thought to lead to the outgrowth of therapy-resistant clones, or tumor evolution, and eventually to metastatic disease (18, 19).
Recently, the Mutant-Allele Tumor Heterogeneity (MATH) score was developed to quantify differences in the dispersion or spread of allele frequencies in head and neck tumor samples (10). The MATH score is calculated as 100× median absolute deviation (MAD)/median of the variant allele frequencies, and describes the ratio of the width of the data to the center of the distribution – effectively a score describing the spread in the data. In most cases, the MATH score is applied to exome sequencing data from germline (normal) and tumor, so that the tumor-specific mutations can be identified. However, we modified this approach, using the data from a targeted sequencing panel (Ion Ampliseq Comprehensive Cancer Panel) and analyzing only the tumor samples. This is an approach typically used by clinical laboratories, which analyze only the tumor biopsy samples without germline analyses. We applied the MATH score to quantify the tumor heterogeneity in our colorectal tumor samples. For example, sample 4117 in Figure 3B shows strong clustering of the variants at 50% VAF and has a low MATH score of 9.08. In contrast, sample 3256 in Figure 3C shows a widely spread distribution of allele frequencies and has a high MATH score of 25.24. Thus, the MATH score provides a quantitative measure of the degree of heterogeneity in a tumor sample.
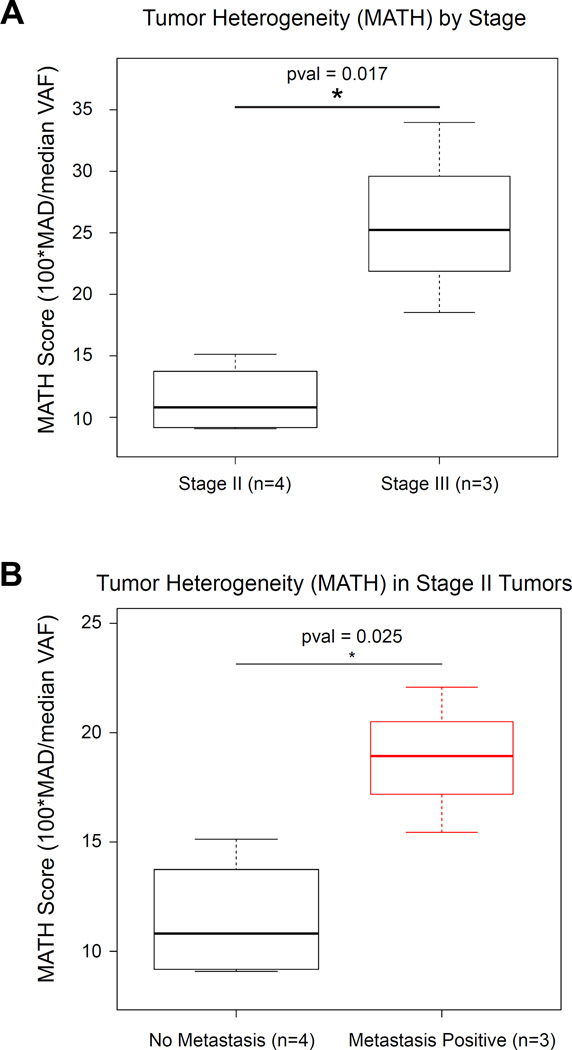
We calculated and compared the MATH scores for our cohort of colon cancer samples and found that the MATH score was strongly associated with tumor stage. As shown in Figure 4A, stage II tumors had low MATH scores and the MATH scores were significantly (p=0.016) higher in stage III tumors. The finding that more advanced tumors have greater tumor heterogeneity is consistent with the hypothesis that the presence of more tumor sub-clones (more heterogeneity) is likely to lead to selection for resistant and more aggressive clones that grow, metastasize and lead to recurrent disease after chemotherapy.
Figure 4. MATH Score as a Biomarker.
(A) The boxplot shows the range of calculated MATH scores for tumors initially labeled stage II, and III. (B) The boxplot compares the MATH scores for the original stage II tumors and three additional samples (red) that were initially diagnosed as stage II but that subsequently formed metastases. The results suggest that the MATH scores may be useful for identifying such patients.
To validate our results, we selected three additional colon tumor samples that were initially diagnosed as stage II, but subsequently developed metastases. We compared them to the original stage II samples described above. As shown in Figure 4B, the three samples that were initially labeled as stage II but later formed metastatic disease had higher MATH scores (p=0.025) than the stage II tumors that did not form metastases. These results suggest that measures of tumor heterogeneity, such as the MATH score, may be useful for identifying patients that should receive additional therapy or be monitored more aggressively for the development of metastatic disease.
DISCUSSION
Colorectal cancer remains a leading cause of cancer related morbidity and mortality worldwide. Being able to predict which patients with stage II or stage III disease will eventually present with recurrent or metastatic disease remains a clinical challenge. Our application of the MATH score to a set of human colon cancer samples demonstrates that higher MATH scores are indicative of increased tumor heterogeneity and are correlated with a higher stage of disease. Stage III patients had a higher MATH score than the stage II patients. This indicates that tumor heterogeneity is an important risk factor for tumor progression and that the MATH score may be a useful biomarker for staging colorectal cancer and possibly predicting disease recurrence.
Traditional bioinformatics approaches have attempted to try and identify high risk stage II and III patients using a number of tumor gene expression profiling assays to predict overall patient outcome and responsiveness to chemotherapy (20–27). Although responsiveness to adjuvant therapy has not been realized by these assays, some have been able to show a correlation between survival and a certain gene profile. However, there is little to no overlap in the demonstrated genes of significance between the assays and more importantly, the validation sets are small or not representative of the patient subgroups. Thus, there still remains a critical need to identify a reliable biomarker for high-risk stage II and stage III patients with colon cancer. Furthermore, if tumors are composed of several sub-clones, sampling different parts of a tumor could result in different lists of tumor mutations.
The existence of intra-tumor heterogeneity has been noted for some time in the literature. With technical advancements in the field of high-resolution genome-wide studies, this heterogeneity has been demonstrated. In fact, synonymous drivers of mutations may arise independently in distinct clones and these clones may demonstrate unique diagnostic signatures from a single tumor, depending on the site of the biopsy (28). In a review of intra-tumoral heterogeneity, Marusyk and colleagues delineate both genetic and non-genetic causes of phenotypic heterogeneity of cancer cells. This heterogeneity has been shown to have significant importance in prognosis, risk of developing metastatic disease and in the development of resistance to therapies (29).
Mroz and colleagues developed the MATH score as a quantitative measure of intra-tumoral genetic heterogeneity and applied it to tumors of the head and neck (10, 11). They confirmed that higher MATH scores were found in high-risk, poor outcome groups of patients with head and neck squamous cell cancers. Since colon tumors are often associated with micro-satellite instability, it is possible that the increased MATH scores that we detected in samples destined for metastases could be related to increased genome instability. Future studies will address such questions.
Limitations of this study include the small sample size and the exploratory nature of a discovery study. To overcome this, we conducted a small independent dataset for sensitivity analysis. Despite these limitations, the data may contribute to a key clinical challenge which is to overcome the inability to predict which patients with stage II and stage III colon cancer are going to progress to metastatic disease.
CLINICAL PRACTICE POINTS.
This data shows that a novel bioinformatics approach using the MATH score as a reflection of tumor heterogeneity may allow for identifying patients who are at risk for developing metastatic disease. Access to this type of information will allow for more directed follow-up and perhaps more personally tailored adjuvant therapies to alleviate the morbidity and mortality from colorectal cancers.
Acknowledgments
Financial Support
S.A. Ness: NIH grants 5R01CA170250, 5R01DE023222, 5P30CA118100
The authors acknowledge the outstanding technical support from Jennifer Woods, Maggie Cyphery, Jamie Padilla, Gavin Pickett and Jason Byars, and Patricia J. Young for assistance in manuscript preparation. Some experiments used the facilities or services provided by the Analytical and Translational Genomics Shared Resource, which is supported by the State of New Mexico and the UNM Comprehensive Cancer Center P30CA118100.
REFERENCES
- 1.Goossens-Beumer IJ, Derr RS, Buermans HP, Goeman JJ, Bohringer S, Morreau H, et al. MicroRNA classifier and nomogram for metastasis prediction in colon cancer. Cancer Epidemiol Biomarkers Prev. 2015;24:187–197. doi: 10.1158/1055-9965.EPI-14-0544-T. [DOI] [PubMed] [Google Scholar]
- 2.Marisa L, de Reynies A, Duval A, Selves J, Gaub MP, Vescovo L, et al. Gene expression classification of colon cancer into molecular subtypes: characterization, validation, and prognostic value. PLoS Med. 2013;10:e1001453. doi: 10.1371/journal.pmed.1001453. [DOI] [PMC free article] [PubMed] [Google Scholar]
- 3.Sanz-Pamplona R, Berenguer A, Cordero D, Riccadonna S, Sole X, Crous-Bou M, et al. Clinical value of prognosis gene expression signatures in colorectal cancer: a systematic review. PLoS One. 2012;7:e48877. doi: 10.1371/journal.pone.0048877. [DOI] [PMC free article] [PubMed] [Google Scholar]
- 4.Hardiman KM, Ulintz PJ, Kuick RD, Hovelson DH, Gates CM, Bhasi A, et al. Intra-tumor genetic heterogeneity in rectal cancer. Lab Invest. 2016;96:4–15. doi: 10.1038/labinvest.2015.131. [DOI] [PMC free article] [PubMed] [Google Scholar]
- 5.Stoffel EM, Mangu PB, Gruber SB, Hamilton SR, Kalady MF, Lau MW, et al. Hereditary colorectal cancer syndromes: American Society of Clinical Oncology Clinical Practice Guideline endorsement of the familial risk-colorectal cancer: European Society for Medical Oncology Clinical Practice Guidelines. J Clin Oncol. 2015;33:209–217. doi: 10.1200/JCO.2014.58.1322. [DOI] [PMC free article] [PubMed] [Google Scholar]
- 6.Stoffel EM, Mangu PB, Limburg PJ. Hereditary colorectal cancer syndromes: american society of clinical oncology clinical practice guideline endorsement of the familial risk-colorectal cancer: European society for medical oncology clinical practice guidelines. J Oncol Pract. 2015;11:e437–e441. doi: 10.1200/JOP.2015.003665. [DOI] [PubMed] [Google Scholar]
- 7.Chowdhury S, Ongchin M, Sharratt E, Dominguez I, Wang J, Brattain MG, et al. Intra-tumoral heterogeneity in metastatic potential and survival signaling between iso-clonal HCT116 and HCT116b human colon carcinoma cell lines. PLoS One. 2013;8:e60299. doi: 10.1371/journal.pone.0060299. [DOI] [PMC free article] [PubMed] [Google Scholar]
- 8.Sottoriva A, Kang H, Ma Z, Graham TA, Salomon MP, Zhao J, et al. A Big Bang model of human colorectal tumor growth. Nat Genet. 2015;47:209–216. doi: 10.1038/ng.3214. [DOI] [PMC free article] [PubMed] [Google Scholar]
- 9.Klco JM, Spencer DH, Miller CA, Griffith M, Lamprecht TL, O'Laughlin M, et al. Functional heterogeneity of genetically defined subclones in acute myeloid leukemia. Cancer Cell. 2014;25:379–392. doi: 10.1016/j.ccr.2014.01.031. [DOI] [PMC free article] [PubMed] [Google Scholar]
- 10.Mroz EA, Rocco JW. MATH, a novel measure of intratumor genetic heterogeneity, is high in poor-outcome classes of head and neck squamous cell carcinoma. Oral Oncol. 2013;49:211–215. doi: 10.1016/j.oraloncology.2012.09.007. [DOI] [PMC free article] [PubMed] [Google Scholar]
- 11.Mroz EA, Tward AD, Pickering CR, Myers JN, Ferris RL, Rocco JW. High intratumor genetic heterogeneity is related to worse outcome in patients with head and neck squamous cell carcinoma. Cancer. 2013;119:3034–3042. doi: 10.1002/cncr.28150. [DOI] [PMC free article] [PubMed] [Google Scholar]
- 12.Team" RC. R: A language and environment for statistical computing. 2015 Available from URL: https://www.R-project.org/ [Google Scholar]
- 13.Gentleman R, Carey V, Bates D, Bolstad B, Dettling M, Dudoit S, et al. Bioconductor: open software development for computational biology and bioinformatics. Genome Biol. 2004;5:R80. doi: 10.1186/gb-2004-5-10-r80. [DOI] [PMC free article] [PubMed] [Google Scholar]
- 14.Ness S. Github: tumor_heterog_math. Available from URL: https://github.com/scottness/tumor_heterog_math.git. [Google Scholar]
- 15.Ritchie ME, Phipson B, Wu D, Hu Y, Law CW, Shi W, et al. limma powers differential expression analyses for RNA-sequencing and microarray studies. Nucleic Acids Res. 2015;43:e47. doi: 10.1093/nar/gkv007. [DOI] [PMC free article] [PubMed] [Google Scholar]
- 16.Tomasetti C, Marchionni L, Nowak MA, Parmigiani G, Vogelstein B. Only three driver gene mutations are required for the development of lung and colorectal cancers. Proc Natl Acad Sci U S A. 2015;112:118–123. doi: 10.1073/pnas.1421839112. [DOI] [PMC free article] [PubMed] [Google Scholar]
- 17.Tomasetti C, Vogelstein B. Cancer etiology. Variation in cancer risk among tissues can be explained by the number of stem cell divisions. Science. 2015;347:78–81. doi: 10.1126/science.1260825. [DOI] [PMC free article] [PubMed] [Google Scholar]
- 18.McGranahan N, Favero F, de Bruin EC, Birkbak NJ, Szallasi Z, Swanton C. Clonal status of actionable driver events and the timing of mutational processes in cancer evolution. Sci Transl Med. 2015;7:283ra54. doi: 10.1126/scitranslmed.aaa1408. [DOI] [PMC free article] [PubMed] [Google Scholar]
- 19.McGranahan N, Swanton C. Biological and therapeutic impact of intratumor heterogeneity in cancer evolution. Cancer Cell. 2015;27:15–26. doi: 10.1016/j.ccell.2014.12.001. [DOI] [PubMed] [Google Scholar]
- 20.Arango D, Laiho P, Kokko A, Alhopuro P, Sammalkorpi H, Salovaara R, et al. Gene-expression profiling predicts recurrence in Dukes' C colorectal cancer. Gastroenterology. 2005;129:874–884. doi: 10.1053/j.gastro.2005.06.066. [DOI] [PubMed] [Google Scholar]
- 21.Barrier A, Boelle PY, Roser F, Gregg J, Tse C, Brault D, et al. Stage II colon cancer prognosis prediction by tumor gene expression profiling. J Clin Oncol. 2006;24:4685–4691. doi: 10.1200/JCO.2005.05.0229. [DOI] [PubMed] [Google Scholar]
- 22.Gray RG, Quirke P, Handley K, Lopatin M, Magill L, Baehner FL, et al. Validation study of a quantitative multigene reverse transcriptase-polymerase chain reaction assay for assessment of recurrence risk in patients with stage II colon cancer. J Clin Oncol. 2011;29:4611–4619. doi: 10.1200/JCO.2010.32.8732. [DOI] [PubMed] [Google Scholar]
- 23.Jiang Y, Casey G, Lavery IC, Zhang Y, Talantov D, Martin-McGreevy M, et al. Development of a clinically feasible molecular assay to predict recurrence of stage II colon cancer. J Mol Diagn. 2008;10:346–354. doi: 10.2353/jmoldx.2008.080011. [DOI] [PMC free article] [PubMed] [Google Scholar]
- 24.Kennedy RD, Bylesjo M, Kerr P, Davison T, Black JM, Kay EW, et al. Development and independent validation of a prognostic assay for stage II colon cancer using formalin-fixed paraffin-embedded tissue. J Clin Oncol. 2011;29:4620–4626. doi: 10.1200/JCO.2011.35.4498. [DOI] [PubMed] [Google Scholar]
- 25.Lin YH, Friederichs J, Black MA, Mages J, Rosenberg R, Guilford PJ, et al. Multiple gene expression classifiers from different array platforms predict poor prognosis of colorectal cancer. Clin Cancer Res. 2007;13:498–507. doi: 10.1158/1078-0432.CCR-05-2734. [DOI] [PubMed] [Google Scholar]
- 26.O'Connell MJ, Lavery I, Yothers G, Paik S, Clark-Langone KM, Lopatin M, et al. Relationship between tumor gene expression and recurrence in four independent studies of patients with stage II/III colon cancer treated with surgery alone or surgery plus adjuvant fluorouracil plus leucovorin. J Clin Oncol. 2010;28:3937–3944. doi: 10.1200/JCO.2010.28.9538. [DOI] [PMC free article] [PubMed] [Google Scholar]
- 27.Salazar R, Roepman P, Capella G, Moreno V, Simon I, Dreezen C, et al. Gene expression signature to improve prognosis prediction of stage II and III colorectal cancer. J Clin Oncol. 2011;29:17–24. doi: 10.1200/JCO.2010.30.1077. [DOI] [PubMed] [Google Scholar]
- 28.Gerlinger M, Rowan AJ, Horswell S, Larkin J, Endesfelder D, Gronroos E, et al. Intratumor heterogeneity and branched evolution revealed by multiregion sequencing. N Engl J Med. 2012;366:883–892. doi: 10.1056/NEJMoa1113205. [DOI] [PMC free article] [PubMed] [Google Scholar]
- 29.Marusyk A, Almendro V, Polyak K. Intra-tumour heterogeneity: a looking glass for cancer? Nat Rev Cancer. 2012;12:323–334. doi: 10.1038/nrc3261. [DOI] [PubMed] [Google Scholar]


