Abstract
Background
Allografts from living donors survive longer than those from deceased donors but the role of HLA mismatching in living kidney donation is still in question. We examined the effect of HLA compatibility on kidney allograft survival from living donors by studying all first adult kidney transplants performed in the United States over 25 years.
Methods
Using the United Network for Organ Sharing data, we identified first kidney transplants between October 1, 1987, and December 31, 2013. Recipients were classified by their number of HLA mismatches and stratified by donor origin. Cox multivariate regression analyses adjusting for recipient and donor transplant characteristics were performed to determine impact of HLA compatibility on kidney allograft survival for all living donors and for living related and living unrelated subsets.
Results
There were 66 596 first adult transplants from living donors with 348 960 years of follow-up. We found a linear relationship between HLA mismatch and allograft survival. In adjusted analyses, among all living donors, 1 mismatch conferred a 44% higher risk, whereas 6 mismatches conferred a twofold higher risk of allograft failure. When using 0-mismatched full siblings as a reference, living-donor kidneys reduce the hazard of failure by approximately 34% when compared with deceased donors. Twenty-five years of transplant experience, stratified by donor source, was summarized and presented as a guide for allocation.
Conclusions
These data reinforce the importance of optimizing HLA matching to further improve survival in first adult kidney allografts in the future, especially in living unrelated donations, when possible.
Living kidney transplantation is the best therapeutic option to provide renal replacement therapy to patients with end-stage kidney disease.1-9 HLA matching is not currently part of the algorithm for donor determination in the United States except among deceased donors where 0 mismatches between kidney and recipient receive higher priority. We previously reported a linear relation of kidney survival with HLA mismatch for organs from deceased donors; 1 mismatch conferred a 13% higher risk and 6 mismatches conferred a 64% higher risk of allograft failure.10
However, the same association has not been studied among living donor transplants. There are some reports that suggest HLA matching may not be as important in living donor kidney transplantation as it is in deceased donor kidney transplantation. A recent retrospective analysis matched 83 0-HLA mismatches to 407 controls with more than 0 HLA mismatches in living donors; the authors reported that 0-HLA mismatch did not confer improved death-censored graft survival and patient survival.7 In another study, while HLA-DR mismatch was a risk factor for acute rejection, HLA mismatch did not increase the risk of allograft loss or patient death.5 Moreover, the adjusted 5-year allograft survival rate for unrelated living kidney transplantation was similar to the haploidentical living donation.2 Thus, the role of HLA in living allograft survival is not clearly defined. We and others have demonstrated the importance of HLA matching in deceased donor kidneys and now we want to examine this among living kidney donation. Our aim was to define a mathematical model that will allow us to quantify the effect of HLA matching in living donor kidneys and to compare our results with HLA mismatch in kidney allografts from deceased donors, as previously published.10 We furthermore use these data (HLA mismatch and donor source) along with donor age in a fully adjusted Cox regression to show the hazard ratios (HR) associated with each permutation.
MATERIALS AND METHODS
Patient level data from the United Network for Organ Sharing (UNOS) Standard Transplant Analysis and Research database and included all first, living donor, kidney-only transplants in adults (age ≥18 years) stratified by UNOS region from October 1, 1987, to December 31, 2013.10,11 Living donor kidney allograft survival was censored at the last recorded examination, at the start of renal replacement therapy, or at death. Patients with a functioning living donor kidney at death were included in the study.
Variable Definitions
Variables are defined in Table 1. Categorical variables were created with unknown or missing values imputed by regression. The variables include, for all living donors, donor and recipient ages in year-quartiles. Variables transplant era, recipient sex, donor sex, recipient ethnicity, recipient education level, recipient body mass index (BMI), donor BMI, recipient working for income before transplant, recipient dialysis type, recipient drug treatment for chronic obstructive pulmonary disease (COPD), induction and immunosuppression therapies at discharge, and HLA mismatch were defined as previously described.10 There were 5 new categorical variables. The first is recipient >median years on dialysis. A new categorical variable was constructed from the 2 levels of donor source, living related (LR) and living unrelated (LU) combined with the 7 levels of HLA mismatch, 0 to 6. Therefore, there are 14 (2 × 7) values in the variable which we have given the labels TM01 to TM14. Variable days-waiting-for-a-transplant is categorical in quartiles. Two additional categorical variables were designed to be used with the entire sample of first adult kidney transplants. The first defines 7 values based on the 0-mismatch category: 0 mismatched full siblings, 0 mismatched deceased, 0 LR, and 0-LU; and >0 mismatched for deceased, >0 LR, and >0 LU. The second categorical variable combines the 3 donor strata and 7 HLA mismatches into (3 × 7) 21 values with 0-mismatched deceased donors as the reference.
TABLE 1.
Baseline data for 66 596 adult first kidney transplants from living donors by HLA mismatch, 1987 to 2013a,b

Statistical Methods
All analyses were conducted using SAS Institute software version 9.3.12,13 The primary explanatory variable was the number of HLA mismatches (0-mismatch reference). Cox proportional hazards regression analyses for the reduced and full models were performed as previously described.10 Each variable was tested for the proportional hazard assumption by ordinary least squared regression of the Schoenfeld residuals on kidney survival time.12 The goodness of fit of the full proportional hazards model was tested with the cumulative sums of the martingale-based residuals.14,15
For the all living donors, we sorted the 66 596 records by risk score and divided them into 33 groups while using the 33rd group as reference. For the combined deceased and living donor strata with 255 737 transplants, we divided them by risk score into 125 groups while using the 125th group as the reference. Then, for both living and combined samples, we calculated the expected number of events using the martingale residuals, the z score for each group, and tested the fit of the z score distribution to a N(0,1) normal distribution. Individual permutations of HLA-A, B, and DRB1 mismatch were represented in triples with the format [A, B, DRB1] in which each locus can take one of the integers 0, 1, or 2. Therefore there are (3 × 3 × 3) = 27 permutations in the categorical variable. Equality of the HRs of the within mismatch category permutations was tested by creating index variables (0,1) for each triple, including the 26 variables in the full model of the Cox regression with at least 1 mismatch, and then comparing all permutations within a category.10,12 Adjustment of the P values was calculated by the sequential Holm-Bonferroni procedure.10,16
A linear model was fitted to the mismatches and the HRs using the algorithm that was previously described.10 Confidence intervals (CIs) for the number of years receiving dialysis before transplant were calculated by the bootstrap procedure while using 1000 samples with replacement (b=1000).
RESULTS
Living Donor Cohort
Between October 1, 1987, and December 31, 2013, the data included a total of 66 596 first kidney alone transplant records in adults with complete data from living donors, with a total of 348 960 years of kidney allograft follow-up time. Mean follow-up was 5.24 years with a Quartile 1 (Q1) of 1.97 years, median of 4.18 years, and Q3 of 7.79 years. The maximum survival of a living-donor kidney was 25.22 years. There were 26 219 female and 40 377 male recipients with a mean age at transplant of 46.7 years; 40 596 allografts came from persons genetically related to the recipient, whereas 26 000 donors were genetically unrelated. Projected median survival for the living kidneys was 24.4 years compared to 18.0 years for organs from deceased donors, as previously published (Figure S1, SDC, http://links.lww.com/TXD/A36).10 Median years on dialysis before transplant for all living donor organs was 0.96 years (0.93-0.98), whereas for LR and LU strata, the respect values were 0.93 years (0.90-0.96) and 0.94 years (0.91-0.98).
Table 1 presents the distribution of the variables stratified by number of HLA mismatches in the living donor sample. There were 39 844 female and 26 752 male donors with a mean age of 40.8 years. Non-Hispanic whites constituted the largest category of recipients—42 951—more than 4 times number of the next largest group, non-Hispanic blacks— 10 479. Recipients educated past high school were the majority, 43 096 in the sample, whereas 23 500 persons had high school or less.
Deceased Plus Living Cohort
Between October 1, 1987, and December 31, 2013, the data included 255 737 first kidney-alone transplant records in adults with complete data, with a total of 1 343 518 years of kidney allograft follow-up time. There were 100 268 female participants and 155 469 male recipients with a mean age at transplant of 49.0 years. Among donors, there were 115 364 women and 140 373 men with a mean age of 37.7 years. Non-Hispanic whites constituted the largest category of recipients—139 598—more than twice the number of the next largest group, non-Hispanic blacks—66 376. Recipients with a high school education or less were the majority in the sample, whereas 83 192 persons were educated past high school.
Test of the Goodness-of-Fit for the Full Cox Multivariate Proportional Hazards Models
For the living donor cohort in the full Cox model, the proportional hazard assumption was valid for each of the 15 variables in an ordinary least squared regression of the Schoenfeld residuals on kidney survival time (Table S1, SDC, http://links.lww.com/TXD/A36). The test of the goodness of fit of the proportional hazards model produced the expected normal Z distribution with a mean of 0.0 and standard deviation of 1.0 (Table S2, SDC, http://links.lww.com/TXD/A36; Figure S2, SDC, http://links.lww.com/TXD/A36).
For the combined deceased and living cohort, we used 18 covariates with the primary explanatory variable HLA mismatch in the full model Cox regression with the 255 737 first adult kidney allografts for all donor strata. We found that the variables comply with the proportional hazards assumption and that the full model for the Cox regression was well specified (Tables S3 and S4, SDC, http://links.lww.com/TXD/A36; Figure S3, SDC, http://links.lww.com/TXD/A36).
Impact of Number of HLA Mismatches on Living-Donor Kidney Allograft Survival
For the living donor allografts, including LR and LU, the Cox multivariate regressions were calculated for both the reduced (Table S5, SDC, http://links.lww.com/TXD/A36) and full model (Table 2). In fully adjusted analyses of 66 596 living donor transplants there was a 44% higher risk (HR, 1.44; 95% CI, 1.27-1.64) of allograft failure for 1 mismatch and more than twice the risk (HR, 2.12; 95% CI, 1.89-2.37) for 6 mismatches (Table 2) (covariate results for the full model, for all living donors, are presented in Table 3.)
TABLE 2.
HR for risk of allograft failure by HLA mismatch with 0 mismatch as the reference among adult (age ≥18 years), first kidney only transplant recipients receiving organs from living donorsa,b

TABLE 3.
Covariate results for full Cox regression model with HLA mismatch as the primary explanatory variable for all first adult kidney allografts from all living donors
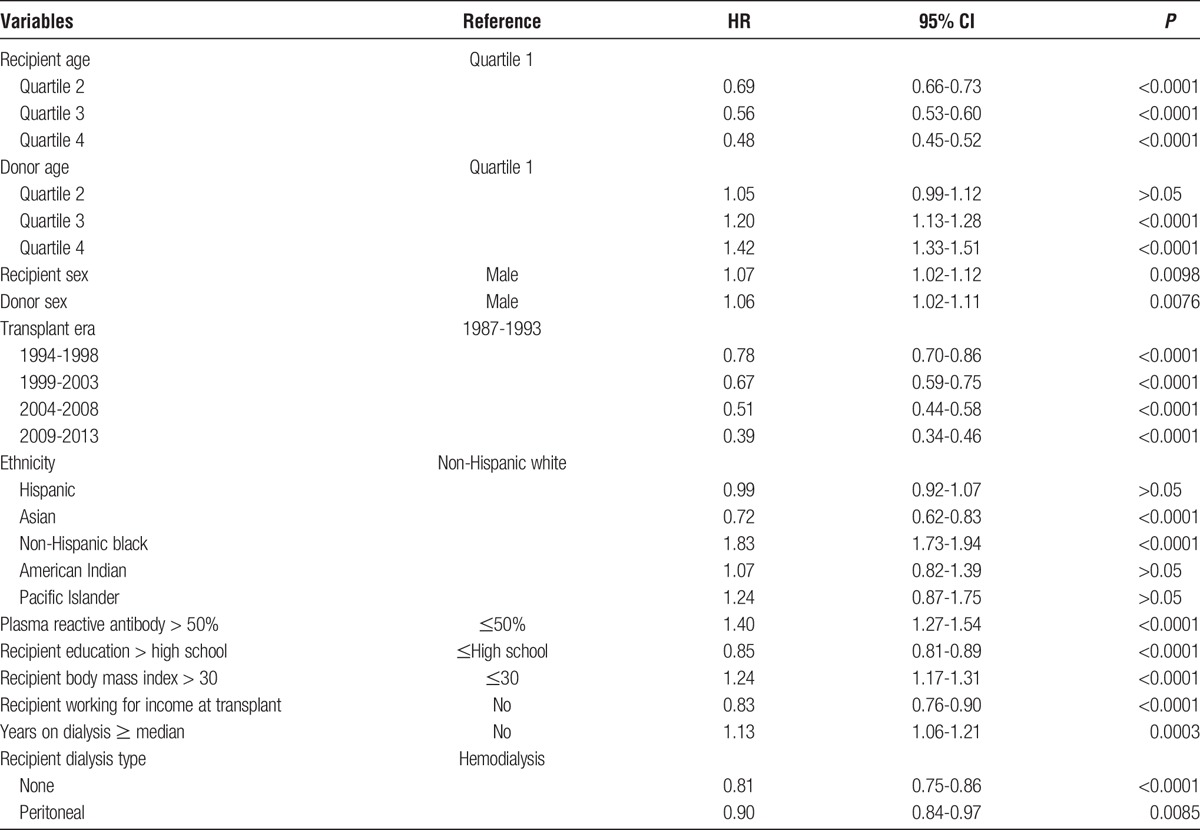
In fully adjusted analyses of 40 596 LR donor transplants, there was nearly an identical result: 42% higher risk (HR, 1.42; 95% CI, 1.24-1.62) of allograft failure for 1 mismatch and more than twice the risk (HR, 2.03; 95% CI, 1.73-2.38) for 6 mismatches. In fully adjusted analyses of 26 000 LU donor transplants, there was a 79% higher risk (HR, 1.79; 95% CI, 0.86-3.76) of allograft failure for 1 mismatch as compared with 0 mismatch, which did not obtain statistical significance while a 2.57 (1.43-4.61) fold higher risk was observed for 6 mismatches.
Linearity of the HRs in Living Donor Allografts
For all living donors, the Cox regressions appeared to increase the HR associated with HLA mismatch in a linear fashion. To test this, we fitted a line to the data in both the reduced and full models; for the reduced model, the slope is 0.15 (95% CI, 0.04-0.26) with an intercept of 1.31 (0.92-1.70), whereas for the fully adjusted regression, the slope is 0.15 (0.06-0.24) with an intercept of 1.28 (0.94-1.61) (Figure 1). When lines were fitted to the models for the LR donors, the reduced model has a slope of 0.21 (0.10-0.31) and an intercept of 1.21 (0.91-1.51), whereas the full model has a slope of 0.19 (0.09-0.29) and an intercept of 1.20 (0.92-1.48) (Figure 2). LU allografts represent the smallest stratum in the analysis and have a slope for the reduced model of 0.16 (0.04-0.28) with an intercept of 1.41 (0.84-1.98), whereas for the full Cox regression HRs, the slope is 0.16 (0.04-0.29) with an intercept of 1.47 (0.90-2.03) (Figure 3). In Figure 4, the lines fitted to the 2 strata of relatedness are graphed with that for deceased donors, as previously reported.10 The penalty in HR for HLA mismatch appears to be least for deceased donors, more for the LR fitted line, and largest for the LU stratum.
FIGURE 1.
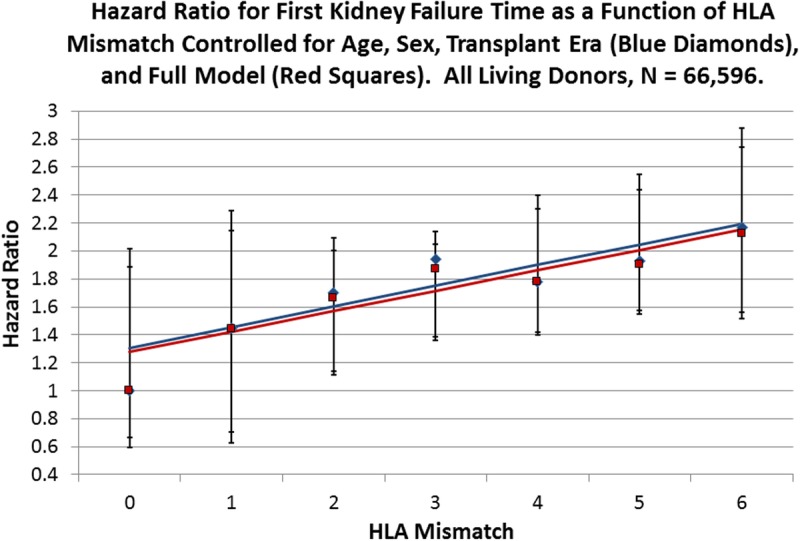
Cox multivariate regressions were performed with the survival time of kidney allografts from living donors as the dependent variable and HLA mismatch as the primary explanatory variable with 0 mismatch as the reference. Blue diamonds represent the observed HRs for HLA mismatch for a reduced model with age, sex, and transplant era as covariates (Table S5, SDC, http://links.lww.com/TXD/A36), whereas the red squares represent the observed HR values for the full model as presented in Table 2. The solid blue line is the fitted line for the reduced model with an intercept of 1.31 (0.92-1.70; P = 0.0003) and a slope of 0.15 (0.04-0.26; P = 0.0161), whereas the red line is fitted to the full model observed values with an intercept of 1.28 (0.94-1.61; P = 0.0002) and a slope of 0.15 (0.05-0.24; P = 0.0096). Error bars are the 95% CI for the respective points on the fitted lines.
FIGURE 2.
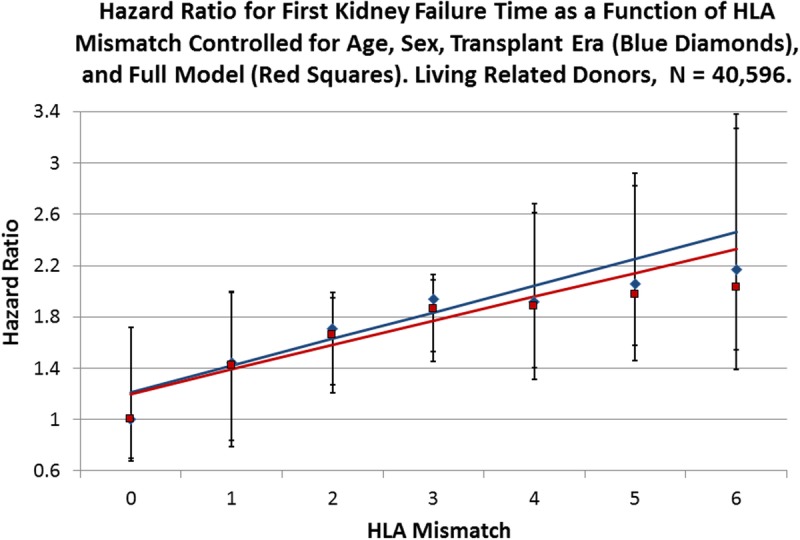
Cox multivariate regressions were performed with the survival time of kidney allografts from LR donors as the dependent variable and HLA mismatch as the primary explanatory variable with 0 mismatch as the reference. Blue diamonds represent the observed HRs for HLA mismatch for a reduced model with age, sex, and transplant era as covariates (Table S5, SDC, http://links.lww.com/TXD/A36), whereas the red squares represent the observed HR values for the full model (Table 2). The solid blue line is the fitted line for the reduced model with an intercept of 1.21 (0.91-1.51; P = 0.0002) and a slope of 0.21 (0.10-0.31; P = 0.0037), whereas the red line is fitted to the full model observed values with an intercept of 1.20 (0.92-1.48; P = 0.0001) and a slope of 0.19 (0.09-0.29; P = 0.0043). Error bars are the 95% CI for the respective points on the fitted lines.
FIGURE 3.
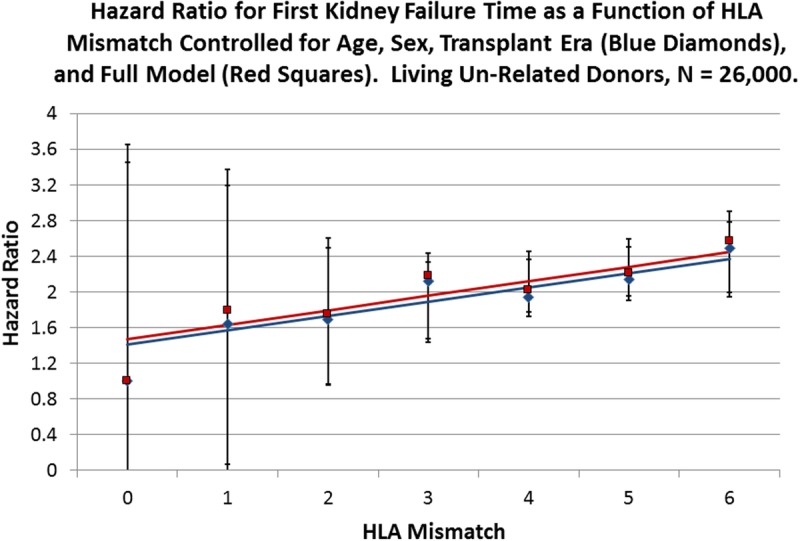
Cox multivariate regressions were performed with the survival time of kidney allografts from LU donors as the dependent variable and HLA mismatch as the primary explanatory variable with 0 mismatch as the reference. Blue diamonds represent the observed HRs for HLA mismatch for a reduced model with age, sex, and transplant era as covariates (Table S5, SDC, http://links.lww.com/TXD/A36), whereas the red squares represent the observed HR values for the full model (Table 2). The solid blue line is the fitted line for the reduced model with an intercept of 1.41 (0.84-1.98; P = 0.0014) and a slope of 0.16 (0.04-0.28; P = 0.0213), whereas the red line is fitted to the full model observed values with an intercept of 1.47 (0.90-2.03; P = 0.0011) and a slope of 0.16 (0.04-0.29; P = 0.0194). Error bars are the 95% CI for the respective points on the fitted lines.
FIGURE 4.
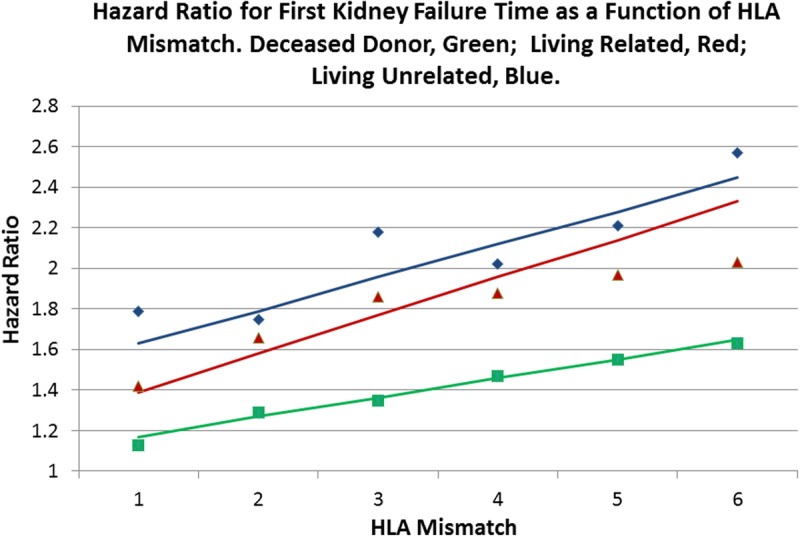
Fully adjusted Cox multivariate regressions for kidney allograft failure time were performed when stratified by kidney allograft origin: deceased (green),10 LR (red), and LU (blue). HLA mismatch is the primary explanatory variable with 0 mismatch as the reference (Table 2). The solid line of the respective color is fitted to the observed points weighted by the number in each mismatch category for that stratum. Although kidneys from living donors survive longer than do those from deceased donors, the LU donor HRs for HLA mismatches are greatest, which suggests that there is a greater penalty in survival for mismatching a LU donor kidney when compared with a LR donor, and that the survival mismatch penalty is greater for living donors when compared with deceased ones.
Individual Permutations of HLA Mismatch in Living-Donor Transplants
To examine the individual effect of the 3 HLA loci independently, a categorical variable representing the 27 ordered triple permutations of mismatch at HLA-A, -B, and -DR was created and incorporated into the full Cox model with triple [0, 0, 0] as the reference for all living kidney donors (Table S6, SDC, http://links.lww.com/TXD/A36). For all living donor allografts, only 4 permutations were not significantly different from the reference HR of 1.0: [0, 0, 2], [2, 0, 0], [1, 2, 0], and [2, 0, 1]. The remaining 22 triples had HRs significantly larger than 1.0. These results suggest that nearly every permutation of HLA mismatch is important in contributing to the risk of allograft failure for kidneys from living donors.
HLA-A, -B, and -DRB1 Have Equal Roles in the Failure of Living-Donor Allografts
To test the equality of the effect of each permutation within mismatch categories 1 to 5, index variables were created for 26 triples with at least 1 mismatch and then incorporated into the full Cox Regression for all living donors and when stratified by relatedness. There were 57 comparisons overall and in each stratum (Table S7, SDC, http://links.lww.com/TXD/A36). After correction of the P values with the Holm-Bonferroni procedure, there were no statistically significant tests. This implies that, within mismatch categories 1 to 5, all single HLA mismatches have equal effect irrespective of the locus where the difference appears.
The Interaction of Relatedness and HLA Mismatch
To control for the confounding effect of relatedness and to maximize the power in the Cox regression, a new categorical variable with 14 values, each of which combined 1 level of relatedness and 1 level of HLA mismatch, was created. LR 0 mismatch was the reference (Table 4). For a LR donor with 1 mismatch, there is a 43% higher risk of allograft failure, whereas with 6 mismatches, it is more than double the risk. A similar pattern is seen in LU allografts; with 1 mismatch, there is a 52% increased risk of failure, with marginal statistical significance (P = 0.0798), and more than twice the risk with 6 mismatches (2.14; 1.89-2.42); P <0.0001). A weighted linear regression was performed for HRs within HLA mismatch categories 0-6 with a slope of 0.14 (0.09-0.20) and an intercept of 1.27 (1.07-1.47) (Figure 5, Figure S4, SDC, http://links.lww.com/TXD/A36). When compared with the fitted regression for all allografts from deceased donors, the living donor line had a higher slope and intercept (Figure 5). Figure 6 illustrates the distribution of HLA mismatches stratified by relatedness, which is skewed to the right with relatively small numbers of allografts in categories 0 to 2 for the LU sample (Table 1).
TABLE 4.
Interaction of HLA mismatch and donor relatedness in a fully adjusted Cox regression for first kidney allograft survival from living donorsa

FIGURE 5.
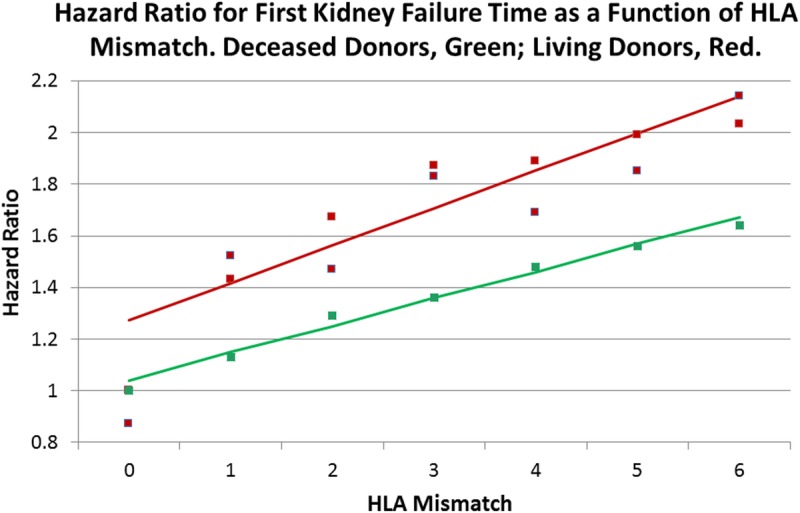
A weighted regression line (red) was fitted to the HRs (red squares) in Table 4, a categorical variable that was constructed to combine the relatedness strata with HLA mismatch. The predicted line has an intercept of 1.27 (1.07-1.47; P <0.0001) and a slope of 0.14 (0.09-0.20; P < 0.0001). This slope is similar to the fully adjusted line of Figure 1 for all living donors and lies above the line for deceased donors, as previously described.10 Therefore, there is a higher penalty in kidney failure time for each HLA mismatch for a living donor as opposed to an organ from a deceased donor.
FIGURE 6.
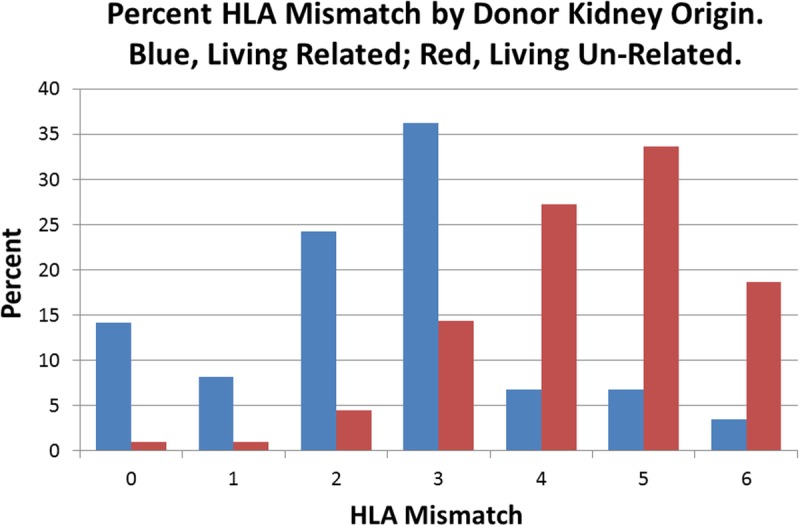
The distribution of HLA mismatches stratified by relatedness of the donor, for all living donors, is skewed to the right for the LU stratum because there are relatively small numbers of living donors in categories 0 to 2 (Table 1). Given that the LU 0 and 1 mismatch categories were not significantly different from the LR 0-mismatch category in the full Cox regression, improving the numbers of persons in these categories could potentially increase overall survival in the unrelated sample.
Quantifying the Survival Advantage of Allografts From Living Donors
To parse the effect of the “living component” in the better survival of living donor kidneys when compared with deceased donor kidneys, a new categorical variable was created for the entire UNOS data set of 255 737 first kidney allografts between 1987 and 2013 that included kidneys from all sources. Full siblings with HLA 0 mismatch were chosen as the reference in the fully adjusted Cox regression (Table 5, Figure 7).
TABLE 5.
Cox regression of all first adult kidney allografts 1987-2013 that compares 0-mismatch categoriesa
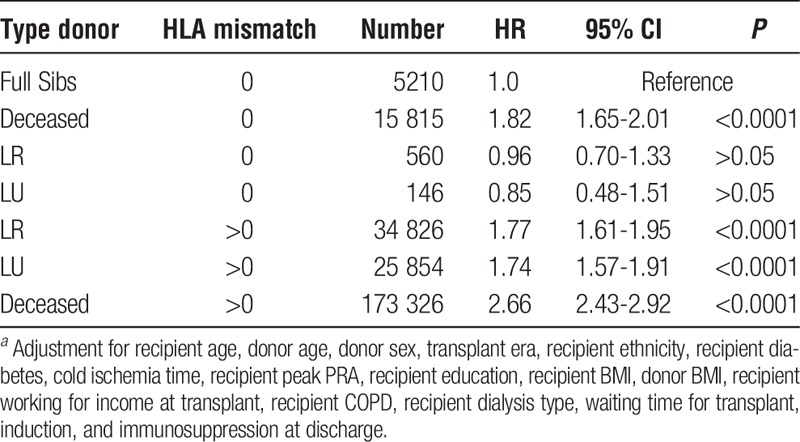
FIGURE 7.
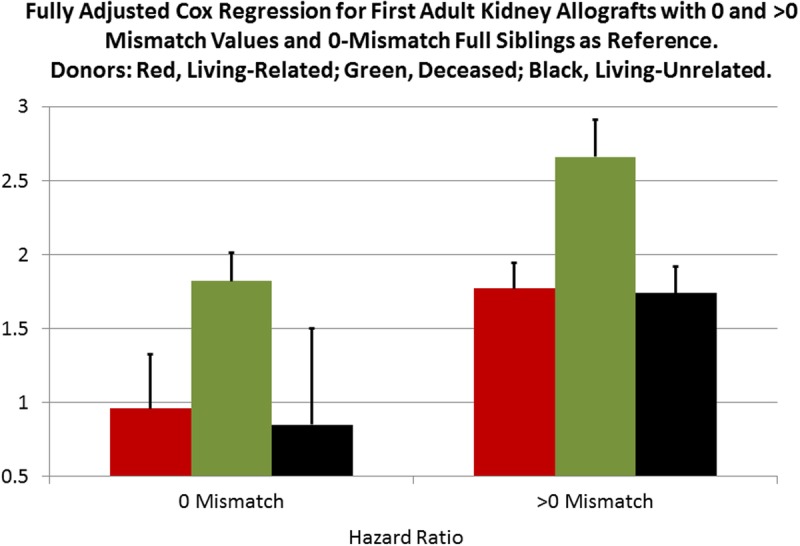
To parse the “living component” for increased kidney survival a new categorical variable with 7 values was created (Table 5). With 0-mismatched full sibling transplants as a reference the magnitudes of the HRs in a full Cox multivariate regression allowed us to estimate a reduction of approximately 34% in the risk of kidney failure for living donations with more than 1 mismatch. This is illustrated by the higher green bars for the deceased donor strata. See text for details.
LR and LU 0-mismatched allografts had an HR not significantly different from 0-mismatched full siblings. For the categories with 1 or more mismatches, the LR and LU allografts have similar HRs, 1.77 and 1.74, respectively, whereas the deceased donor kidneys have an HR of 2.66. Therefore, when compared with 0-mismatched full siblings, the “living component” of the donor allograft reduces the hazard of kidney allograft failure by approximately 34%: reduction = [1.0 - (1.76/2.65)] × 100.
Combining Deceased and Living Donor Strata Increases the Power of the Analyses
To take advantage of the combined deceased and living data set of first adult kidney allografts, a Cox regression was performed with HLA mismatch as the primary explanatory variable with 0 mismatch as the reference (Table 6, Figure 8). Eighteen covariates, each of which can affect the survival of kidney allografts, were included in the models. Each additional mismatch category is strongly associated with increasing hazard of graft failure in both the reduced and full model Cox models. In addition, each of the 27 permutations of HLA-A, -B, and -DR mismatch was significantly associated with increased graft failure when compared with the triple [0, 0, 0] with P <0.0001 (Table 7).
TABLE 6.
HR for risk of allograft failure for HLA mismatch with 0 mismatch as the reference among adult (age ≥18 years), first kidney only transplant recipients
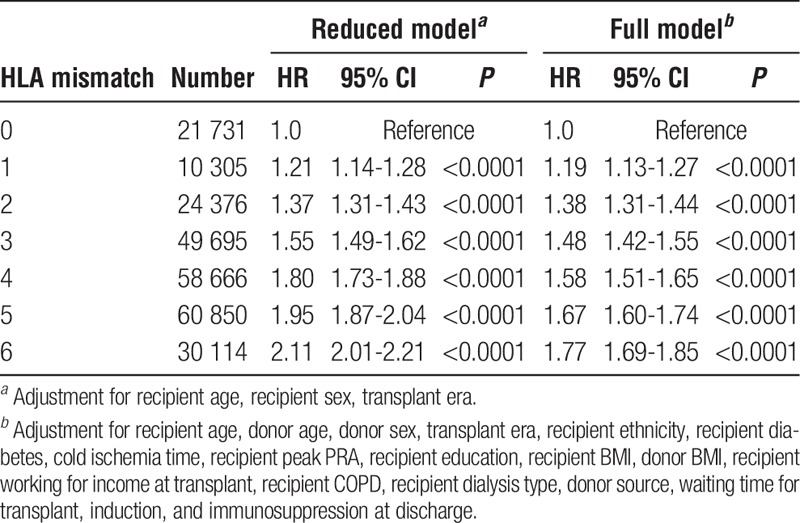
FIGURE 8.
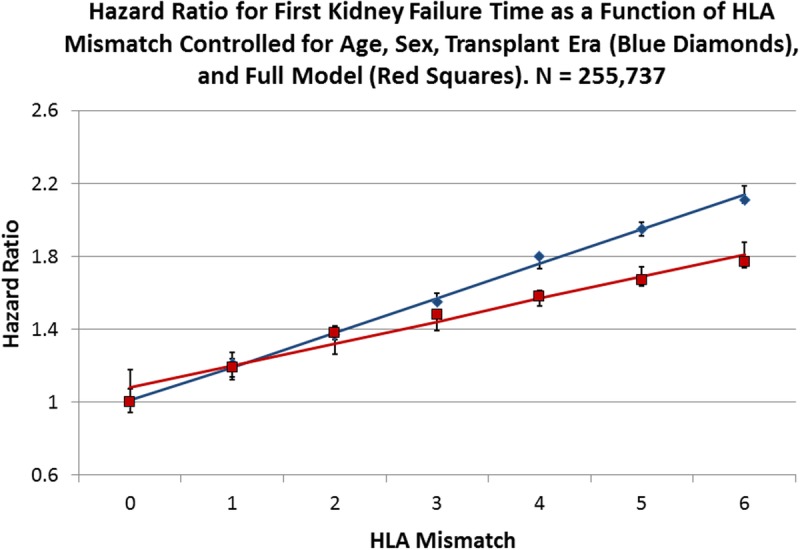
Cox multivariate regressions were performed with the survival time of kidney allografts as the dependent variable and HLA mismatch as the primary explanatory variable with 0 mismatch as the reference. Blue diamonds represent the observed HRs for HLA mismatch for a reduced model with age, sex, and transplant era as covariates, while the red squares represent the observed HR values for the full model (Table 6). The solid blue line is the fitted line for the reduced model with an intercept of 1.01 (0.94-1.07; P < 0.0001) and a slope of 0.19 (0.17-0.21; P < 0.0001), whereas the red line is fitted to the full model observed values with an intercept of 1.08 (0.98-1.18; P < 0.0001) and slope of 0.12 (0.10-0.15; P < 0.0001). Error bars are the 95% CI for the respective points on the fitted lines.
TABLE 7.
HR for risk of allograft failure for HLA mismatch triple among adult (age ≥18 years), first kidney only transplant recipients (N=255 737)a
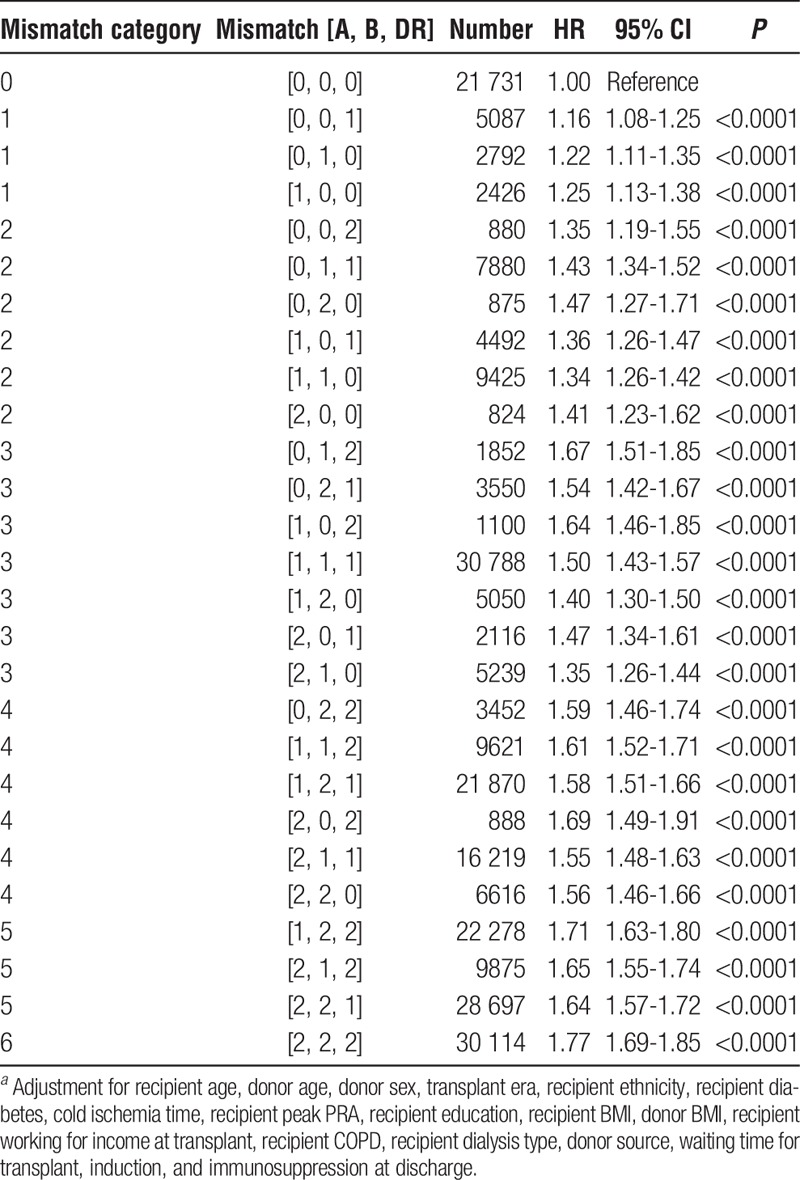
The 27 mismatch triples can be used to test the within mismatch category differences of paired permutations of which there are 57 (Table S8, SDC, http://links.lww.com/TXD/A36). Only 2 of the tests reached statistical significance, when comparing triples [0, 1, 2]:[2, 1, 0] (P = 0.0001) and [1, 1, 1]:[2, 1, 0] (P = 0.0008) in mismatch category 3. Both were less than the adjusted P value of 0.0009.
Performing the Full Cox Regressions Within 5-Year Periods
To address the question of whether HLA mismatch has had a declining effect on allograft survival during the present study, the full Cox regression was run within each of the 5-year categories that were included as covariates (Table 8, Figure 9). A weighted linear regression was fitted to each set of HRs with 95% CIs for each HR for the latest period, 2009 to 2013. The low slope of the line, 0.079, for the latest time suggests that there is a smaller effect of HLA mismatching in the latest period, even though the linear fit of the regression line is highly significant (P <0.001), which implies that HLA mismatch is still important. However, when the years of follow-up time per person and the slopes of the fitted lines were plotted together (Figure 10), the incomplete information in the period 2009 to 2013 suggests that the decreasing effect of HLA in the latest data is still an open question.
TABLE 8.
Weighted linear regressions of HRs on HLA mismatch when stratified by 5 year periods

FIGURE 9.
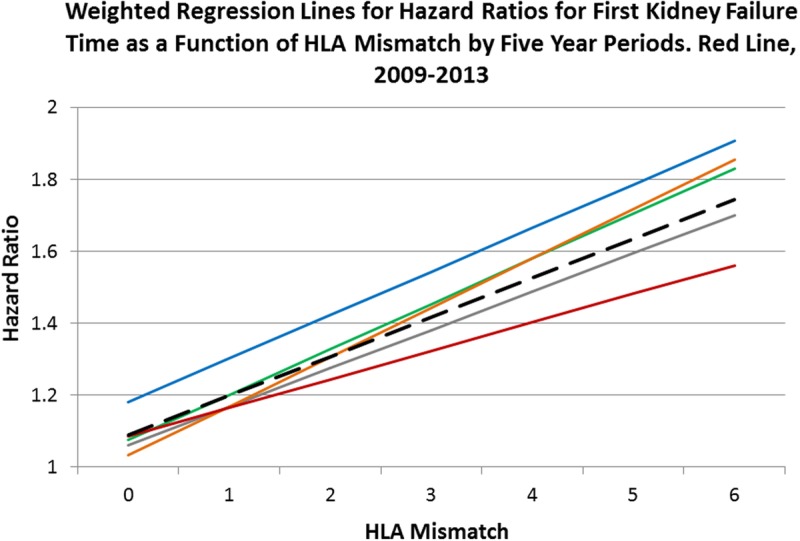
Full model Cox multivariate regressions were performed within each 5-year period with HLA mismatch as the primary explanatory variable: 1987-1993, blue line; 1994-1998, green; 1999-2003, gray; 2004-2008, orange; and 2009-2013, red. The fitted lines are from a weighted regression within each period. The dashed black line is the weighted regression line over all 35 HRs. Each line has a statistically significant intercept and slope (Table 8). The HRs for the latest period are less than for the earlier ones in mismatch categories 4 to 6 and might reflect the combination of better immunosuppression and the use of living donor organs. However, because of the limited sample size and much smaller follow-up time per person for this interval, this result should be viewed with caution. See Figure 10.
FIGURE 10.
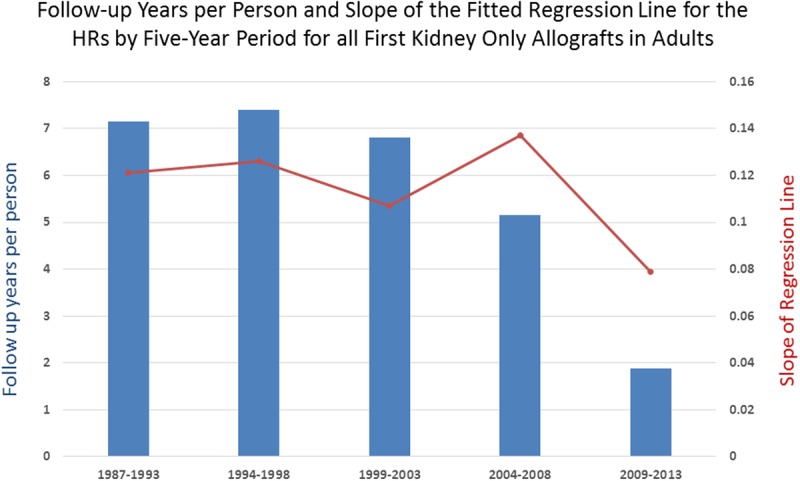
The follow-up years per person was calculated for each of the 5-year periods in our time covariate and plotted against the slopes of the weighted fitted regression lines on the HRs within each period. Although the slope of the latest period, 2009-2013, is least, and might suggest that the effect of HLA matching is becoming less important, this is also the period in which the follow-up time is least, 1.87 years per person. The accuracy of the HRs for HLA matching, as all covariates in a Cox multivariate regression, are sensitive to sample size and follow-up time. Therefore, the stronger effect of HLA, which is apparent in the earlier periods, might very well be present with a higher slope when more data are available.
The Interaction of HLA Mismatch With Donor Source
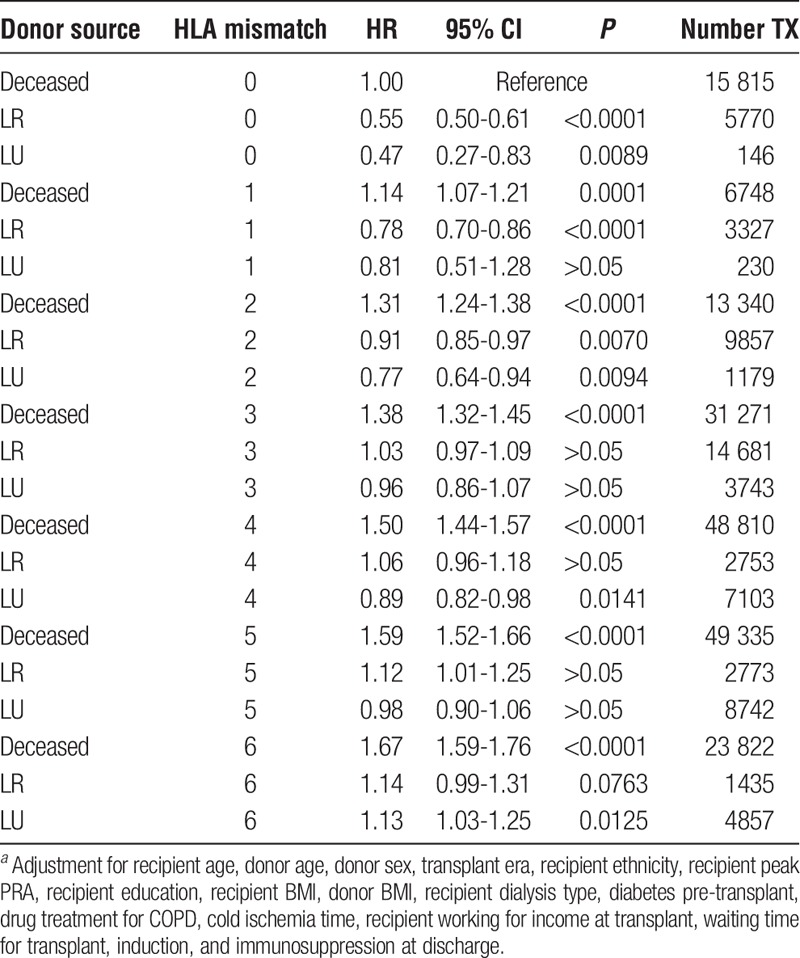
Using the entire data set of first adult kidney transplants, we incorporated a categorical variable with 21 values into a fully adjusted Cox regression to test the joint effects HLA mismatch and donor type (Table 9). The reference for the regression was organs from deceased donors with 0 mismatches. Within each mismatch category, living kidney allografts had lower HRs for failure than deceased kidney allografts with the identical number of mismatches. For example, any living kidney, related or unrelated with 3 mismatches, has a lower HR than a deceased kidney with 3 mismatches.
TABLE 9.
Cox regression of HLA mismatch stratified by donor sourcea
DISCUSSION
In this large cohort of adult US patients who received first kidney transplants from living donors in the years 1987 to 2013, we observed a significant linear adverse impact on allograft survival with each HLA mismatch. There is little difference between the line fitted to the reduced (adjusted only for recipient characteristics including age, sex, and transplant era) Cox model and that of the full model, which indicates that controlling for the additional covariates has little effect on the survival of living-donor kidneys. When compared with a similar line generated from deceased data, the allografts from living donors have a higher penalty in graft survival for HLA mismatches. Despite the HLA mismatch penalty, however, living-donor kidneys survive longer than those from deceased donors (Figure S1, SDC, http://links.lww.com/TXD/A36). Using data from all transplants, we also demonstrated that living donor kidney allografts are associated with 34% reduced risk of kidney failure compared with any deceased donor kidney among all organ recipients with 1 to 6 mismatches. We present Table 9 that summarizes the results of 25 years of first adult kidney transplantation and HLA mismatch.
Nearly Identical Slopes of Reduced and Full Models Imply Little Added Benefit of Covariates for Allografts From Living Donors
Among all living-donor allografts, there was a significant linear relationship among the 6 values of the HLA mismatch and kidney allograft failure (Table 2, Figure 1) in both the reduced and full model Cox regressions. Linearity shows that the risk of failure increases by the same amount for each mismatch of HLA. Furthermore, the magnitude of the slope of the line can be used to gauge the strength of HLA mismatches in kidney allograft failure. In addition, comparing the slopes of the reduced and full models quantifies the effects of the additional covariates. In the reduced and full Cox models, the slopes and the strength of HLA mismatches were nearly identical, about 0.15, with similar intercepts (baseline hazard for having a kidney transplant with allograft mismatch at 0). Therefore, the full model, with the additional ethnic, clinical, induction, and immunosuppression covariates, added very little to allograft survival (Figure 1).
This is also true when the data are stratified for relatedness (Table 2, Figures 2 and 3). It appears that the “living component” in these donor organs overwhelms the joint effects of the additional covariates in the Cox model and is responsible for the allografts' better survival. Under current clinical guidelines in most transplantation centers, the induction and immunosuppression protocols are the same for allografts from deceased or living donors. Our data suggest that, because of the better survival of living donor organs, and the collinear observations in Figure 1, a clinical protocol reflecting these differences might need to be designed for each type of allograft.
Assessing the Relative Impact of Donor Source and HLA Mismatch
A progressive increase is seen in the hazard of allograft failure with the number of mismatched HLA antigens when kidneys that come from 3 sources are compared. Kidneys from deceased donors are associated with the lowest impact of HLA mismatch; kidneys from LR donors are associated with an intermediate hazard from HLA mismatch; and kidneys from LU donors are associated with a high impact from HLA mismatch (Figure 4).
To further account for the effect of relatedness on HLA mismatch, we created a single categorical variable with 14 values that accounted for the confounding of relatedness and HLA mismatch (Table 4). We then fitted a regression line through the HRs in HLA mismatch categories 0 to 6 and compared it with the line for deceased donors10 (Figure 5). As expected, the slope was similar to one for all living donors in Figure 1, 0.14 for the variable that controls for relatedness in Figure 5 versus 0.15 for all living donors in Figure 1. However, the y-axis intercept (which tells the baseline risk of transplant when no mismatch is present) in Figure 5 is 1.27 (1.07-1.47), significantly different from 1.0. Therefore, the HRs for HLA mismatch in kidneys from living donors are always larger when accounting for relatedness, than for those from deceased donors in mismatch categories 1 to 6 when using 0-mismatch LR donors as the reference. There is a higher penalty in kidney survival for HLA mismatching a living-donor kidney.
0-mismatch VARIABLE Parses the "Living Component" for Increased Allograft Survival
Our results show that all 0-mismatch allografts, whether living or deceased, provide the recipient with long-term kidney survival, but living-donor kidneys survive longer on average than do allografts from deceased donors; the hazard of failure is smaller. Table 5 shows that when we divided all kidney donors, deceased and living, by 0 mismatch or more than 0 mismatch, and used full sibling 0-mismatch transplants as the reference, kidney allografts from living donors with 1 to 6 mismatches, when compared with deceased donors with 1 to 6 mismatches, reduced the risk of failure by approximately 34% in a full Cox regression incorporating all covariates (Figure 7). The results also showed that 0-mismatched kidneys from related donors, not full siblings, survived as long as those from full siblings, the reference. An additional surprising finding is that 0-mismatch allografts from unrelated living donors were equal in their survival to kidneys from related donors, which suggests an insignificance of mismatching for minor histocompatibility antigens. However, this could also be caused by the lack of power in this category because of the relatively small number of transplants (N = 146) when compared with the entire sample.
HLA Matching Is a Significant Covariate in Allograft Survival
Our purpose in this—and our previous article on deceased donor allografts10—was to investigate whether HLA mismatching was still important in the era of developing surgical, allocation, induction, and immunosuppression technologies. It is apparent that the answer is yes. For the reduced and full models for all transplants from living donors in Tables 2 and Table S5, SDC (http://links.lww.com/TXD/A36) and for the combined deceased and living donor sample represented in Table 6 and its breakdown into 27 permutations of HLA-A, -B, and -DRB1 mismatch in Table 7, each HR is significantly greater than 1.0, whereas the P value is less than 10-4. A potential criticism is that this is just the result of large numbers. However, we have shown that there is a linear increase in the HRs in our earlier work that is also found in Figures 1 to 3, and the entire data set in Figure 8 in which the observed HRs were nearly coextensive with the fitted lines. This pattern precludes randomness or simply a large sample effect. Similarly, in Table 7, all of the HRs are significantly greater than 1.0 and generally increase with the number of mismatches in the permutation. If merely large numbers were the reason for the high significance, such patterns would not be present. Further, the test of the within mismatch permutations in Table S8, SDC (http://links.lww.com/TXD/A36), combined with the linearity of the models in Figure 8, support our argument that each of the matched loci, HLA-A, -B, and -DRB1, are equally important in adding to the risk of organ failure.
An additional possible objection is that these findings are a result of including so much “old” data and that our pattern is not true in more recent times. In a response to a letter commenting on our article for deceased donors, we showed that the pattern in the most recent 5 years reflects the overall one seen before.10,17 We further explored this here by performing a fully specified Cox regression within each of the 5 periods in our time covariate, and then fitted a weighted regression line to each set of HRs and over all HRs (Table 8, Figure 9). The slope of the fitted line can be interpreted as a measure of strength of the effect of HLA mismatching on graft survival; the higher the slope, the greater the effect. The latest period, 2009 to 2013, has the lowest slope and might suggest that using more living allografts and better immunosuppression is lessening the effect of genetic mismatching. However, this can be misinterpreted because the amount of information in the latest period is much less than in the earlier ones. For the first 3 periods, the follow-up time per person is 7.15, 7.39, and 6.81 years per person, respectively. It decreases for period 4, 5.15 years per person, and for the latest period it is only 1.87 years per person (Figure 10). Therefore, the lower slope and implied lower effect of HLA mismatch may be incorrect and merely an indication that there is not enough information in the system to create accurate estimates. When more follow-up time enters the sample, the effect of HLA mismatching might very well reflect that of earlier years.
An Empirical Guide to Matching Recipient and Donor in First Adult Kidney-Only Transplantation
With the results from 255 737 first adult kidney transplants with 1 343 518 years of follow-up time, it is possible to summarize the hazard of kidney failure when taking into consideration HLA mismatch and donor type (Table 9). Alternatives, when available, are complex. For instance, what is better, the closely matched organ from a deceased donor or one from a living distant relative who is willing to provide an organ? Questions of matching can be better addressed when the total experience of 25 years of transplantation is summarized in a relatively simple table that compares the success of combinations of donors and recipients and that acts as a guide for clinical practice. Although we acknowledge that the degrees of freedom in HLA matching an allograft from a living donor are very limited, with current allocation policies, and that alternatives are not often available, Table 9 serves the additional function of making explicit the relationships between donor source and HLA mismatch.
In Table 9, each combination of donor source and HLA mismatch was simultaneously incorporated into the fully adjusted Cox model. We chose the combination of deceased donor with 0 HLA mismatches as the reference (HR = 1.0) because it has represented the criterion standard in deceased donor transplantation and plays an important role in allocation policy. In general, living allografts have smaller HRs then deceased allografts within a mismatch category. For instance, when there are 2 mismatches, living allografts have a significantly better survival than 0-mismatched deceased. In other words, any living donor kidney with 2 mismatches is significantly better than a kidney from a deceased donor with 0 mismatches. However, when there are 3 mismatches, the HRs for living allografts are not significantly different from the reference. Interestingly, many of the high mismatch LR and LU HRs were also not significantly different from the reference; for instance, LR, 6-mismatch kidneys have an HR of 1.14 (0.99-1.31), the confidence limits of which include 1.00. Therefore, the cumulative experience in transplantation usually makes a living relative or nonrelative with many HLA mismatches preferable or of equal value to a closely matched deceased donor.
Supplementary Material
Footnotes
Published online 7 April, 2017.
This work was supported by the Intramural Research Program of the NIH, The National Institute of Diabetes and Digestive and Kidney Diseases (NIDDK). It was also supported in part by Health Resources and Services Administration contract 234-2005-370011C.
The authors declare no conflict of interest.
R.C.W. is responsible for the design and performance of the statistical analysis, wrote the first draft, acts as corresponding author, and is responsible for the accuracy and integrity of the work. G.O. participated in the design of the analysis, revises the drafts, has final approval on the submission article, and is responsible for the integrity of the work. E.J.W. participated in the design of the analysis, particularly the categories for induction and immunosuppression and covariates, revises the drafts, has final approval on the submission of the article, and is responsible for the integrity of the work. C.M.G. participated in the design of the analysis and the creation of new variables and covariates, revises the drafts, has final approval on the submission of the article, and is responsible for the integrity of the work. H.C. provided the UNOS STAR files for the work, participated in the design of the analysis, particularly the categories for induction and immunosuppression and covariates, revises the drafts, has final approval on the submission of the article, and is responsible for the integrity of the work.
Supplemental digital content (SDC) is available for this article. Direct URL citations appear in the printed text, and links to the digital files are provided in the HTML text of this article on the journal’s Web site (www.transplantjournal.com).
REFERENCES
- 1.Opelz G. Impact of HLA compatibility on survival of kidney transplants from unrelated live donors. Transplantation. 1997;64:1473–1475. [DOI] [PubMed] [Google Scholar]
- 2.Davis CL, Delmonico FL. Living-donor kidney transplantation: a review of the current practices for the live donor. J Am Soc Nephrol. 2005;16:2098–2110. [DOI] [PubMed] [Google Scholar]
- 3.Delmonico FL, Sheehy E, Marks WH, et al. Organ donation and utilization in the United States, 2004. Am J Transplant. 2005;5:862–873. [DOI] [PubMed] [Google Scholar]
- 4.Park KS, Shin JH, Jang HR, et al. Impact of donor kidney function and donor age on poor outcome of living-unrelated kidney transplantation (KT) in comparison with living-related KT. Clin Transplant. 2014;28:953–960. [DOI] [PubMed] [Google Scholar]
- 5.Orandi BJ, Garonzik-Wang JM, Massie AB, et al. Quantifying the risk of incompatible kidney transplantation: a multicenter study. Am J Transplant. 2014;14:1573–1580. [DOI] [PubMed] [Google Scholar]
- 6.Muzaale AD, Massie AB, Wang MC, et al. Risk of end-stage renal disease following live kidney donation. JAMA. 2014;311:579–586. [DOI] [PMC free article] [PubMed] [Google Scholar]
- 7.Casey MJ, Wen X, Rehman S, et al. Rethinking the advantage of zero-HLA mismatches in unrelated living donor kidney transplantation: implications on kidney paired donation. Transplant Int. 2014;28:401–409. [DOI] [PubMed] [Google Scholar]
- 8.Orandi BJ, Luo X, Massie AB, et al. Survival benefit with kidney transplants from HLA-incompatible live donors. N Engl J Med. 2016;374:940–950. [DOI] [PMC free article] [PubMed] [Google Scholar]
- 9.Marlais M, Hudson A, Pankhurst L, et al. Living donation has a greater impact on renal allograft survival than HLA matching in pediatric renal transplant recipients. Transplantation. 2016;100:2717–2722. [DOI] [PubMed] [Google Scholar]
- 10.Williams RC, Opelz G, McGarvey CJ, et al. The risk of transplant failure with HLA mismatch in first adult kidney allografts from deceased donors. Transplantation. 2016;100:1094–1102. [DOI] [PMC free article] [PubMed] [Google Scholar]
- 11.United Network for Organ Sharing Data Collection Web Page. http://www.unos.org/donation/index.php?topic=data_collection. Accessed October 17, 2014.
- 12.Allison PD. Survival Analysis Using the SAS® System. Cary, NC: SAS® Institute, Inc.; 1995. [Google Scholar]
- 13.Walker GA. Common Statistical Methods for Clinical Research. Cary, NC: SAS® Institute, Inc.; 1997. [Google Scholar]
- 14.Lin DY, Wei LJ, Ying Z. Checking the Cox model with cumulative sums of Martingale-based residuals. Biometrika. 1993;80:557–572. [Google Scholar]
- 15.May S, Hosmer DW. A simplified method of calculating an overall goodness-of-fit test for the Cox proportional hazards model. Lifetime Data Anal. 1998;4:109–120. [DOI] [PubMed] [Google Scholar]
- 16.Holm S. A simple sequentially rejective multiple test procedure. Scand J Stat. 1979;6:65–70. [Google Scholar]
- 17.Williams RC, Opelz G, Weil EJ, et al. The risk of transplant failure with HLA mismatch in recent times. Transplantation. 2016; DOI: 10.1097/TP.0000000000001365. [DOI] [PMC free article] [PubMed] [Google Scholar]
Associated Data
This section collects any data citations, data availability statements, or supplementary materials included in this article.


