Abstract
Comparable taxonomic ranks within clades can facilitate more consistent classifications and objective comparisons among taxa. Here we use a temporal approach to identify taxonomic ranks. This is an extension of the temporal banding approach including a Temporal Error Score that finds an objective cut-off for each taxonomic rank using information for the current classification. We illustrate this method using a data set of the lichenized fungal family Parmeliaceae. To assess its performance, we simulated the effect of taxon sampling and compared our method with the other temporal banding method. For our sampled phylogeny, 11 of the 12 included families remained intact and 55 genera were confirmed, whereas 32 genera were lumped and 15 genera were split. Taxon sampling impacted the method at the genus level, whereas yielded only insignificant changes at the family level. The other available temporal approach also gives a similar cutoff point to our method. Our approach to identify taxonomic ranks enables taxonomists to revise and propose classifications on an objective basis, changing ranks of clades only when inconsistent with most taxa in a phylogenetic tree. An R script to find the time point with the minimal temporal error is provided.
Introduction
Conservative estimates of the number of species on this planet suggest that at least 8.7 million eukaryotes exist1, with the fungal kingdom alone forecast to contain several million species2. Overall, up to 100 million species are predicted to occupy the planet3. Regardless of the exact number, the sheer magnitude of species diversity requires a classification system that allows effective organization and communication of complex patterns of organismal diversity.
Beginning with Aristotle4, 5, organisms were classified according to their similarities. Linnaeus subsequently used a hierarchical classification and understood this pre-Darwinian “natural system” as a reflection of a divine plan of creation6, 7, as the idea of evolution was mostly alien to the scientists of the time4, 5. However, Linnaeus’ hierarchical classification system persisted and is still in use today. Attempts to develop non-hierarchical systems, such as a quinary system or a periodic system, were unsuccessful8.
In a phylogenetic context, taxonomic ranks in this hierarchical classification represent clades with a shared evolutionary history. Since members of a clade are derived from a common ancestor, they often share phenotypic traits. This helps explain why only seven years after Darwin’s seminal book, Haeckel could publish a tree of life, which reinterpreted the classification in a phylogenetic framework9. Taxonomic ranks in a hierarchical classification serve an important role for communication among biologists, and other disciplines, for comparative ecological, and conservation studies. However, it should be noted that these ranks are inherently arbitrary; hence there is no absolute definition of specific ranks, which partly explains disparities in ranking among classifications. Taxonomic circumscriptions of the same rank at varying phylogenetic scales lead to a number of potential biases when making comparisons among taxa. These discrepancies have been documented at higher-level taxonomic ranks, which have been shown to circumscribe vastly different phylogenetic scales in a number of cases8, 10–14. At the genus level, the current binomial system may lead to frequent name changes, thus making communication difficult and potentially adding confusion15–19. As a consequence, comparisons using higher-level ranks across different organismal groups are potentially flawed.
To make taxonomic ranks at supraspecific level more consistent and increase meaningful comparability among higher taxonomic ranks, the use of a standardized time of divergence has been suggested as a universal yardstick for the assignment of ranks8, 11–13, 20–22. This means that groups of organisms are given the same rank if they originated in the standardized geological time period.
In this study we use a method that employs time-calibrated chronograms to identify upper and lower thresholds for taxonomic ranks based on the temporal banding approach11, 13. To this end, we propose an extension of Holt and Jønsson’s Temporal Error Score20 to find an objective cut-off for each taxonomic rank, using the information from the current classification. To illustrate the utility of this temporal banding approach, we apply this modified approach to the most comprehensive phylogeny of the hyperdiverse lichen-forming fungal family Parmeliaceae. We briefly describe the temporal approach with Temporal Error Score20 and its computational limitations. Finally, we illustrate how the Temporal Error Score to can be used to find the time point with the minimal error to modify the current classification. Through simulation studies we assess the sensitivity of this method to taxon sampling. Further, we provide an R script to find the time point with the minimal temporal error with this proposed method.
Temporal inconsistency at the same taxonomic ranks
The chronogram used for the demonstration of this method was reconstructed from a multi-locus alignment, containing six markers (ITS, mtSSU, nuLSU, RPB-1, Tsr1, Mcm7) from 340 taxa representing 81 currently accepted genera23, 24. Due to a number of recent molecular phylogenetic studies on Parmeliaceae, the majority of the taxa are reciprocally monophyletic in this phylogeny25. Fifty-two additional taxa from ten related families26 were also included to determine the relationships among the families and to study the temporal inconsistency among the taxa of the same taxonomic ranks, particularly at the genus and family levels.
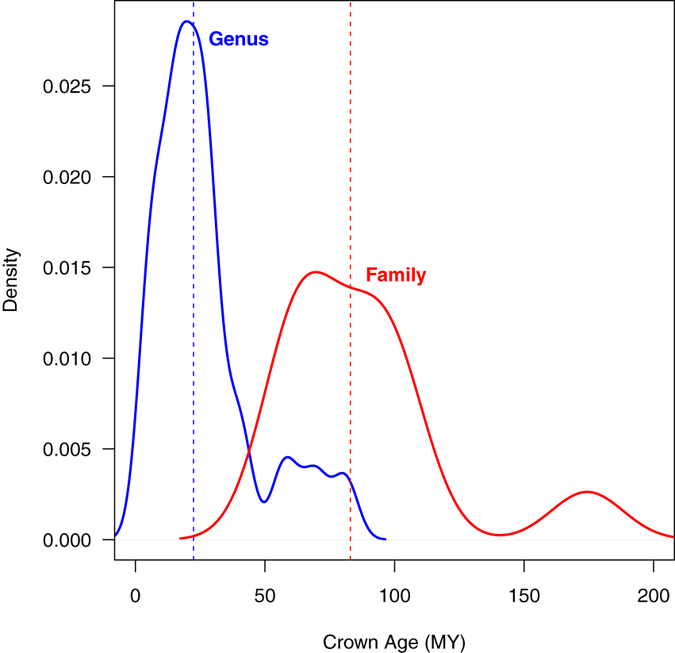
We used the function getMRCA in the R-package “ape” in order to find the crown age of currently accepted taxonomic groups and found that while the majority of genera and families in this cladogram are about the same age around the median (22 MY for genus and 83 MY for family), a fair number of taxa are far older or younger than the majority of clades (Fig. 1). As has been previously shown in different animal groups13, 20, the ranges of taxon ages overlapped between the genus and family ranks, making some of these taxonomic units not comparable even within the same family or order.
Figure 1.

Distribution of crown ages of currently accepted genera (blue) and families (red) in the studied data set (Parmeliaceae, Ascomycota). The median for both ranks indicated by a dashed line.
Temporal Error Scores
In an attempt to achieve temporally consistent classification, Holt and Jønsson proposed the Temporal Error Scores as a way to assess the amount of deviation from a single temporal cut-off20. The method requires that the tree has been dated (chronogram), and that each tip is assigned to a particular taxonomic group at each rank. This approach first finds the “empirical error” by calculating the difference between the cut-off point and the crown age of each currently accepted taxonomic group and summing it up as an error score. Then, since the empirical error is readily comparable to other scores, the “standardized score” is also calculated by dividing the empirical error with the score computed from random expectations, which are generated from splitting the tree randomly into the same number of monophyletic groups.
While this metric is useful for quantifying the error from the current classification, two issues make it difficult to apply this method with other systems. First, the temporal cut-off points were arbitrarily chosen to generate the roughly same number of monophyletic groups as the current classification, which may not serve as a good criterion, because the current taxonomic groups are also somewhat arbitrary, constantly subjected to either over-lumping or over-splitting. Second, the approach to generate random expectation can be computationally intensive and not readily reproducible. To address these issues, we extend the empirical error score to objectively select the cut-off point without the need to generate the random expectations.
Minimal Temporal Error Score
Using Holt & Jønsson’s code for taxonomic errors20, we applied a series of temporal thresholds from the tip (time = 0) to the root (the tree depth) and calculated an empirical error score at every 1 MY at both the genus and family levels. The temporal threshold with the minimum error score was then used as a cut-off point for the new classification with the temporal approach, in which we recognized all of the monophyletic groups that were more recent than the cut-off as individual taxa at that taxonomic rank. In cases where several time points produced the same error score, the average of those time points was used as a cut-off point. Because of inherently large confidence intervals at each node of the chronogram, we also calculated error margins around the cut-off point to allow some flexibility for reclassification, arbitrarily set to 5%. All of the procedures were performed in the statistical programming R. We also provided the R script to find the time point with minimal error, plot temporal banding on the chronogram, and reclassify based on the new time point on a data depository: http://dx.doi.org/10.5061/dryad.p8n72.
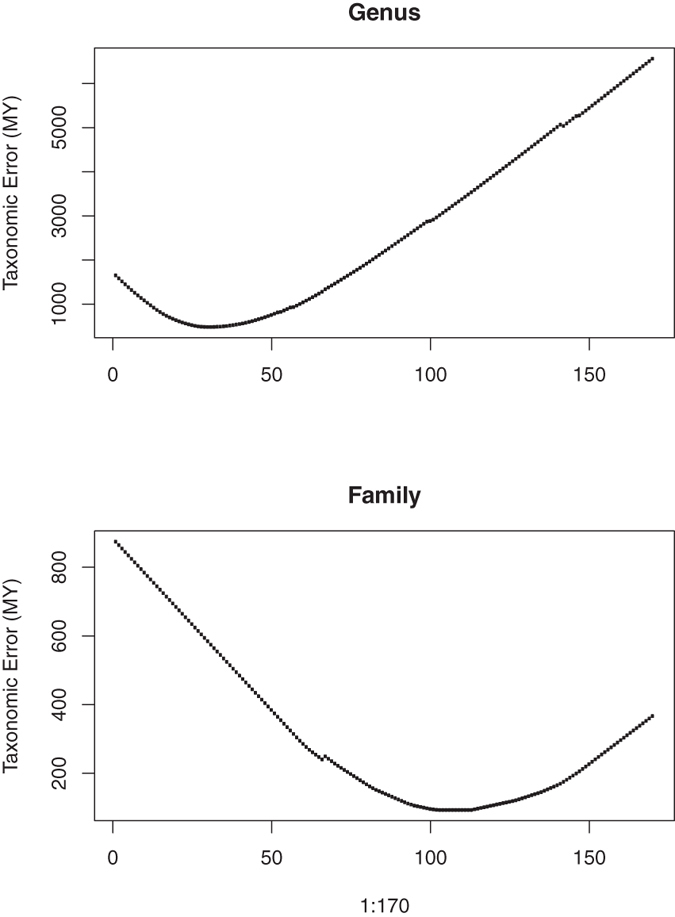
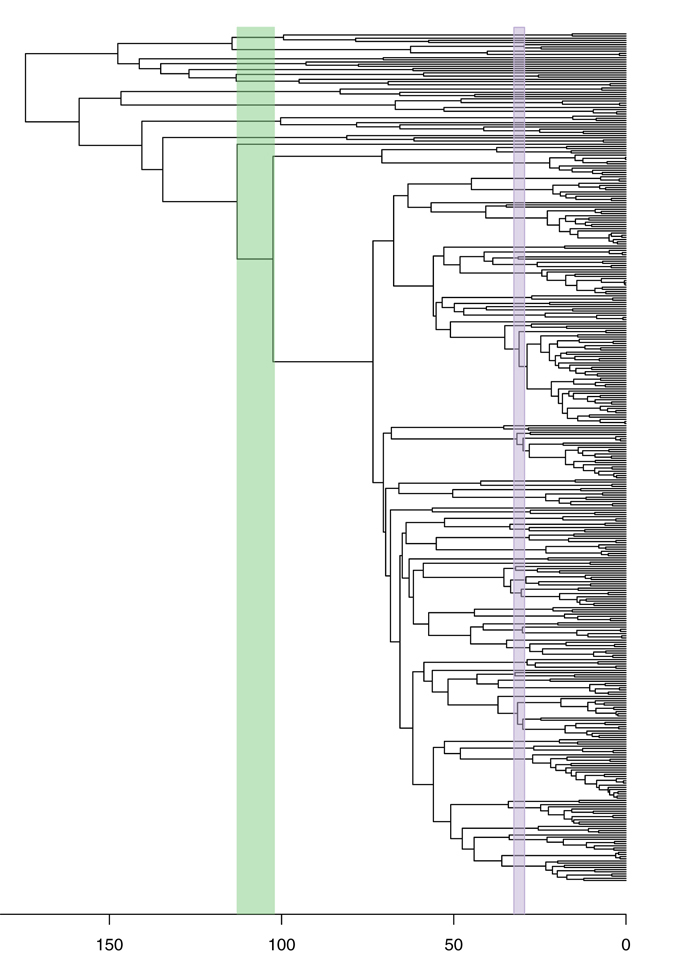
For our sampled phylogeny, the lowest empirical errors were found at 31 (29.45–32.55) and 107.5 (102.125–112.875) MY for the genus and family, respectively (Fig. 2). We then used the “cutree” function to reclassify the taxonomic groups, based on these time points. With the new cut-off point, 8 families remained intact with 2 families being split. For genera, 42 genera remain the same with 32 genera being lumped and 7 being split (Fig. 3; Supplementary materials). Details of the taxonomic changes are discussed in a companion paper in a mycological journal (manuscript in revision). Instead of using an arbitrary cut-off to maintain the number of taxonomic groups, here we provide a method to maintain the status of most taxonomic groups, while reclassifying the others, using the same age range within the same taxonomic rank.
Figure 2.

Distribution of empirical error score estimated from the tip (time = 0) to the root (the tree depth) for the genus level (A) and family level (B).
Figure 3.

Time-calibrated phylogeny of Parmeliaceae and related families based on a multi-locus data set. Temporal bands for family rank (green) and genus level (pink) indicated.
Sensitivity to taxon sampling
Taxon sampling poses a challenge to virtually all molecular phylogenetic studies, as it is not always possible to acquire data for every single taxon in a lineage. Since the topology and branch lengths of chronograms have been shown to be sensitive to the amount of taxa being included27, 28, temporal methods are likely to be affected by taxon sampling, as they rely heavily on branch lengths. In order to determine the sensitivity of this method to the amount of included taxa, we simulated reduced taxon sampling in our sample tree by randomly removing 10% to 50% of the tips from the tree with the function “drop.tip.” Then, we used our proposed method to find the cut-off point with the minimum lowest empirical error for each of the 500 simulations.
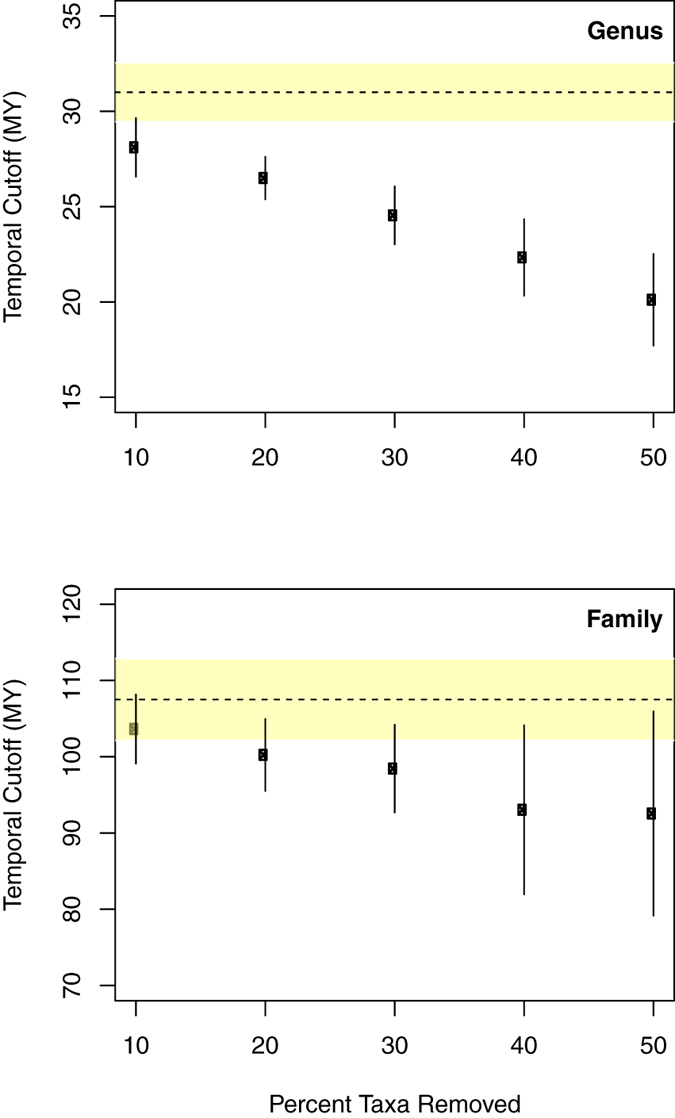
The simulation results showed that the cut-off time point changed and got younger as more taxa were removed from the tree (Fig. 4). However, for the family level, the one standard deviation around the average from the simulations still fell within the 5% error margin of the selected time point in the current data. For the genus level, the cut-off points from the simulations were clearly younger than the most comprehensive dataset currently available, even when considering the standard deviation. These results suggest that taxon sampling is critical for the application of this method for temporal classification, but more so at the lower taxonomic ranks, e.g. genus, whereas the higher taxonomic ranks appear less impacted by lower sampling efforts.
Figure 4.

Results of simulations to evaluate sensitivity of temporal banding to taxon sampling. Temporal cut-off indicated as dots (with standard deviation) in relation to amount of removal of taxa from the data set. (A) Temporal cut-off at the genus level. (B) Temporal cut-off at the family level.
Comparison with the Other Temporal Banding Method
Recently, Jønsson et al.29 proposed a temporal banding approach that aims to minimize the disruption to the current taxonomy. They developed the metric called “Percent Consistency” which calculates the percentage of the taxa remaining intact after applying a certain cutoff time. This method then chooses the best cutoff time that yields the highest percent consistency. We ran our data through their public available R code and compared the resulting classification and the cutoff time at the genus and family level. The results showed that the cutoff time for the genus level from the Jønsson et al. method (28 MY) was close to the lower end of the five-percent band from our method (29.45–32.55 MY), whereas the cutoff times for the family level were nearly identical (107.71 vs. 107.5 MY; Table 1). Our methods generally resulted in more changes in the assignment of genera and families than the Jønsson et al.’s method (Table 1). The discrepancy is due to our different metrics for choosing the optimal cutoff point.
Table 1.
Comparison of resulting new classification from the proposed temporal banding method and the method by Jønsson et al.29.
| Intact | Lumped | Split | Cutoff Time (MY) | |
|---|---|---|---|---|
| Genus level | ||||
| Proposed method | 55 | 32 | 15 | 31 (29.45–32.55) |
| Jønsson et al. | 71 | 25 | 5 | 28.01 |
| Family level | ||||
| Proposed method | 11 | 0 | 1 | 107.5 (102.125–112.875) |
| Jønsson et al. | 12 | 0 | 0 | 107.71 |
The Jønsson et al. method29 was specifically developed to maintain the current taxonomy, whereas our method relies on the calculation of temporal error scores and aimed more toward having comparable and temporally consistent taxonomic ranks. For many widely studied groups, such as mammals and birds, a temporal banding approach that minimize disruption to current taxonomy might be preferred, because any changes can affect many subsequent uses of the taxonomy. However, in other poorly studied groups, such as bryophytes and fungi, the existing assignment of supraspecific ranks are somewhat arbitrary and subjected to constant changes. In these groups, maintaining the current taxonomy is not a priority. Our method offers an alternative metric to find the temporal cutoff that does not solely focus on maintaining the current supraspecific taxonomic ranks.
Caveats
The effectiveness of the proposed temporal classification depends on the quality of chronogram reconstruction, which in turns relies on the amount and type of data, alignment methods and taxon sampling. As the minimum empirical error is derived for a particular tree, the absolute time point should not be used across different groups of organisms. For example, the 31-MY cut-off for the genus level cannot readily be applied to any other organismal groups, because it was calculated from the crown ages of the focused groups only.
Monotypic taxa are common across various supraspecific taxonomic ranks and pose a challenge as how to accurately determine the crown age of the taxa with only one tip. The calculation of the temporal error score that we implement here follows the algorithm by Holt and Jønsson20, who explicitly state that this method of calculation does not use the crown age of the group and therefore is able to include monotypic taxa in the analysis. However, similar to their work, we did not include monotypic taxa for the crown age distribution analysis.
With different groups of organisms having different evolutionary histories and timelines, trying to find one universal cut-off for each taxonomic rank might not be productive. However, for groups of related organisms, the application of this method on a credible chronogram should allow to objectively find the temporal cut-off for classification of the same rank, while preserving taxonomic status of the majority of the taxa. The method provides an additional tool for erecting new taxa at supraspecific levels in an objective framework, adding to ongoing and growing discussion about temporal banding approaches to taxonomy.
Electronic supplementary material
Comparison of Current and New Classification
Acknowledgements
The project was financially supported by the Spanish Ministerio de Ciencia e Innovacion (projects CGL2013-42498-P), and the Negaunee Foundation (‘The greatest radiation in the fungal kingdom’). E.K. was supported by a visiting scholarship from The Field Museum and funding from the Higher Education Research Promotion and National Research University Project of Thailand, Office of the Higher Education Commission.
Author Contributions
E.K., H.T.L. designed the research and wrote the paper. P.K.D., A.C., S.D.L. assembled molecular data and conducted phylogenetic analyses. E.K. produced the code and associated figure.
Competing Interests
The authors declare that they have no competing interests.
Footnotes
Electronic supplementary material
Supplementary information accompanies this paper at doi:10.1038/s41598-017-02477-7
Publisher's note: Springer Nature remains neutral with regard to jurisdictional claims in published maps and institutional affiliations.
References
- 1.Mora C, Tittensor DP, Adl S, Simpson AGB, Worm B. How Many Species Are There on Earth and in the Ocean? PLoS Biol. 2011;9:e1001127. doi: 10.1371/journal.pbio.1001127. [DOI] [PMC free article] [PubMed] [Google Scholar]
- 2.Blackwell M. THE FUNGI: 1, 2, 3… 5.1 MILLION SPECIES? American Journal of Botany. 2011;98:426–438. doi: 10.3732/ajb.1000298. [DOI] [PubMed] [Google Scholar]
- 3.May RM. Tropical arthropod species, more or less? Science. 2010;329:41–42. doi: 10.1126/science.1191058. [DOI] [PubMed] [Google Scholar]
- 4.Mayr, E. Systematics and the origin of species. (Columbia University Press, 1942).
- 5.Mayr, E. Animal species and evolution. (Harvard University Press, 1963).
- 6.Linnaeus, C. Species plantarum, exhibentes plantas rite cognitas ad genera relatas, cum differentiis specificis, nominibus trivialibus, synonymis selectis, locis natalibus, secundum systema sexuale digestas. Vol. I (II) (\Holmiae, 1753).
- 7.Linnaeus, C. Systema Naturae. Edit. XII. (Stockholm, 1767).
- 8.Hennig, W. Phylogenetic systematics. (University of Illinois Press, 1966).
- 9.Haeckel, E. Generelle Morphologie der Organismen. (Georg Reimer, 1866).
- 10.Johns GC, Avise JC. A comparative summary of genetic distances in the vertebrates from the mitochondrial cytochrome b gene. Molecular Biology and Evolution. 1998;15:1481–1490. doi: 10.1093/oxfordjournals.molbev.a025875. [DOI] [PubMed] [Google Scholar]
- 11.Avise JC, Johns GC. Proposal for a standardized temporal scheme of biological classification for extant species. Proceedings of the National Academy of Sciences of the United States of America. 1999;96:7358–7363. doi: 10.1073/pnas.96.13.7358. [DOI] [PMC free article] [PubMed] [Google Scholar]
- 12.Avise JC, Mitchell D. Time to standardize taxonomies. Systematic Biology. 2007;56:130–133. doi: 10.1080/10635150601145365. [DOI] [PubMed] [Google Scholar]
- 13.Avise JC, Liu JX. On the temporal inconsistencies of Linnean taxonomic ranks. Biological Journal of the Linnean Society. 2011;102:707–714. doi: 10.1111/j.1095-8312.2011.01624.x. [DOI] [Google Scholar]
- 14.Castresana J. Cytochrome b phylogeny and the taxonomy of great apes and mammals. Molecular Biology and Evolution. 2001;18:465–471. doi: 10.1093/oxfordjournals.molbev.a003825. [DOI] [PubMed] [Google Scholar]
- 15.Bisby FA, Hawksworth DL. What must be done to save systematics? Regnum Vegetabile. 1991;123:323–336. [Google Scholar]
- 16.Michener CD. The possible use of uninominal nomenclature to increase the stability of names in biology. Systematic Zoology. 1964;13:182–190. doi: 10.2307/2411777. [DOI] [Google Scholar]
- 17.Cain AJ. The post-Linnaean development of taxonomy. Proceedings of the Linnean Society, London. 1959;170:234–244. doi: 10.1111/j.1095-8312.1959.tb00857.x. [DOI] [Google Scholar]
- 18.Lumbsch HT. How objective are genera in euascomycetes? Perspectives in Plant Ecology Evolution and Systematics. 2002;5:91–101. doi: 10.1078/1433-8319-00025. [DOI] [Google Scholar]
- 19.Nimis PL. A critical appraisal of modern generic concepts in lichenology. Lichenologist. 1998;30:427–438. doi: 10.1017/S0024282992000422. [DOI] [Google Scholar]
- 20.Holt BG, Jønsson KA. Reconciling Hierarchical Taxonomy with Molecular Phylogenies. Systematic Biology. 2014;63:1010–1017. doi: 10.1093/sysbio/syu061. [DOI] [PubMed] [Google Scholar]
- 21.Zhao R-L, et al. Towards standardizing taxonomic ranks using divergence times – a case study for reconstruction of the Agaricus taxonomic system. Fungal Diversity. 2016;78:239–292. doi: 10.1007/s13225-016-0357-x. [DOI] [Google Scholar]
- 22.Talavera G, Lukhtanov VA, Pierce NE, Vila R. Establishing criteria for higher-level classification using molecular data: the systematics of Polyommatus blue butterflies (Lepidoptera, Lycaenidae) Cladistics. 2013;29:166–192. doi: 10.1111/j.1096-0031.2012.00421.x. [DOI] [PubMed] [Google Scholar]
- 23.Divakar PK, et al. Evolution of complex symbiotic relationships in a morphologically derived family of lichen-forming fungi. New Phytologist. 2015;208:1217–1226. doi: 10.1111/nph.13553. [DOI] [PubMed] [Google Scholar]
- 24.Singh G, et al. Coalescent-Based Species Delimitation Approach Uncovers High Cryptic Diversity in the Cosmopolitan Lichen-Forming Fungal Genus Protoparmelia (Lecanorales, Ascomycota) Plos One. 2015;10(5):e0124625. doi: 10.1371/journal.pone.0124625. [DOI] [PMC free article] [PubMed] [Google Scholar]
- 25.Crespo A, et al. Phylogenetic generic classification of parmelioid lichens (Parmeliaceae, Ascomycota) based on molecular, morphological and chemical evidence. Taxon. 2010;59:1735–1753. [Google Scholar]
- 26.Miadlikowska J, et al. Multigene phylogenetic synthesis for 1307 fungi representing 1139 infrageneric taxa, 312 genera and 66 families of the class Lecanoromycetes (Ascomycota) Molecular Phylogenetics and Evolution. 2014;79:132–168. doi: 10.1016/j.ympev.2014.04.003. [DOI] [PMC free article] [PubMed] [Google Scholar]
- 27.Poux C, Madsen O, Glos J, de Jong WW, Vences M. Molecular phylogeny and divergence times of Malagasy tenrecs: influence of data partitioning and taxon sampling on dating analyses. BMC Evolutionary Biology. 2008;8:102. doi: 10.1186/1471-2148-8-102. [DOI] [PMC free article] [PubMed] [Google Scholar]
- 28.Townsend JP, Lopez-Giraldez F. Optimal Selection of Gene and Ingroup Taxon Sampling for Resolving Phylogenetic Relationships. Systematic Biology. 2010;59:446–457. doi: 10.1093/sysbio/syq025. [DOI] [PubMed] [Google Scholar]
- 29.Jønsson, K. A. et al. A supermatrix phylogeny of corvoid passerine birds (Aves: Corvides). Molecular Phylogenetics and Evolution94, 87–94. Available at: doi:10.1016/j.ympev.2015.08.020 (2016). [DOI] [PubMed]
Associated Data
This section collects any data citations, data availability statements, or supplementary materials included in this article.
Supplementary Materials
Comparison of Current and New Classification


