Abstract
The effect of temperature, pH, and sodium chloride concentration on the growth of the Ascomycetes fungus Monascus ruber van Tieghem, the main spoilage microorganism during storage of table olives, was studied by using the gradient plate technique. Gradients of NaCl (3 to 9%, wt/vol) at right angles to gradients of pH (2 to 6.8) were prepared for the plates, which were incubated at 25, 30, and 35°C. Visible fungal growth, expressed in optical density units, was recorded by image analysis and graphically presented in the form of three-dimensional grids. Results obtained from the plates indicated that the fungus was salt and acid tolerant, being able to grow at NaCl concentrations of up to 9% (wt/vol) and pH values of as low as 2.2, depending on the incubation temperature. The inhibitory effect of NaCl increased as the pH decreased progressively at 25 and 30°C but not at 35°C. Growth was better at 30 and 25°C as judged by the larger extent of the plates covered by mycelium compared with that at 35°C, where no growth was observed at pHs below 3.7. Differentiation between vegetative (imperfect-stage) and reproductive (perfect-stage) growth was evident on all plates, providing useful information about the effect of environmental conditions on the form of fungal growth. When the growth/no-growth surface model was obtained by applying linear logistic regression, it was found that all factors (pH, NaCl, and temperature) and their interactions were significant. Plots of growth/no-growth interfaces for P values of 0.1, 0.5, and 0.9 described the results satisfactorily at 25 and 35°C, whereas at 35°C the model predicted lower minimum pH values for growth in the range of 7 to 10% NaCl than those observed on the plates. Overall, it is suggested that the fungus cannot be inhibited by any combination of pH and NaCl within the limits of the brine environment, so further processing is required to ensure product stability in the market.
Monascus ruber is an Ascomycetes fungus (3) isolated in Greece from thermally processed green table olives of the Conservolea cultivar. This fungus produces heat-resistant ascospores that can survive the commercial heat pasteurization treatment applied by the table olive industry (11). The surviving ascospores can grow at low oxygen tension during storage, resulting in significant spoilage which is not confined to mycelium on the surface of the olives but also softens the fruit and increases the pH of the product. Ascospore germination depends on pH, NaCl concentration, and storage temperature (12). An effective way to study the simultaneous effect of these parameters on fungal growth is with gradient plates, which yield overall trends of combined variables on growth.
The use of gradient plates to determine the response of bacteria to two different environmental conditions was first described by Caldwell and Hirsch (2) and was refined by Wimpenny and Waters (24). Since then, gradient plates have been used to evaluate the combined effects of simultaneously varying physiological parameters, such as temperature, NaCl, pH, and preservatives, on bacterial growth either singly or in competition with other species (14, 17, 20, 21, 25). This technique has been applied primarily to food-borne bacteria, while there is little information available on filamentous fungi. In particular, in the existing literature either the focus is on yeasts rather than filamentous fungi (9, 26, 27) or the gradient is established with highly specific controlling factors (sanitizers and antibiotics) (4, 9). Moreover, this technique can yield quantitative data on microbial growth. The time to visible growth and the increase in the amount of biomass provide data on the kinetics and the growth yield, respectively. The accumulation of values for combinations of gradient factors around the area of growth form the growth/no-growth interface. Application of the logistic regression (16) permits the identification of these boundaries and can be used to assess the potential for microbial growth in response to changes in several experimental factors.
In the present work, two-dimensional gradient plates were used for the first time to rapidly screen the combined effects of temperature, NaCl concentration, and pH on the growth of M. ruber, the major spoilage microorganism during storage of processed table olives. The use of this technique was expanded to determine the growth/no-growth boundaries of fungus, providing useful information about the “habitat domain” of the fungus as established by Wimpenny (23), i.e., the physicochemical environmental conditions under which microorganisms can grow.
MATERIALS AND METHODS
Organism and preparation of ascospore suspension.
The fungus was isolated from thermally processed green table olives of the Conservolea cultivar. The test fungus was routinely grown on Rose Bengal chloramphenicol agar (Oxoid, Basingstoke, United Kingdom) plates for 1 month at 30°C. The plates were wrapped in plastic to prevent the drying of the medium due to prolonged incubation. Fungal mycelia with cleistothecia were harvested by flooding the plates with 15 ml of sterile distilled water containing 0.1% Tween 80 and gently scraping the surface with a sterile spatula. The suspension was sonicated for 10 min as described previously (5) to open the cleistothecia and free the ascospores. After sonication, the suspension was filtered through sterile glass wool, collected in a sterile test tube, and stored at 4°C. The spore suspension was 106 ascospores ml−1 as assessed by the microscopic count with a Neubauer counting chamber.
Preparation of two-dimensional gradient plates.
Two-dimensional pH-NaCl gradient plates were prepared in 12- by 12-cm disposable plastic petri dishes with four 20-ml layers of malt extract agar (Merck, Darmstandt, Germany) as the growth medium. The medium was made in 200-ml volumes. The first two volumes were adjusted with 6 ml of 5 N HCl and 6 ml of 1 M NaOH for the acid and alkali layers, respectively. One side of the plate was raised with a 3-mm-diameter rod, and the first layer (acid) was poured. After the medium solidified, the plates were leveled and the second layer (alkali) was added. When the pH gradient was set, the plates were turned 90o and the NaCl gradient was formed. The plates were again raised at one end by 3 mm, and a third layer of medium containing 35% (wt/vol) NaCl was added. Finally, the plates were leveled again and a final layer of malt extract agar was poured. The plates equilibrated for 24 h at room temperature prior to gradient measurement and inoculation. For each temperature, duplicate plates were prepared.
Gradient measurement.
The pH gradient was determined after equilibration at 2-cm intervals across the plates. For this purpose, 2-mm core samples of medium were removed and melted with 2 ml of deionized water. The pH was determined with an EA 940 digital pH meter (Orion Research Inc., Boston, Mass.). The NaCl gradient was determined by taking 2-mm core samples of medium, melting them in 2 ml of deionized water, and measuring the conductivity with a Wheatstone bridge. A calibration curve was constructed with malt extract agar containing known amounts of NaCl in order to convert conductivity readings to NaCl concentrations (percent, weight/volume). The pH gradient varied from 1.9 to 6.8, and the NaCl gradient varied from 3 to 9% (wt/vol). Prior to experimentation, one uninoculated plate was incubated at each temperature to check the stability of gradients. It was found that gradients were stable for no longer than 11 days, regardless of temperature.
Inoculation of gradient plates.
A suspension of ascospores (4 ml) was poured over the surface of the gradient plate, and the excess amount was removed after 1 min with a sterile Pasteur pipette to avoid interference with the NaCl gradient. The plates were allowed to stand for 15 min until the surface was dry and then incubated at 25, 30, and 35°C for up to 260 h.
Mapping of fungal growth.
Images were captured with a high-sensitivity SSC-DC50AP (Sony Corp., Tokyo, Japan) digital camera and processed with Image Pro Plus version 2.5 (Media Cybernetics) image analysis software. All plates were photographed at 24, 68, 92, 118, 188, and 260 h. Each plate was corrected for background by subtracting the image of an uninoculated (blank) plate incubated together with the test plates. Images were 512 by 512 pixels, each with a grayness (brightness) level from 0 (black) to 255 (white). To avoid edge effects, only the central 11-by-11 area was analyzed. Visible growth is expressed in optical density (OD) units based on the equation (13) OD = 0.4343 ln (255/pixel value). As the gray values of a malt extract agar plate immediately after inoculation were equal to or higher than 200, all pixels with gray values exceeding 200 were automatically set to 255 so that the equation above gave OD values equal to 0 (no visible growth). Results are presented in three-dimensional graphs of pH, NaCl, and optical density values.
Determination of growth/no-growth boundaries.
Based on the determination of NaCl concentrations (percent) and pH values at 1.2- and 0.8-cm intervals along the two gradients, respectively, a grid in the two-dimensional space of pH and NaCl was created to account for pH and NaCl values (14 × 10 = 140) at and within these intervals. The optical density data were converted into probabilities of growth by assigning 1 to areas of the grid where visible fungal growth was evident (OD values greater than 0) and 0 to areas where no visible growth was detected (OD values equal to 0). Probability data were modeled by using linear logistic regression to determine the growth/no-growth boundaries of the fungus at each temperature. The following quadratic equation (6, 7) was fitted to the data:
 |
(1) |
where logit (P) is an abbreviation of ln [P/(1 − P)], P is the probability of growth (in the range of 0 to 1), ai are coefficients to be estimated, and T is temperature.
Although more cardinal expressions have been employed in growth/no-growth studies (15, 22), the use of quadratic expressions in logistic regression has been proven to be a simple and successful means of modeling the probability of microbial growth or no growth (6, 7). Equation 1 was fitted by using the SAS Proc Logistic procedure (19). The automatic variable selection option with a stepwise selection method was used to choose the most significant effects (P < 0.05). The predicted growth/no-growth interfaces for P = 0.1, 0.5, and 0.9 were calculated by using Microsoft Excel Solver.
RESULTS
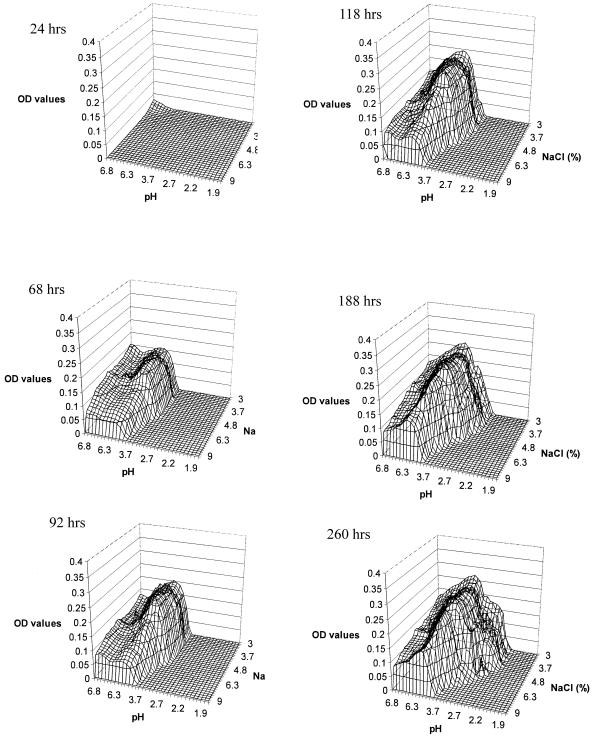
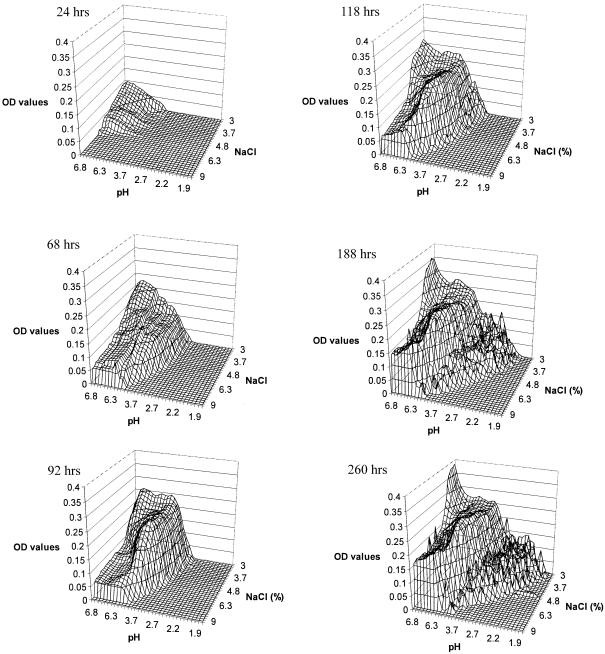
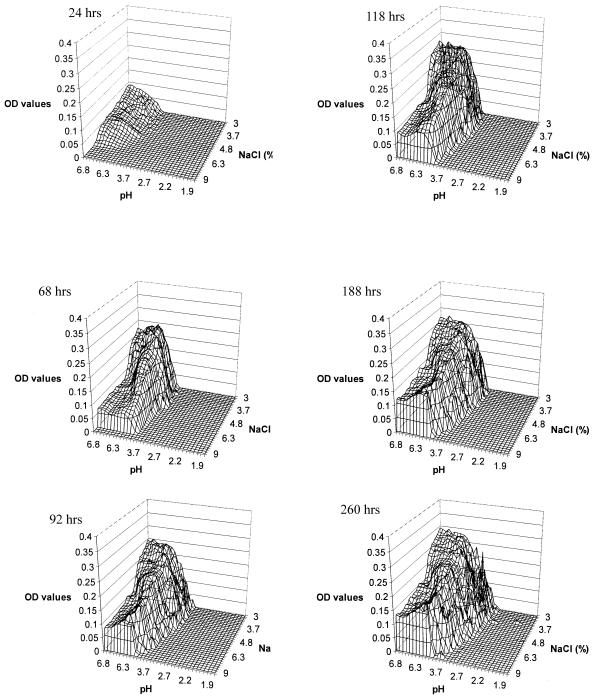
The areas of visible fungal growth on each plate after incubation at 25, 30, and 35°C are presented in Fig. 1, 2, and 3, respectively. Differences in the density of growth within these areas are indicated by different OD values. Growth zones on the plates occupied a single area extending from the corner of the plate at neutral pH and low NaCl concentration, where the highest OD values were recorded within the first 24 h, to the zone with low pH and high NaCl concentration, forming an arc-shaped growth pattern. The fungus covered the largest area of the plates at 25 and 30°C (Fig. 1 and 2), while at 35°C there was a significant decrease in growth area, particularly at low pH values. At 25°C, growth occurred at pH values of as low as 2.7 after 188 h and at a salt concentration of up to 9% (wt/vol). However, no visible growth was apparent at the extreme experimental conditions of pH and NaCl concentration, i.e., 2.7 and 9%, respectively. A similar pattern was observed at 30 and 35°C, where the growth limit values for pH were 2.2 and 3.7, respectively (Fig. 2 and 3).
FIG. 1.
Wire frame representation of M. ruber visible growth on malt extract agar pH-NaCl gradient plates at 25°C.
FIG. 2.
Wire frame representation of M. ruber visible growth on malt extract agar pH-NaCl gradient plates at 30°C.
FIG. 3.
Wire frame representation of M. ruber visible growth on malt extract agar pH/NaCl gradient plates at 35°C.
There is an interaction of the effects of NaCl and pH on ascospore germination, with the inhibitory effect of NaCl increasing as the pH decreases. At 30°C and pH 2.2, ascospore germination was inhibited at 3.7% NaCl for up to 188 h (Fig. 2), while at pH 3.7 the NaCl concentration needed to inhibit germination was 6.3%. A similar pattern was observed at 25°C (Fig. 1) but not at 35°C, where no growth was observed below pH 3.7 (Fig. 3).
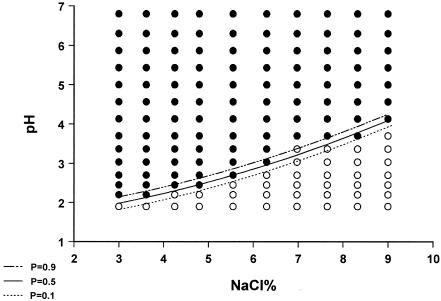
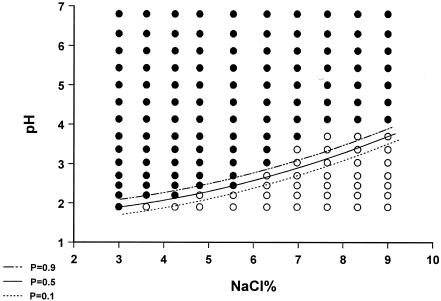
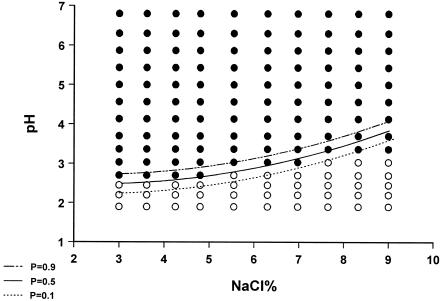
When the growth/no-growth surface model at 260 h of incubation was obtained by applying linear logistic regression, it was evident that pH, temperature, and NaCl, as well as their interactions, were significant (Table 1). Plots of growth/no-growth interfaces for P values of 0.1, 0.5, and 0.9 are given in Fig. 4, 5, and 6. It seems that predicted interfaces describe the results satisfactorily at 25 and 35°C, whereas at 30°C the model predicts lower minimum pH values for growth in the range of 7 to 10% NaCl than those observed on gradient plates. With regard to the goodness of fit of the growth/no-growth model, logistic regression resulted in 99.3% concordance and a maximum rescaled r2 value of 0.844, whereas the Hosmer-Lemeshow statistic was 16.125 (X2, 8 df; P = 0.041). On the other hand, the 0.6% discordance was attributed to six false-negative predictions (growth was detected, while the model predicted a probability of growth of less than 0.5) and eight false-positive predictions (no growth was detected, with the model predicting a probability of growth higher than 0.5), from a total of 420 cases (140 cases for each of the three temperatures), corresponding to 1.4 and 1.9%, respectively. The majority of false-negative predictions occurred for NaCl concentrations of 4 to 7% and pHs of 2.00 to 3.75. The majority of false-positive predictions were associated with either 3 to 4% or 6 to 8% NaCl and the same pH range as for false-negative predictions. Higher number of false predictions occurred at 30°C, followed by 35 and 25°C (Fig. 4 to 6).
TABLE 1.
Fitted values for the significant (P < 0.05) coefficients of the visible growth/no-growth surface model for M. ruber obtained by logistic regression with the maximum-likelihood method
| Coefficienta | Estimate | SE |
|---|---|---|
| Intercept (a0) | 126.100 | 11.653 |
| a1 (T) | 7.530 | 0.672 |
| a2 (salt) | −8.362 | 1.491 |
| a3 (pH) | 25.155 | 4.826 |
| a4 (T × T) | −0.132 | 0.011 |
| a5 (salt × salt) | −0.277 | 0.048 |
| a6 (T × salt) | 0.276 | 0.046 |
| a7 (T × pH) | −0.462 | 0.150 |
Nonsignificant parameters (P > 0.05) of equation 1, as determined by logistic linear regression, are not presented.
FIG. 4.
Plot of predicted visible growth/no-growth interface at P values of 0.9 (- · · -), 0.5 (__), and 0.1 (…) and observed growth (•) and no-growth (○) responses of M. ruber growing on malt extract agar gradient plates at 25°C for 10 days.
FIG. 5.
Plot of predicted visible growth/no-growth interface at P values of 0.9 (- · · -), 0.5 (__), and 0.1 (…) and observed growth (•) and no-growth (○) responses of M. ruber growing on malt extract agar gradient plates at 30°C for 10 days.
FIG. 6.
Plot of predicted visible growth/no-growth interface at P values of 0.9 (- · · -), 0.5 (__), and 0.1 (…) and observed growth (•) and no-growth (○) responses of M. ruber growing on malt extract agar gradient plates at 35°C for 10 days.
DISCUSSION
Since the fungus was isolated from table olives, it was considered important to investigate gradients close to the brine environment. Thus, the gradient of NaCl ranged from 3 to 9% (wt/vol), which is commonly used by table olive industries. The pH ranged from about 2 to 6.8 in order to study the response of the fungus in the neutral-acidic pH region, since the pH of the brine ranges from 3.8 to 4.5. Finally, the temperatures were 25, 30, and 35°C, which are common storage temperatures, particularly during the summer. Lower temperatures (e.g., 20°C) were not selected because fungal growth is slow (12), and consequently, growth would take longer to be detected on the plates. This could probably cause a problem in the gradient plate technique owing to diffusive breakdown of the gradients due to prolonged incubation (8).
The highest OD values recorded were in the pH region from 3.7 to 6.3. In this area, fungal growth extended over more of the NaCl concentration gradient regardless of temperature. Thus, under normal brine conditions (pH 3.8 to 4.5), the fungus is very salt tolerant and can grow on nearly 9% (wt/vol) NaCl. Consequently, the combined effect of low pH and high salt concentration may not suffice for table olive preservation, and further treatment is necessary to ensure product stability during storage. This conclusion is consistent with previous work by Balatsouras and Vaughn (1), who isolated various fungal species from olive brines and evaluated their tolerance to pH and NaCl. They reported that all isolates could grow at NaCl concentrations of up to 8% (wt/vol) and at pH values of as low as 3.5. However, the species reported in that work were isolated from fermented brines without any thermal treatment, and in addition, no information was provided about M. ruber, since the fungus was only recently isolated from thermally processed olives (11).
The type of growth stage may also interfere with absorbance values, since areas in the reproductive growth stage are likely to have higher OD values than those where simply vegetative growth occurs. This is due to the presence of cleistothecia and not necessarily due to the increase of mycelial density itself, and it may be considered a potential limitation in the application of the method, especially in the case of modeling. Although we have no evidence of whether the fungus is homothallic or heterothallic, i.e., whether the ascospores have the same genetic potential or not, differentiation in growth may be attributed to the effects of different levels of pH and NaCl across the surface of the plates. The reason for this is that the plates were inoculated with a relatively large inoculum of ascospores (106 spores/ml), corresponding to approximately 104 spores per cm2, based on the total area of the plate (144 cm2). Therefore, there is a high number of spores located within an area where the pH and NaCl concentration are slightly changed by dpH and dNaCl intervals. Consequently, the appearance of mycelium in every spot on the plate is based on the assumption that visible growth derives from those spores that have the highest potential to initiate vegetative growth under the conditions of a specific biothesis.
Another advantage of the gradient plate technique is that collective data could be used as a basis for determination of the growth/no-growth interface on a solid substrate, simulating the microbial contamination of food surfaces. The first approach to monitor growth on gradient plates and to determine growth/no-growth responses in liquid culture was performed with Listeria monocytogenes by McClure et al. (8). Efforts on modeling growth/no-growth boundaries were recently refined for Escherichia coli (15), Salmonella enterica serovar Typhimurium (6), and L. monocytogenes (22), as well as for spoilage microorganisms such as Brochothrix thermosphacta (7). In the present work, an attempt was made to monitor fungal growth and model growth/no-growth boundaries with data collected from a single plate. The model for the growth/no-growth boundaries of M. ruber indicated good performance, judging by the statistical evaluation (concordance rate, maximum rescaled r2, and Hosmer-Lemeshow statistic), as well as by the graphical comparison of the predicted interface with actual data (Fig. 4 to 6). However, as noticed in relevant studies, the experimental cases close to the point where growth ceases are those that likely account for the discordance of the respective models. Indeed, under conditions approaching the growth limits, the shifts in growth responses become abrupt and hence more difficult to describe. For instance, Salter et al. (18) observed false predictions by the growth/no-growth model for E. coli at temperatures of below 20°C (especially close to 10°C) and water activities (aws) of below 0.977. Similarly, in the present study, the discordance of the model derived mainly from combinations of low pH with medium to high NaCl concentrations. However, the discordance may also be associated with the type and the intervals of a factor(s) under investigation. This is probably the reason why in the study of Presser et al. (15), the growth/no-growth interface of E. coli was narrow at pHs of around 4.0 to 4.5 and the optimum aw, while as the aw dropped below 0.97, the predicted interface became wider even at pHs close to neutral. Conversely, in the same study, the narrow intervals of pH adjusted by the combined addition of HCl and lactic acid allowed for a more accurate determination of the E. coli growth/no-growth interface in response to lactic acid concentration and pH. In our case, the gradient plates offer a more detailed description (in terms of intervals) of pH and NaCl ranges, thus increasing the robustness of the developed model for the growth/no-growth interface of M. ruber.
The need for research in the area of growth/no-growth boundaries becomes more intense because of the acid tolerance and osmotolerance of the fungus, raising concerns for many products commonly preserved by a combination of low aw, pH, and acidic preservatives (e.g., bakery products) (10). Moreover, growth/no-growth data should be expanded to include not only the effects of aw and pH but also the effects of the size of the inoculum, which has been found to be of great importance also (7).
Overall, the gradient plate technique can be advantageous in two ways: (i) in combination with image analysis, it is a convenient way of obtaining kinetic growth data, through changes in the OD of biomass over time, and (ii) in combination with logistic regression, it can be used for modeling of growth/no-growth boundaries and determination of conditions that form the habitat domain of a microorganism, i.e., the limiting growth conditions under which the likelihood of growth varies between 10 and 90%. This work can be extended to other spoilage fungi, taking into account other variables such as preservatives, essential oils, and natural antimicrobial substances, in order to determine their habitat domains and increase the effectiveness of food preservation technologies.
REFERENCES
- 1.Balatsouras, G. D., and R. S. Vaughn. 1958. Some fungi that might cause softening of storage olives. Food Res. 23:235-243. [Google Scholar]
- 2.Caldwell, D. E., and P. Hirsch. 1973. Growth of microorganisms in two-dimensional steady-state diffusion gradients. Can. J. Microbiol. 19:53-58. [DOI] [PubMed] [Google Scholar]
- 3.Domsch, K. H., W. Gams, and T. H. Anderson. 1980. Compedium of soil fungi, p. 425-426. Academic Press, London, United Kingdom.
- 4.Gentile, A. F., B. A. Mayles, and P. L. Procopio. 1992. Enhancement of secondary metabolite production using the antibiotic gradient-plate technique. Life Sci. 50:287-293. [DOI] [PubMed] [Google Scholar]
- 5.Kotzekidou, P. 1997. Heat resistance of Byssochlamys nivea, Byssochlamys fulva and Neosartorya fisheri isolated from canned tomato paste. J. Food Sci. 62:410-412. [Google Scholar]
- 6.Koutsoumanis, K. P., P. A. Kendall, and J. N. Sofos. 2004. Modeling the boundaries of growth of Salmonella Typhimurium in broth as a function of temperature, water activity, and pH. J. Food Prot. 67:53-59. [DOI] [PubMed] [Google Scholar]
- 7.Masana, M. O., and J. Baranyi. 2000. Growth/no growth interface of Brochothrix thermosphacta as a function of pH and water activity. Food Microbiol. 17:485-493. [Google Scholar]
- 8.McClure, P. J., T. A. Roberts, and P. O. Oguru. 1989. Comparison of the effects of sodium chloride, pH and temperature on the growth of Listeria monocytogenes on gradient plates and in liquid medium. Lett. Appl. Microbiol. 9:95-99. [Google Scholar]
- 9.McGrath, K., D. E. Odell, and R. R. Davenport. 1992. Establishing the presence of a concentration gradient in gradient plates containing quaternary ammonium-based sanitizers. Int. Biodeter. Biodegrad. 29:45-52. [Google Scholar]
- 10.Membre, J.-M., M. Kubaczka, and C. Chene. 2001. Growth rate and growth-no-growth interface of Penicillium brevicompactum as functions of pH and preservative acids. Food Microbiol. 18:531-538. [Google Scholar]
- 11.Panagou, E. Z., C. Z. Katsaboxakis, and G. J. E. Nychas. 2002. Heat resistance of Monascus ruber ascospores isolated from thermally processed green olives of the Conservolea variety. Int. J. Food Microbiol. 76:11-18. [DOI] [PubMed] [Google Scholar]
- 12.Panagou, E. Z., P. N. Skandamis, and G. J. E. Nychas. 2002. Modelling the combined effect of temperature, pH and aw on the growth rate of Monascus ruber a heat-resistant fungus isolated from green table olives. J. Appl. Microbiol. 94:1-11. [DOI] [PubMed] [Google Scholar]
- 13.Peters, A. C., L. V. Thomas, and J. W. T. Wimpenny. 1998. Agar plate techniques, p. 487-527. In M. H. F. Wilkinson and F. Schut (ed.), Digital image analysis of microbes: imaging, morphometry, fluorometry and motility techniques and applications. John Wiley & Sons Ltd., London, United Kingdom.
- 14.Peters, A. C., J. W. T. Wimpenny, L. V. Thomas, and J. Griffiths. 1991. Mapping bacterial growth on gradient plates using image analysis. Binary 3:147-155. [Google Scholar]
- 15.Presser, K. A., T. Ross, and D. A. Ratkowsky. 1998. Modelling the growth limits (growth/no growth interface) of Escherichia coli as a function of temperature, pH, lactic acid concentration, and water activity. Appl. Environ. Microbiol. 64:1773-1779. [DOI] [PMC free article] [PubMed] [Google Scholar]
- 16.Ratkowsky, D. A., and T. Ross. 1995. Modelling the bacterial growth/no growth interface. Lett. Appl. Microbiol. 20:29-33. [Google Scholar]
- 17.Rattanasomboom, N., S. R. Bellara, P. J. Fryer, C. R. Thomas, and C. M. McFarlane. 2001. The gradient plate technique as a means of studying the recovery of heat-injured Brochothrix thermosphacta. Int. J. Food Sci. Technol. 36:369-376. [Google Scholar]
- 18.Salter, M. A., D. A. Ratkowsky, T. Ross, and T. A. McMeekin. 2000. Modelling the combined temperature and salt (NaCl) limits for growth of a pathogenic Escherichia coli strain using nonlinear logistic regression. Int. J. Food Microbiol. 61:159-167. [DOI] [PubMed] [Google Scholar]
- 19.SAS Institute. 1999. Statistical analysis system for Windows, version 8.0. SAS Institute, Cary, N.C.
- 20.Thomas, L. V., J. W. T. Wimpenny, and G. J. Davis. 1993. Effect of three preservatives on the growth of Bacillus cereus, Vero cytotoxigenic Escherichia coli and Staphylococcus aureus, on plates with gradients of pH and sodium chloride concentration. Int. J. Food Microbiol. 17:289-301. [DOI] [PubMed] [Google Scholar]
- 21.Thomas, L. V., and J. W. T. Wimpenny. 1996. Investigation of the effect of combined variations in temperature, pH, and NaCl concentration on nisin inhibition of Listeria monocytogenes and Staphylococcus aureus. Appl. Environ. Microbiol. 62:2006-2012. [DOI] [PMC free article] [PubMed] [Google Scholar]
- 22.Tienungoon, S., D. A. Ratkowsky, T. A. McMeekin, and T. Ross. 2000. Growth limits of Listeria monocytogenes as a function of temperature, pH, NaCl, and lactic acid. Appl. Environ. Microbiol. 66:4979-4987. [DOI] [PMC free article] [PubMed] [Google Scholar]
- 23.Wimpenny, J. W. T. 1981. Spatial order in microbial ecosystems. Biol. Rev. 56:295-342. [Google Scholar]
- 24.Wimpenny, J. W. T., and P. Waters. 1984. Growth of microorganisms in gel-stabilised two-dimensional gradient systems. J. Gen. Microbiol. 130:2921-2926. [DOI] [PubMed] [Google Scholar]
- 25.Wimpenny, J. W. T., and P. Waters. 1987. The use of gel-stabilized gradient plates to map the responses of microorganisms to three or four environmental factors varied simultaneously. FEMS Microbiol. Lett. 40:263-267. [Google Scholar]
- 26.Xiao, W., and B. L. Chow. 1998. Synergism between yeast nucleotide and base excision repair pathways in the protection against DNA methylation damage. Curr. Genet. 33:92-99. [DOI] [PubMed] [Google Scholar]
- 27.Xiao, W., B. L. Chow, and L. Rathgeber. 1996. The repair of DNA methylation damage in Saccharomyces cerevisiae. Curr. Genet. 30:461-468. [DOI] [PubMed] [Google Scholar]


