Abstract
Jaundice is a common and complex clinical symptom potentially occurring in hepatology, general surgery, pediatrics, infectious diseases, gynecology, and obstetrics, and it is fairly difficult to distinguish the cause of jaundice in clinical practice, especially for general practitioners in less developed regions. With collaboration between physicians and artificial intelligence engineers, a comprehensive knowledge base relevant to jaundice was created based on demographic information, symptoms, physical signs, laboratory tests, imaging diagnosis, medical histories, and risk factors. Then a diagnostic modeling and reasoning system using the dynamic uncertain causality graph was proposed. A modularized modeling scheme was presented to reduce the complexity of model construction, providing multiple perspectives and arbitrary granularity for disease causality representations. A “chaining” inference algorithm and weighted logic operation mechanism were employed to guarantee the exactness and efficiency of diagnostic reasoning under situations of incomplete and uncertain information. Moreover, the causal interactions among diseases and symptoms intuitively demonstrated the reasoning process in a graphical manner. Verification was performed using 203 randomly pooled clinical cases, and the accuracy was 99.01% and 84.73%, respectively, with or without laboratory tests in the model. The solutions were more explicable and convincing than common methods such as Bayesian Networks, further increasing the objectivity of clinical decision-making. The promising results indicated that our model could be potentially used in intelligent diagnosis and help decrease public health expenditure.
Keywords: Jaundice, Intelligent diagnosis, Dynamic uncertain causality graph, Expert system
1. Introduction
The ability to more accurately predict and prevent disease has the potential to transform clinical practice. However, what limits the accuracy of disease predicting and prevention results from our limitation in understanding the link between clinical presentation and disease progression (Madabhushi et al., 2010). Although vast amounts of data are collected in clinical practice, ranging from organ images to blood and genetic tests, there are challenges associated with analyzing, combining, and correlating these data to make diagnostic predictions. Currently, although the perception of evidence-based medicine is widely accepted and various sorts of clinical pathways and guidelines are put forward and renewed, the diagnostic method is still influenced by subjective factors and the correct diagnosis is largely correlated with doctors’ comprehensive experience. Regional imbalances of health care and physician training in specializations have made diagnosis difficult in a complex clinical background. Intelligent diagnosis approaches have the potential to cover rare situations across a wide range of specialist domains, while no clinical expert can be expected to possess such an encyclopedic knowledge of disease manifestations. Recently, artificial intelligence diagnostic tools have given rise to more and more interest in the biomedical community, and offered a promising improvement in sensitivity and specificity of disease detection, diagnosis, and prognosis. Until now, various clinical expert systems based on rules, cases, fuzzy logic, Neural Networks, Bayesian Networks, or hybrid reasoning have been developed (Keith et al., 1995; Hatzilygeroudis and Prentzas, 2004; Malek et al., 2005; Sasikumar et al., 2007; Lee, 2008; Avci, 2012; Oladipupo et al., 2012; Siniscalchi et al., 2014; Shen et al., 2015), and have been used as diagnosis aids across a wide range of specialties, such as vertigo (Dong et al., 2014a), Alzheimer’s disease (Suk et al., 2014), autism (Bhat et al., 2014), image diagnosis (Li et al., 2014), and pathological diagnosis (Kruk et al., 2014).
As a technical development, the dynamic uncertain causality graph (DUCG) method which deals with the causal link between uncertain information with graphical expression and probability measurement is proposed (Zhang et al., 2014; Zhang, 2015a). DUCG is a probabilistic graphical model which intuitively expresses a causal relationship among variables in an explicit pattern, and uses a “chaining” inference algorithm to achieve efficient reasoning. DUCG can propagate probabilities through causality chains, achieve dynamic reasoning either with or without spread of causality between time slices (Zhang and Geng, 2015), achieve reasoning in the case of logic circles (Zhang, 2015a), and handle fuzzy evidence (Zhang, 2015b). The greatest advantage of DUCG in clinical diagnosis is that it can display the reasoning process and results graphically, and make an inference with incomplete information and less accurate parameters than conventional methods such as Bayesian Networks. The DUCG model has been applied in the clinical diagnosis of vertigo (Dong et al., 2014a) and for troubleshooting in nuclear power station electric generators, spacecraft power systems, and chemical process systems (Dong et al., 2014b) with competitive results.
Jaundice is a common and complex clinical symptom with potential involvement in hepatology, general surgery, infectious diseases, pediatrics, genetic diseases, gynecology, and obstetrics, and it is fairly difficult to distinguish jaundice as a cause in clinical practice (Bhutani and Johnson-Hamerman, 2015; Gottesman et al., 2015). An intelligent diagnosis tool would greatly improve the general level of health care, decrease public health expenditure, and offer distinctive value in the less developed areas of the world. In this paper, we used the DUCG theory to build an intelligent diagnosis system for jaundice and tested its validity in clinical cases.
2. Methods
2.1. Graphical representation
DUCG as a newly developed framework of intelligent system represents complex causalities explicitly and easily with graphical symbols including logic gates. In DUCG, Xnk is commonly used and represents any event variable state with the first subscript used to index the variable and the second subscript to index the state of the variable, between which a comma is used for separation and can be ignored when there is no confusion. The conditional probability between a child Xnk and its parent Vij is replaced by the weighted causal functional events Fnk,ij and their occurrence probabilities fnk,ij=(rn,i/rn)ank,ij, where ank,ij=Pr{Ank,ij} and Ank,ij is the virtual random event that Vij causes Xnk, “,” is used to divide the subscripts of parent Vi and the subscripts of child Xn, rn,i>0 is the causal relationship intensity between Vi and Xn,  .It is obvious that a-type parameters quantify the uncertain causality between Vij and Xnk and rn,i/rn is in effect the weighting factor of this causality. When we do not have samples, we can give parameters of fnk,ij directly according to the domain expert’s knowledge.
A simple DUCG sub-graph is shown in Fig. 1, while the variable types used and their graphic meanings are shown in Table 1.
Fig. 1.
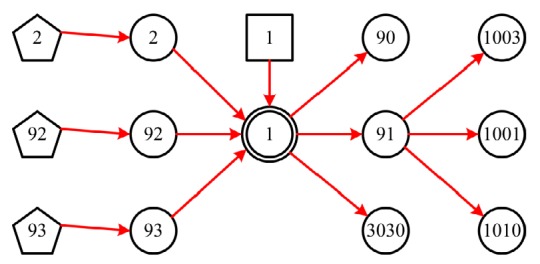
A simple sub-graph representing typical construction of DUCG
Table 1.
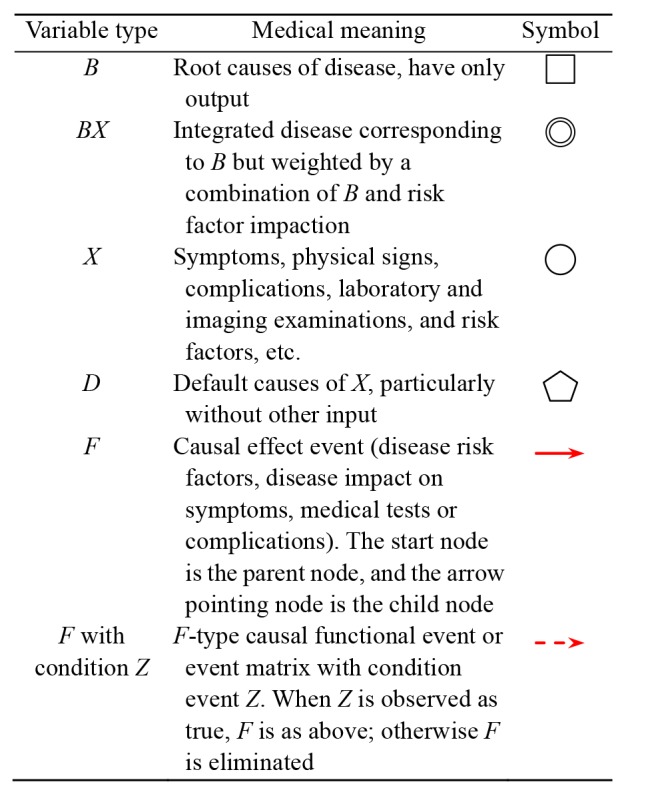
Medical meaning of variables used in DUCG model
2.2. Development of jaundice knowledge base
A DUCG represents a causality structure among event variables. For a specific disease related to jaundice, it can be the sorting of the causality relationship among symptoms, signs, laboratory tests, disease, and pivotal complications. In the construction of a knowledgebase, symptoms, signs, and laboratory tests are expressed in separate sub-graphs, so that the medical knowledge base is easily understood. Firstly, a “B”-type variable is created to represent a specific disease with a priori probability. Then, the corresponding integrated causal variable “BX” is created to represent the integrated probability of the disease weighted by a combination of the disease incidence (“B”) and the impact of the demographic information (“X”) and risk factors (“X”) along with D-type events. After that, categorical variables such as symptom, sign, and test were created and connected to the “BX” variable with weighted functional variable “F” as its downstream part. The {b-, a-, r-}-type parameter values were adopted in the parameter setting where key symptom, sign, and test have a relatively high values depending on their clinical significance. A sum of 27 most common jaundice-related diseases was contained in the knowledge base.
Five senior clinical experts were invited to help with the determination of each F-type causal functional event. First, reference research was performed to set up reference values for those widely accepted causal effect events such as risk factors, probability of a certain sign or symptom in a certain disease, or the positive rate of certain clinical testing or imaging in a certain disease. When published data were not available for some causal effect event, local research was done based on history cohorts to examine the primary value. After that, the five clinical experts evaluated the whole probability sheet separately, and if the primary value is not agreed, a new value will be demanded. When two or more experts disagreed with the primary value, it would be discussed in a meeting and the mean value would be chosen if no agreement was achieved.
2.3. Inference calculation
The inference calculation was performed in home-made DUCG diagnosis software where four key steps, i.e. simplification, decomposition, event expanding, and probability calculation, were carried out. The detailed algorithm has been demonstrated previously (Zhang, 2012; 2015a) and is briefly illustrated as follows.
The inference process is basically to analyze the causal logic with the information obtained and to determine whether a reasonable candidate hypothesis (a pair of B and BX events) is sufficient to account for current abnormalities.
The first step of DUCG inference is to simplify the graphical knowledge base conditional on observations before other calculations, so that the scale and complexity of the diagnosis process can be reduced exponentially. The simplification process is based on the 10 reduction rules of DUCG (Zhang, 2012), during which non-existent and non-sense variables and causal relationships are deleted. These rules can be applied repeatedly until no more simplification can be performed.
Then, the decomposition was performed aiming to reduce the scale of the causality structure during the diagnosis process. By assuming different disease Bij, a large and complex DUCG can be divided into a set of sub-DUCG graphs, which are overall exhaustive. The DUCG model can find the symptoms associated with each B-type variable (disease) by the above strategy.
Before probabilistic calculation, the event expanding operations were conducted on the observed abnormal evidence
 based on each sub-DUCG to avoid redundant calculations and decrease the overall reasoning cost. Event expanding was performed according to Eq. (1) until reaching B-type events, during which the BX-type candidate hypotheses and hypothesis space S
H are obtained.
 |
(1) |
where Vi (V∈{X, B, G, D}) are the parents of Xnk. G represents logic gate variable type which is not used in this study. Hk,j and Hk,jE can also be expanded based on Eq. (1), where Hk,j corresponds to BXk,j and then Bk,j. During the event expanding of E and Hk,jE, logic operations, such as AND, OR, XOR, NOT, absorption, exclusion, and complement, are applied. The corresponding probability calculation of the logic expression is similar to
 |
(2) |
where a, f, and v represent corresponding probabilities.
Finally, probabilistic calculations were carried out according to
 |
(3) |
 |
(4) |
where h s and h r represent the posterior probability and rank probability of Hk,j, respectively.
2.4. Jaundice diagnostic model verification
Patients hospitalized in the First Affiliated Hospital of Zhejiang University (Hangzhou, China) with elevation of serum total bilirubin (twice as high as the upper limit) were selected. The study protocol was approved by the Human Ethics Committee of the First Affiliated Hospital, School of Medicine, Zhejiang University and a written informed consent to participate in the study was signed. In total 203 cases covering the 27 most common jaundice-related diseases were extracted from the hospital information system, accounting for 5.09% of qualified cases. Ten cases were randomly selected for each disease, and when fewer than 10 cases exist for a disease in the system of the hospital, all the cases were included.
Home-made information management software was used to collect and store the related demographic and medical information. The diagnosis of each case was performed with the DUCG jaundice diagnostic model. For each case, the calculation was performed twice with or without laboratory tests and imaging tests to verify the diagnostic power of symptoms and signs alone. After probabilistic calculation, posterior probability of possible diseases was calculated and sorted according to the rank probabilities calculated by Eq. (4).
3. Results
3.1. Jaundice diagnostic model on DUCG
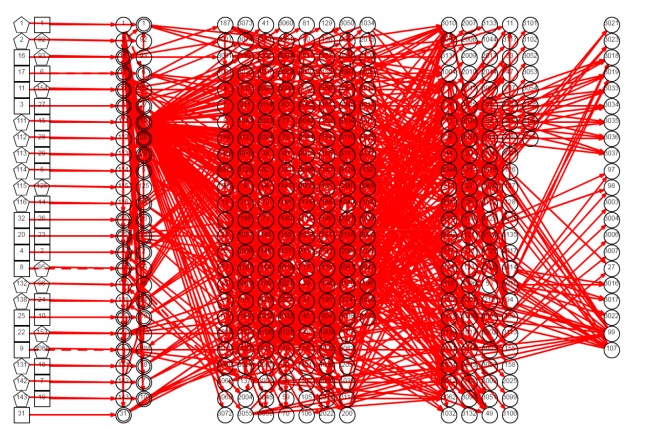
In sum, 421 variables and 1062 causes were included in the DUCG graph (Fig. 2). A sub-DUCG for hepatitis C is shown in Fig. 3 and the diagnosis process is explained in detail as follows. The diagnostic system can merge these sub-graphs to obtain the whole knowledge graph of jaundice as shown in Fig. 2. In the process of reasoning and calculation, the inference engine uses the whole knowledge graph.
Fig. 2.
DUCG graph for jaundice diagnosis
Fig. 3.
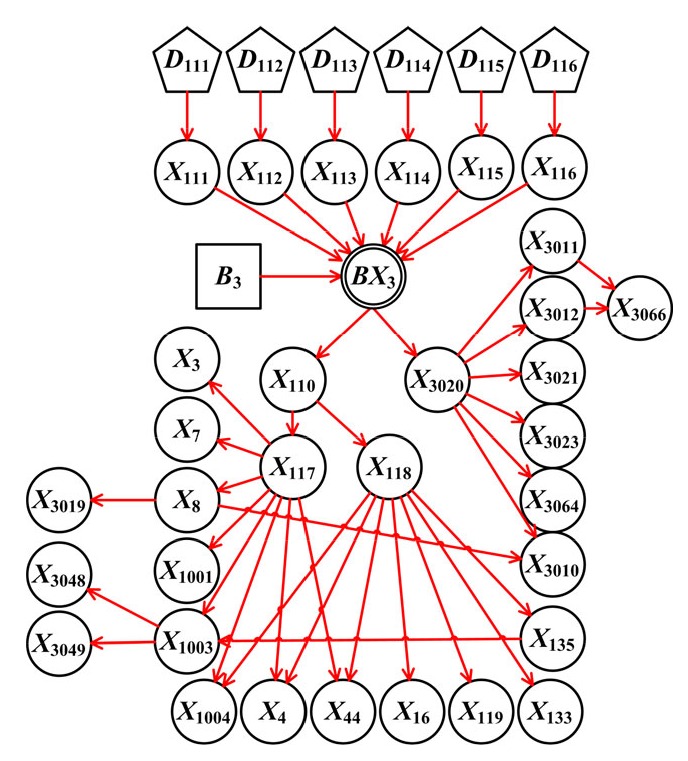
Sub-DUCG for hepatitis C
The definitions of variables used in hepatitis C sub-DUCG graphs are outlined in Table 2. Hepatitis C is a common cause of liver dysfunction and elevation of bilirubin characterized by hepatitis C virus (HCV) infection and has a high prevalence in blood transfusion, hemodialysis, and intravenous drug abuse. The symptoms of hepatitis C are mostly non-specific, including loss of appetite, nausea, fever, jaundice, dark urine, and fatigue. The laboratory findings include specific testing (HCV RNA and anti-HCV IgG), common liver dysfunction indexes (bilirubin, alanine transaminase (ALT), aspartate aminotransferase (AST), and urobilinogen), and findings related to its complications (leukopenia, thrombocytopenia, globulin, and α-1-fetoprotein (AFP)). HCV cause complications such as liver cancer, fatty liver, and cirrhosis.
Table 2.
Variable definitions in the sub-DUCG of hepatitis C
| Name | Description |
| B 3, BX 3 | Hepatitis C |
| X 111–X 116 | Risk factors of hepatitis C, including general population, blood donation, intravenous drug abuse, blood dialysis, hemophilia, and prostitution |
| X 110 | Signs and symptoms of hepatitis C |
| X 3020 | Laboratory tests of hepatitis C |
| X 3010–X 3012, X 3019, X 3021, X 3023, X 3048, X 3049, X 3064, X 3066 | Bilirubin, alanine transaminase (ALT), aspartate aminotransferase (AST), urobilinogen, hepatitis C virus (HCV) RNA, anti-HCV IgG, leukopenia, thrombocytopenia, globulin, and α-1-fetoprotein (AFP) |
| X 117, X 118 | Signs and symptoms of acute or chronic hepatitis C |
| X 3, X 4, X 7, X 8, X 16, X 44 | Symptoms of hepatitis C successively loss of appetite, nausea, fever, jaundice, dark urine, and fatigue |
| X 1001, X 1003, X 1004 | Signs of hepatitis C successively hepatomegaly, splenomegaly, and hepatalgia |
| X 119, X 133, X 135 | Complications of chronic hepatitis C successively liver cancer, fatty liver, and cirrhosis |
In one case, the symptoms, physical signs, laboratory and imaging tests are transformed into corresponding variable states as follows: E S1=X 1,1; E S2=X 2,6; E S3=X 8,1; E S4=X 44,1; E S5=X 1032,1; E C1=X 3010,2; E C2=X 3011,4; E C3=X 3012,4; E C4=X 3119,1; E C5=X 3023,1; E C6=X 3043,1; E C7=X 3048,1; E C8=X 3049,1; E C9=X 3064,1; E C10=X 3066,1. The symbol E S i represents evidence of symptoms and physical signs, and E C i denotesrelevant evidence from laboratory and imaging tests. All knowledge base variables for symptoms, physical signs, and tests are in the normal state, while the statuses of intermediate variables such as complications are set in an “unknown” state. In the first step of diagnosis, only E S i was included in the model and 19 possible diseases were inferred, among which common reasons of jaundice such as bile stone and drug-induced liver injury were included. These have a higher probability rank (Table 3). “Jaundice during pregnancy” is excluded, because all its disease-specific manifestations are negative; seven diseases, such as “hyperthyroidism” and “hepatolenticular nuclear lesions”, are excluded because they cannot explain two or more abnormal symptoms. During the second step, the evidence of E S i and E C i was entered into the DUCG clinical diagnosis decision system and performed by DUCG software automatically. The result indicates hepatitis C as the only result (ranking as 100%), and the simplified DUCG is shown in Fig. 4 that clearly explains the causalities of the disease and all related factors, symptoms, and test results.
Table 3.
DUCG inference results based on symptoms and physical signs
| Disease | Rank probability (%) |
| Common bile duct stone | 32.76 |
| Drug-induced liver injury | 23.52 |
| Intrahepatic bile duct stone | 13.51 |
| Hepatitis A | 9.44 |
| Cirrhosis | 7.34 |
| Hepatitis E | 6.84 |
| Gilbert syndrome | 2.55 |
| Infectious mononucleosis | 1.46 |
| Hepatitis D | 1.10 |
| Severe systemic bacterial infection | 0.62 |
| Dubin-Johnson syndrome | 0.23 |
| Hepatitis B | 0.21 |
| Hepatitis C | 0.12 |
| Primary liver cancer | 0.11 |
| Autoimmune hepatitis | 0.09 |
| Exanthematous typhus | 0.07 |
| Malaria | 0.04 |
| Pancreatic cancer | 0.01 |
| Primary biliary cirrhosis | 0.01 |
Fig. 4.
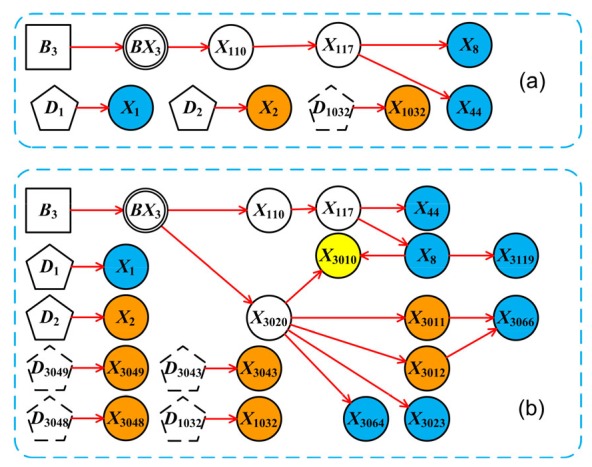
DUCG diagnostic result of a “hepatitis C” example
(a) The simplified DUCG of “hepatitis C” based on symptoms and physical signs only; (b) The simplified DUCG resulted from full evidence. The symbols are shown in Table 1. Blue circles represent decreased value lower than its lower normal limit, while yellow and orange circles represent moderate or high elevation to upper normal limit, respectively
3.2. Diagnostic performance
To verify the efficacy of the DUCG diagnostic system, we tested 203 jaundice-related cases. The overall diagnosis accuracy with evidence without laboratory or imaging tests was 83.33%, while the accuracy was raised to 99.01% with laboratory and imaging tests. The number of cases and detailed diagnostic results are presented in Table 4.
Table 4.
Overall accuracy of the DUCG diagnostic system
| Disease | Case number | Accuracy in the 1st step (%) | Accuracy in the 2nd step (%) |
| Hepatitis A | 10 | 100.00 | 100.00 |
| Hepatitis B | 10 | 100.00 | 90.00 |
| Hepatitis C | 10 | 80.00 | 100.00 |
| Hepatitis D | 10 | 80.00 | 90.00 |
| Hepatitis E | 10 | 100.00 | 100.00 |
| Undefined viral hepatitis | 10 | 90.00 | 100.00 |
| Alcoholic liver disease | 10 | 80.00 | 100.00 |
| Autoimmune hepatitis | 10 | 90.00 | 100.00 |
| NAFLD | 10 | 90.00 | 100.00 |
| Cirrhosis | 10 | 100.00 | 100.00 |
| Primary liver cancer | 10 | 100.00 | 100.00 |
| Exanthematous typhus | 2 | 100.00 | 100.00 |
| Severe systemic bacterial infection | 2 | 100.00 | 100.00 |
| Infectious mononucleosis | 8 | 100.00 | 100.00 |
| Dubin-Johnson syndrome | 3 | 100.00 | 100.00 |
| Gilbert syndrome | 4 | 100.00 | 100.00 |
| PNH | 1 | 100.00 | 100.00 |
| AHE | 6 | 83.33 | 100.00 |
| Common bile duct stone | 10 | 100.00 | 100.00 |
| IBDS | 10 | 90.00 | 100.00 |
| Pancreatic cancer | 10 | 0.00 | 100.00 |
| Primary biliary cirrhosis | 10 | 80.00 | 100.00 |
| Hyperthyroidism | 2 | 100.00 | 100.00 |
| DILI | 10 | 100.00 | 100.00 |
| Malaria | 6 | 83.33 | 100.00 |
| Jaundice of pregnancy | 1 | 100.00 | 100.00 |
| Hepatolenticular degeneration | 8 | 12.50 | 100.00 |
| Total | 203 | 84.73 | 99.01 |
NAFLD: nonalcoholic fatty liver disease; PNH: paroxysmal nocturnal hemoglobinuria; AHE: autoimmune hemolytic anemia; IBDS: intrahepatic bile duct stone; DILI: drug-induced liver injury
4. Discussion
This study proposed a computer-aided diagnostic system of jaundice in primary clinics based on the DUCG model. Intelligent diagnosis can make up for personal knowledge limitations and specialty limitations, and this could increase diagnostic efficacy and accuracy.
Since the Bayesian Network is currently a widely recognized way of dealing with uncertain causal relations, the comparison between the Bayesian Network approach and DUCG should be noted. The Bayesian Network expresses the causal relationship among variables by means of graphs and structured forms, and expresses the conditional probability distribution through a conditional probability table (Pearl, 2009). The Bayesian Network can use the evidence to achieve the forward, reverse, or hybrid probability reasoning and possesses the advantages of intuitive graphical representation, clear physical meaning, strict probabilistic theory base, easy use of statistical data, localized calculation, and a rigorous theoretical system (Xu, 2012). However, the Bayesian Network cannot deal with a static logic loop or a directed cyclic graph, and these are difficult to avoid in complex closed-loop feedback systems or interaction mechanisms in the field of complex disease diagnosis. This is because a directed cyclic graph cannot be established in Bayesian Network algorithm by its definition of a factorization graphic representation of the joint probability distribution of a set of variables. In addition, the Bayesian Network relies heavily on structural learning and parameter learning from the sample data, and when there are insufficient samples, the conditional probability table needs large and complete conditional probability parameters from domain experts, which is basically impossible to achieve. In addition, although the structure learning results of a Bayesian Network may be objective and can effectively match the sample data, it may not correspond to the knowledge structure of domain experts because its poor interpretability makes the result difficult to understand and accept by domain experts (Poole and Zhang, 2003).
In contrast, DUCG possesses the character of graphical representation and low parameter dependence, which perfectly fit the use for clinical diagnosis. DUCG uses a causal matrix to express causal effect probabilities, and does not require expression of the correspondence among all states of causal variables.
In other words, the expression of the conditional probability distribution can be incomplete, which means that in constructing the causal matrix of the DUCG knowledge base, only the concerned causal relationship and its uncertainty need to be expressed, and the “not concerned” relationship can be ignored, which greatly reduces the difficulty and complexity of DUCG knowledge base construction. In addition, the first step of DUCG reasoning calculation is a logic operation, during which the original DUCG knowledge base will be greatly reduced in size and complexity according to the input information, and qualitative possible result sets will be obtained. If the simplified DUCG knowledge base contains only one possible outcome, the inference computation is completed without any numerical calculation. So the DUCG does not require high probability accuracy and has a high robustness and stability. The benefits of this study are listed as follows.
Firstly, other inference methods, such as the Bayesian Network, rely on complex conditional probability tables and the results are hard to translate into explainable clinical language. Taking the hepatitis C case we exhibited before as an example, the DUCG system can display which abnormalities are related to the proposed diagnosis for what logical reasons. In addition, it can also tell us which abnormalities are not explained in the model. Clinicians can evaluate the proposed diagnosis with their professional knowledge rather than facing an intricate diagnosis probability. This combination can further increase diagnostic accuracy and facilitate its clinical application.
Secondly, traditional diagnostic models rely heavily on precise probability parameters, and this might directly affect the result. In this study, the DUCG model can obtain a satisfactory result with most of parameters specified by the domain experts based on their knowledge and experience. In clinical practice, with the shift of demographic characteristics and social characteristics, fixed probability faces the need of constant updating which is time-consuming and of low efficacy. With the feature of a loose probability restriction, DUCG can perform a correct diagnosis under dynamic circumstances.
5. Conclusions
The DUCG model has the features of graphical representation and low-parameter dependence, which facilitate its application in medical diagnosis. The jaundice diagnostic system possesses the advantage of easy construction, fast computation, high accuracy, and universal scope of application.
Future work will be focused on integrating semantics recognition into this system, which will automatically analyze the nature of the language used and the variants of medical nomenclature, and translate the imaging testing description into a corresponding imaging diagnosis. Such a combination will improve diagnosis accuracy and efficacy, and reduce the burden on public health care resource.
Footnotes
Project supported by the Medical and Health Research Program of Zhejiang Province (No. 2015KYB128) and the Zhejiang Provincial Natural Science Foundation (No. LQ15H030004), China
Contributors: Shao-rui HAO, Shi-chao GENG, and Lin-xiao FAN performed the experiments, analyzed data, and wrote the manuscript. Jia-jia CHEN helped with determination of F-type causal functional event. Qin ZHANG and Lan-juan LI conceived and supervised the study, and revised the manuscript.
Compliance with ethics guidelines: Shao-rui HAO, Shi-chao GENG, Lin-xiao FAN, Jia-jia CHEN, Qin ZHANG, and Lan-juan LI declare that they have no conflict of interest.
All procedures followed were in accordance with the ethical standards of the Human Ethics Committee of the First Affiliated Hospital, School of Medicine, Zhejiang University and with the Helsinki Declaration of 1975, as revised in 2008. Informed consent was obtained from all patients for being included in the study.
References
- 1.Avci E. A new expert system for diagnosis of lung cancer: GDA-LS_SVM. J Med Syst. 2012;36(3):2005–2009. doi: 10.1007/s10916-011-9660-y. [DOI] [PubMed] [Google Scholar]
- 2.Bhat S, Acharya UR, Adeli H, et al. Automated diagnosis of autism: in search of a mathematical marker. Rev Neurosci. 2014;25(6):851–861. doi: 10.1515/revneuro-2014-0036. [DOI] [PubMed] [Google Scholar]
- 3.Bhutani VK, Johnson-Hamerman L. The clinical syndrome of bilirubin-induced neurologic dysfunction. Semin Fetal Neonatal Med. 2015;20(1):6–13. doi: 10.1016/j.siny.2014.12.008. [DOI] [PubMed] [Google Scholar]
- 4.Dong C, Wang Y, Zhang Q, et al. The methodology of dynamic uncertain causality graph for intelligent diagnosis of vertigo. Comput Methods Prog Biomed. 2014;113(1):162–174. doi: 10.1016/j.cmpb.2013.10.002. [DOI] [PubMed] [Google Scholar]
- 5.Dong C, Zhang Q, Geng S. A modeling and probabilistic reasoning method of dynamic uncertain causality graph for industrial fault diagnosis. Int J Automat Comput. 2014;11(3):288–298. doi: 10.1007/s11633-014-0791-8. [DOI] [Google Scholar]
- 6.Gottesman LE, del Vecchio MT, Aronoff SC. Etiologies of conjugated hyperbilirubinemia in infancy: a systematic review of 1692 subjects. BMC Pediatrics. 2015;15(1):8. doi: 10.1186/s12887-015-0506-5. [DOI] [PMC free article] [PubMed] [Google Scholar]
- 7.Hatzilygeroudis I, Prentzas J. Integrating (rules, neural networks) and cases for knowledge representation and reasoning in expert systems. Expert Syst Appl. 2004;27(1):63–75. doi: 10.1016/j.eswa.2003.12.004. [DOI] [Google Scholar]
- 8.Keith RD, Beckley S, Garibaldi JM, et al. A multicentre comparative study of 17 experts and an intelligent computer system for managing labour using the cardiotocogram. Br J Obstet Gynaecol. 1995;102(9):688–700. doi: 10.1111/j.1471-0528.1995.tb11425.x. [DOI] [PubMed] [Google Scholar]
- 9.Kruk M, Osowski S, Markiewicz T, et al. Computer approach to recognition of Fuhrman grade of cells in clear-cell renal cell carcinoma. Anal Quant Cytopathol Histpathol. 2014;36(3):147–160. [PubMed] [Google Scholar]
- 10.Lee GH. Rule-based and case-based reasoning approach for internal audit of bank. Knowl-Based Syst. 2008;21(2):140–147. doi: 10.1016/j.knosys.2007.04.001. [DOI] [Google Scholar]
- 11.Li P, Bi T, Huang J, et al. Breast cancer early diagnosis based on hybrid strategy. Biomed Mater Eng. 2014;24(6):3397–3404. doi: 10.3233/bme-141163. [DOI] [PubMed] [Google Scholar]
- 12.Madabhushi A, Doyle S, Lee G, et al. Integrated diagnostics: a conceptual framework with examples. Clin Chem Lab Med. 2010;48(7):989–998. doi: 10.1515/CCLM.2010.193. [DOI] [PubMed] [Google Scholar]
- 13.Malek S, Phillips R, Mohsen A, et al. Computer assisted orthopaedic surgical system for insertion of distal locking screws in intra-medullary nails: a valid and reliable navigation system. Int J Med Robot Comput Assist Surg. 2005;1(4):34–44. doi: 10.1002/rcs.54. [DOI] [PubMed] [Google Scholar]
- 14.Oladipupo OO, Uwadia CO, Ayo CK. Improving medical rule-based expert systems comprehensibility: fuzzy association rule mining approach. Int J Artif Intell Soft Comput. 2012;3(1):29–38. doi: 10.1504/IJAISC.2012.048179. [DOI] [Google Scholar]
- 15.Pearl J. Causality: Models, Reasoning, and Inference. New York: Cambridge University Press; 2009. [DOI] [Google Scholar]
- 16.Poole D, Zhang NL. Exploiting contextual independence in probabilistic inference. J Artif Intell Res. 2003;18:263–313. [Google Scholar]
- 17.Sasikumar M, Ramani S, Raman SM, et al. A practical introduction to rule based expert systems. New Delhi: Narosa Publishing House; 2007. [Google Scholar]
- 18.Shen Y, Colloc J, Jacquet-Andrieu A, et al. Emerging medical informatics with case-based reasoning for aiding clinical decision in multi-agent system. J Biomed Inform. 2015;56:307–317. doi: 10.1016/j.jbi.2015.06.012. [DOI] [PubMed] [Google Scholar]
- 19.Siniscalchi SM, Svendsen T, Lee C. An artificial neural network approach to automatic speech processing. Neurocomputing. 2014;140:326–338. doi: 10.1016/j.neucom.2014.03.005. [DOI] [Google Scholar]
- 20.Suk HI, Lee SW, Shen D. Subclass-based multi-task learning for Alzheimer’s disease diagnosis. Front Aging Neurosci. 2014;6:168. doi: 10.3389/fnagi.2014.00168. [DOI] [PMC free article] [PubMed] [Google Scholar]
- 21.Xu BG. Intelligent fault inference for rotating flexible rotors using bayesian belief network. Expert Syst Appl. 2012;39(1):816–822. doi: 10.1016/j.eswa.2011.07.079. [DOI] [Google Scholar]
- 22.Zhang Q. Dynamic uncertain causality graph for knowledge representation and reasoning: discrete DAG cases. J Comput Sci Technol. 2012;27(1):1–23. doi: 10.1007/s11390-012-1202-7. [DOI] [Google Scholar]
- 23.Zhang Q. Dynamic uncertain causality graph for knowledge representation and probabilistic reasoning: directed cyclic graph and joint probability distribution. IEEE Trans Neural Netw Learn Syst. 2015;26(7):1503–1517. doi: 10.1109/TNNLS.2015.2402162. [DOI] [PubMed] [Google Scholar]
- 24.Zhang Q. Dynamic uncertain causality graph for knowledge representation and reasoning: continuous variable, uncertain evidence, and failure forecast. IEEE Trans Syst Man Cybern Syst. 2015;45(7):990–1003. doi: 10.1109/TSMC.2015.2392711. [DOI] [Google Scholar]
- 25.Zhang Q, Geng S. Dynamic uncertain causality graph applied to dynamic fault diagnoses of large and complex systems. IEEE Trans Reliab. 2015;64(3):910–927. doi: 10.1109/TR.2015.2416332. [DOI] [Google Scholar]
- 26.Zhang Q, Dong C, Cui Y, et al. Dynamic uncertain causality graph for knowledge representation and probabilistic reasoning: statistics base, matrix, and application. IEEE Trans Neural Netw Learn Syst. 2014;25(4):645–663. doi: 10.1109/TNNLS.2013.2279320. [DOI] [PubMed] [Google Scholar]


