Abstract
A near infrared spectroscopy (NIRS) approach was established for quality control of the alcohol precipitation liquid in the manufacture of Codonopsis Radix. By applying NIRS with multivariate analysis, it was possible to build variation into the calibration sample set, and the Plackett-Burman design, Box-Behnken design, and a concentrating-diluting method were used to obtain the sample set covered with sufficient fluctuation of process parameters and extended concentration information. NIR data were calibrated to predict the four quality indicators using partial least squares regression (PLSR). In the four calibration models, the root mean squares errors of prediction (RMSEPs) were 1.22 μg/ml, 10.5 μg/ml, 1.43 μg/ml, and 0.433% for lobetyolin, total flavonoids, pigments, and total solid contents, respectively. The results indicated that multi-components quantification of the alcohol precipitation liquid of Codonopsis Radix could be achieved with an NIRS-based method, which offers a useful tool for real-time release testing (RTRT) of intermediates in the manufacture of Codonopsis Radix.
Keywords: Near infrared spectroscopy, Codonopsis Radix, Alcohol precipitation, Real-time release testing, Multi-components quantification
1. Introduction
Codonopsis Radix is a traditional and extensively used Chinese herbal medicine with the effect of replenishing energy deficiency, strengthening the immune system, improving poor gastrointestinal function, gastric ulcers and appetite, decreasing blood pressure, etc. (Zhao et al., 2006). In the manufacture of Chinese patent drugs derived from Codonopsis Radix, alcohol precipitation is a vital purification unit because many alcohol-insoluble impurities, such as polysaccharides, proteins, tannins, pigments, and salts, are removed from the concentrated decoction, (Koh et al., 2009; Gong et al., 2014b) and the qualities of intermediates and the finished products in the following processes are affected by this purification unit.
Real-time release testing (RTRT), which appeared in the International Council for Harmonisation (ICH) Q8 (ICH, 2009), provides quality assurance of the final products based on information collected during the manufacturing process. Namely, the combination of critical material attributes (CMAs) and the data obtained during process control is taken as releasing reference to assess the quality of intermediates or final products, ensuring that the accepted criteria are implemented and thus achieving the consistency of each batch. As a consequence, quality control is gradually moving upstream in the manufacturing process and tests for products of each operating unit are of significant importance.
Due to the complicated ingredients in Codonopsis Radix, it is insufficient to realize quality control only through a single indicator. Lobetyolin is chosen as a marker compound for the identification of Codonopsis Radix in the Chinese Pharmacopeia (National Commission of Chinese Pharmacopoeia, 2015) and it is found that lobetyolin is frequently chosen as a quantitative indicator in practice (Qiao et al., 2007; He et al., 2014; Kim et al., 2014). Flavonoids are compounds with potential bioactivity (He et al., 2004). The total solid contents represent the total soluble solids (mostly saccharides) that are partly removed during alcohol precipitation. The color of products can also be used as a comprehensive apparent index of drug quality, giving a direct view of variance in different batches. Therefore, in this study, lobetyolin, total flavonoids, pigments, and total solid contents were taken into consideration and defined as critical quality attributes (CQAs) of the alcohol precipitation liquid. With the aim of accurately measuring these quality indices, high-performance liquid chromatography (HPLC) (Qiao et al., 2007; He et al., 2014; Kim et al., 2014), colorimetric assay (Han et al., 2013; Gong et al., 2014a), and gravimetric assay (Li et al., 2013) are most commonly adopted as standard quantitative methods. However, these methods are tedious and somewhat time-consuming, failing to satisfy the demand for real-time monitoring.
Near infrared spectroscopy (NIRS) has the advantage of convenience, and being versatile, nondestructive, and rapid, and hence is a good process analytical technology (PAT) tool for real-time analysis and is widely used in the pharmaceutical industry. It has already shown a great application in the analysis of chemical (Islam et al., 2015) and biological medicines (Wang F. et al., 2015). When it comes to traditional Chinese medicines (TCMs), NIRS was successfully used for quantitative assays (Wang P. et al., 2015) and identification (Li et al., 2016) and classification of TCMs (Wang and Yu, 2015). Moreover, NIRS is frequently adopted on-or at-line in different manufacturing units such as decoction (Wu et al., 2011), alcohol precipitation (Huang and Qu, 2011), and quality inspection of final products (Li et al., 2015). In the case of Codonopsis Radix, NIRS combined with chemometrics was able to discriminate Codonopsis pilosula of different origins (Li et al., 2012). However, there have been few reported studies focusing on the manufacture of Codonopsis Radix, and the application of NIRS to the rapid quantitative analyses of the four CQAs in alcohol precipitation liquid has not been previously reported.
The objective of this study was to establish a feasible NIRS approach for quality control of the alcohol precipitation liquid of Codonopsis Radix, and to achieve RTRT of intermediates in Codonopsis Radix manufacturing.
2. Materials and methods
2.1. Design of experiments
As the CQAs of the alcohol precipitation liquid are influenced by different process parameters, design of experiments (DOE) was used to create experiments with different process parameters, achieving alcohol precipitation liquid samples with rich process information, which helped to build robust calibration models. In the present study, seven process parameters, namely total solid contents of concentrated decoction, mass ratio of ethanol to concentrated decoction, ethanol concentration, ethanol adding time, stirring speed, refrigeration temperature, and refrigeration time, were considered and experiments of 15 runs designed by Plackett-Burman were conducted. As was illustrated in our previous study (Xu et al., 2015), total solid contents of concentrated decoction, mass ratio of ethanol to concentrated decoction, and ethanol concentration were identified as critical process parameters (CPPs). On this basis, a three-variable, three-level Box-Behnken design was employed to further vary the combination of CPPs. Schematic charts of the experimental setup are shown in Tables 1 and 2. A set of 30 independent samples were prepared, with the fluctuation information of process conditions included.
Table 1.
Schematic chart of experiments by Plackett-Burman design
| Order | Total solid contents of concentrated decoction (%) | Mass ratio of ethanol to concentrated decoction (g/g) | Ethanol concentration (%) | Ethanol adding time (min) | Stirring speed (r/min) | Refrigeration temperature (°C) | Refrigeration time (h) |
| DOE 1 | 50 | 3 | 89 | 30 | 400 | 25 | 12 |
| DOE 2 | 30 | 3 | 95 | 10 | 400 | 25 | 36 |
| DOE 3 | 50 | 1 | 95 | 30 | 200 | 25 | 36 |
| DOE 4 | 30 | 3 | 89 | 30 | 400 | 5 | 36 |
| DOE 5 | 30 | 1 | 95 | 10 | 400 | 25 | 12 |
| DOE 6 | 30 | 1 | 89 | 30 | 200 | 25 | 36 |
| DOE 7 | 50 | 1 | 89 | 10 | 400 | 5 | 36 |
| DOE 8 | 50 | 3 | 89 | 10 | 200 | 25 | 12 |
| DOE 9 | 50 | 3 | 95 | 10 | 200 | 5 | 36 |
| DOE 10 | 30 | 3 | 95 | 30 | 200 | 5 | 12 |
| DOE 11 | 50 | 1 | 95 | 30 | 400 | 5 | 12 |
| DOE 12 | 30 | 1 | 89 | 10 | 200 | 5 | 12 |
| DOE 13 | 40 | 2 | 92 | 20 | 300 | 15 | 24 |
| DOE 14 | 40 | 2 | 92 | 20 | 300 | 15 | 24 |
| DOE 15 | 40 | 2 | 92 | 20 | 300 | 15 | 24 |
Table 2.
Box-Behnken design for ethanol precipitation with CPPs
| Order | Total solid contents of concentrated decoction (%) | Mass ratio of ethanol to concentrated decoction (g/g) | Ethanol concentration (%) |
| DOE 1 | 30 | 1 | 92 |
| DOE 2 | 50 | 1 | 92 |
| DOE 3 | 30 | 3 | 92 |
| DOE 4 | 50 | 3 | 92 |
| DOE 5 | 30 | 2 | 89 |
| DOE 6 | 50 | 2 | 89 |
| DOE 7 | 30 | 2 | 95 |
| DOE 8 | 50 | 2 | 95 |
| DOE 9 | 40 | 1 | 89 |
| DOE 10 | 40 | 3 | 89 |
| DOE 11 | 40 | 1 | 95 |
| DOE 12 | 40 | 3 | 95 |
| DOE 13 | 40 | 2 | 92 |
| DOE 14 | 40 | 2 | 92 |
| DOE 15 | 40 | 2 | 92 |
The other four process parameters: alcohol adding time was maintained at 20 min, stirring speed was set at 300 r/min, refrigeration temperature was 5 °C, and refrigeration time was 12 h
2.2. Preparation of sample set
Alcohol precipitation experiments were conducted as described in Tables 1 and 2. A 15-g concentrated decoction of Codonopsis Radix combined with water was added to a 250-ml conical flask. Alcohol was added at constant speed using a peristaltic pump. Stirring continued for 10 min after all the alcohol was added. The conical flasks were then placed in a cryogenic bath, and the supernatants were collected as alcohol precipitation liquid (see Tables 1 and 2 for the variables in these experiments).
In order to establish a robust quantitative model of the alcohol precipitation liquid, the sample set needs to be enlarged and the distribution range of concentrations extended. For this reason, 40 samples at different concentrations were prepared using a concentrating-diluting method. The 30 samples described in Tables 1 and 2 (retained for measurement previously) were randomly mixed together to a certain volume giving 5 mixture solutions and then were concentrated to approximately half of their original volume with a rotary evaporator. The concentrated mixture solutions were then diluted with 50% ethanol-water (v/v) several times (each dilution rate was casually set to avoid colinearity). After each dilution, a sample (about 10 ml) was collected. In this way, the sample set consisted of 70 samples, in which 30 samples were prepared from experimental designs and 40 samples were prepared in a concentrating-diluting manner. Thus, the sample set was representative and covered sufficient variation of operation conditions and contents information.
2.3. NIR spectrum acquisition
NIR spectra were collected in transmission mode using an Antaris FT-NIR spectrophotometer (Thermo Nicolet Corporation, Madison, WI, USA) fitted with an InGaAs detector and a 2-mm path length cuvette. Instrument resolution is specified at 4 cm−1. Each spectrum was acquired by averaging 64 scans across the wavenumber range of 4000–10 000 cm−1, while background spectra were obtained against air. The spectral data were measured at 1.9285 cm−1 intervals, which resulted in 3112 variables. All the spectra were acquired under the same conditions, and the samples were equilibrated to room temperature (25 °C) prior to NIR spectra collecting.
2.4. Reference assays
The four quality indicators were measured by corresponding standard assays. The quantitative analysis of lobetyolin was performed using the HPLC method. The analysis was conducted on an Agilent 1100 series HPLC apparatus (Agilent Technologies, Waldbronn, Germany) with a Zorbax SB-C18 column (5 μm particles, 4.6 mm i.d.×250 mm; Agilent). Column temperature was maintained at 30 °C, with the mobile phase of 20% acetonitrile-water (v/v). Flow rate was set at 1.0 ml/min, while the injection volume was 10 μl, and the detection wavelength was set at 269 nm. Sodium nitrite-aluminium nitrate (Shi et al., 2012) and tartrazine colorimetric methods (Gong et al., 2014a) were used to quantify total flavonoids and pigments, respectively. A gravimetric based loss-on-drying method was run to determine the concentration of total solid by hot air dying at 105 °C for 3 h.
2.5. Data analysis
The Chauvenet test was firstly employed to identify and remove the abnormal samples. The sample set was then divided into a calibration set and a validation set at a ratio of 5/1 in a random way, meaning that 57 samples were assigned into the calibration set to build a quantitative model of the four indicators and the remaining 11 samples were assigned into the validation set to evaluate the predictive ability of the established models. A suitable multivariate partial least squares regression (PLSR) method was selected by comparing the principal component regression (PCR) with the step-wise multiple linear regression (SMLR). Different combinations of pretreatment methods were further compared and appropriate wavebands were selected to build models. Eventually leave-one-out cross-validation was used to fix a suitable number of principle components to establish a regression model with high performance. The TQ analyst software package (Thermo Fisher scientific, Madison, WI, USA) was used for data processing and computation.
2.6. Evaluation index of a quantitative model
The quantitative performance of an established model was indicated by the root mean square error (RMSE) and correlation coefficient (R). All the RMSE values are based on Eq. (1):
 , ,
|
(1) |
where n is the number of samples, ci is the value obtained from the reference method for sample i, and ĉi is the predicted value for sample i. RMSE of calibration (RMSEC), RMSE of cross-validation (RMSECV), and RMSE of prediction (RMSEP) differ in the determination of ĉi.
The correlation coefficient (R) is illustrated in Eq. (2):
 , ,
|
(1) |
where is the average of reference values. The small values of RMSEC, RMSECV, and RMSEP are indications of the good performance of the NIRS method: the closer the values of R are to 1, the better the NIRS method.
3. Results
3.1. Outlier detection
When building a model from spectral data, outliers may exist originating from operational and instrumental errors or extreme concentrations leading to an uneven distribution (Valderrama et al., 2007). The effect of outliers cannot be ignored, and they should be excluded before calibration. A Chauvennet test was done to identify and remove outliers from the sample sets. A mean spectrum was calculated firstly and the Mahalanobis distances between the mean spectrum and the spectrum of each sample were measured, as presented in Fig. 1. The Chauvennet test was applied to the sample with the highest rank to see if it was statistically different from the sample with the next highest rank, and this process was continued until a sample passed the test. Two samples failed to pass the Chauvennet test (Fig. 1), and were excluded from the sample set.
Fig. 1.
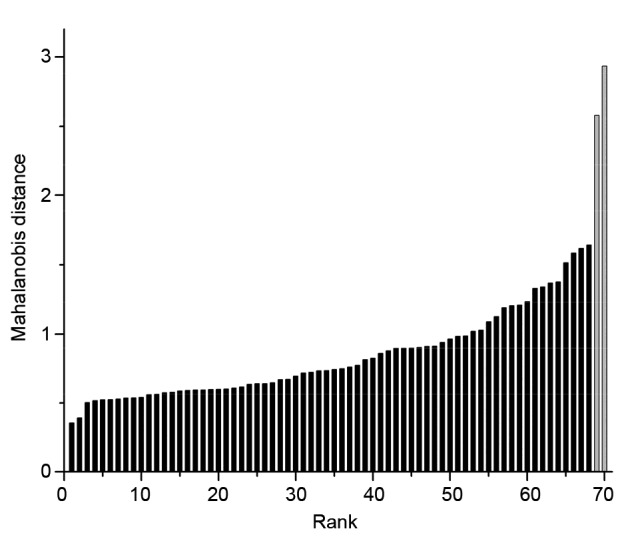
Sample rank in the order of Mahalanobis distance
The two samples with largest Mahalanobis distance values and failing to pass the Chauvennet test were marked in grey
3.2. Sample set partition and reference assays
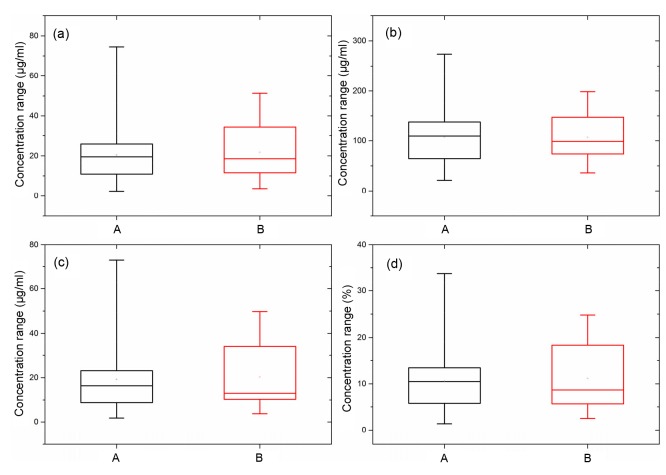
After the removal of outliers, the remaining 68 samples were randomly divided into calibration and validation sets at a ratio of 5/1, according to the reference assays of the sample set. Information on the two sets can be found in Table 3. The concentration distribution of the four quality indicators is displayed in Fig. 2. It reveals that the validation set covers a large range of the calibration set and is therefore representative of the present content range. The sample set was further inspected in a lower dimensional space, which was analyzed by principle component analysis (PCA). The first three components (PC1, PC2, and PC3) accounted for 63.2%, 12.3%, and 8.4% of the total variance in the data, respectively. As illustrated in Fig. 3, the score plot of PC1, PC2, and PC3 reveals that the sample set is evenly distributed.
Table 3.
Concentration information of the calibration set and validation set
| Sample set | Lobetyolin (μg/ml) | Total flavonoids (μg/ml) | Pigments (μg/ml) | Total solid contents (%) |
| Calibration set (n=57) | ||||
| Range | 2.4–74.5 | 21.5–209.4 | 1.8–72.9 | 1.4–33.8 |
| Mean | 20.4 | 105.5 | 19.2 | 10.6 |
| RSD (%) | 70.9 | 46.0 | 80.4 | 64.8 |
| Validation set (n=11) | ||||
| Range | 3.7–51.4 | 36.0–198.4 | 3.7–49.7 | 2.5–24.8 |
| Mean | 21.8 | 106.7 | 20.3 | 11.2 |
| RSD (%) | 70.0 | 45.8 | 80.4 | 67.0 |
RSD: relative standard deviation
Fig. 2.
Reference results: concentration ranges of calibration set and validation set of the four indicators
(a) Lobetyolin; (b) Total flavonoids; (c) Pigments; (d) Total solid contents. A represents calibration set and B represents validation set
Fig. 3.
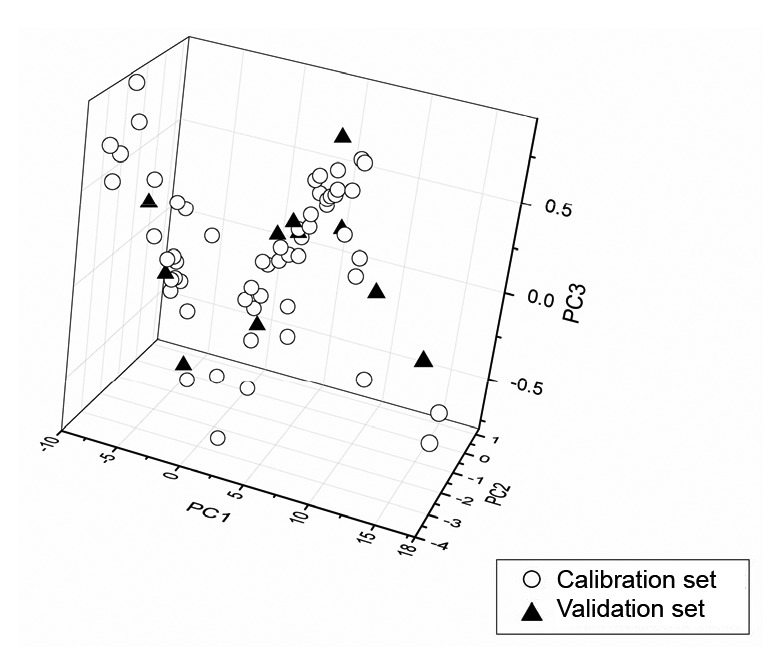
PCA score plot of sample set in the first three principle component (PC) directions
The first three components accounted for 63.2%, 12.3%, and 8.4% of the total variance, respectively
3.3. Comparison of regression methods
In the quantitative analysis of NIR spectra, the commonly used multivariate algorithms are multiple linear regression (MLR), SMLR, PCR, and PLSR. A comparison between SMLR, PCR, and PLSR was made to select the most suitable regression method. The comparison results are listed in Table 4, taking the obtained quantitative model of lobetyolin as an example. The PLSR model has the best performance in RMSEC, RMSEP, RMSECV, and R values among the three models. As SMLR is suitable for simple linear samples and fails to take full advantage of spectral information (Draper and Smith, 1998), the model performance is significantly improved when using PCR and PLSR, which decompose the spectral matrix and regress with score vectors (Geladi and Kowalski, 1986). Therefore, all models were eventually established using PLSR.
Table 4.
Comparison results of different regression methods of lobetyolin
| Regression method | R C | RMSEC (μg/ml) | R CV | RMSECV (μg/ml) | R P | RMSEP (μg/ml) |
| SMLR | 0.8246 | 8.12 | 0.7999 | 8.62 | 0.7231 | 11.10 |
| PCR | 0.9734 | 3.29 | 0.9379 | 5.00 | 0.9434 | 5.76 |
| PLSR | 0.9964 | 1.21 | 0.9743 | 3.23 | 0.9587 | 5.18 |
R: correlation coefficient; RMSE: root mean squares error; C: calibration; CV: cross-validation; P: prediction; SMLR: step-wise multiple linear regression; PCR: principal component regression; PLSR: partial least squares regression
3.4. Spectral pre-procession
NIR spectra contain much sample information, but they may also include instrumental and experimental artifacts. Appropriate pretreatments of spectra could transform the raw data to “cleaned data” by removing unwanted artifacts and highlighting the variation of interest (Engel et al., 2013). As NIR spectra are influenced by many factors, such as noise, scattering, and baseline offset, different spectral pretreatments are employed to reduce unwanted variation. The pre-processing strategy was chosen according to the goal of the analysis—a “trial-and-error” approach (Engel et al., 2013). Different combinations of pretreatments were processed on the spectra to yield an optimal model. From the comparative results in Table 5, the performance of the model constructed from raw spectra is better than that of 1st or 2nd derivation. This might result from the enhanced noise signals worsen the model’s predicted performance (Rinnan et al., 2009). Multiplicative scatter correction (MSC), which is similar to standard normal variate (SNV) (Fearn et al., 2009), is applied to correct artifacts caused by light scattering. Savitzky-Golay (SG) polynomial derivative filter (Savitzky and Golay, 1964) and Norris-Williams (NW) derivation (Norris and Williams, 1984) are both smoothing methods commonly used to decrease the detrimental effect on the signal-to-noise ratio, while NW derivation can be used only to process 1st or 2nd derivation spectra. By comparing each performance index, the best results were obtained using MSC in combination with SG derivation (7-point window and a third-order polynomial). This achieved fewer factors and lower RMSEP value compared with the results from raw data.
Table 5.
Comparison of lobetyolin models with different spectral pretreatments
| Pretreatment | LV | R C | RMSEC (μg/ml) | R CV | RMSECV (μg/ml) | R P | RMSEP (μg/ml) |
| Raw spectra | 10 | 0.9964 | 1.21 | 0.9743 | 3.23 | 0.9587 | 5.18 |
| MSC+NWa+1st | 4 | 0.9263 | 5.41 | 0.8132 | 8.47 | 0.8641 | 8.17 |
| MSC+SGb+1st | 8 | 0.9928 | 1.73 | 0.8900 | 6.56 | 0.8936 | 7.24 |
| MSC+SGb+2nd | 9 | 0.9913 | 1.89 | 0.8516 | 3.60 | 0.8015 | 9.92 |
| MSC+SGb | 9 | 0.9953 | 1.38 | 0.9747 | 3.21 | 0.9716 | 4.68 |
| SNV+SGb | 10 | 0.9957 | 1.33 | 0.9746 | 3.22 | 0.9710 | 4.73 |
| SGb | 10 | 0.9958 | 1.32 | 0.9755 | 3.17 | 0.9643 | 5.01 |
Norris-Williams (NW) derivation using a 5-point smoothing and a gap size of 5;
Savitzky-Golay (SG) polynomial derivative filter with a 7-point window and a third-order polynomial. MSC: multiplicative scatter correction; SNV: standard normal variate; LV: latent variable; R: correlation coefficient; RMSE: root mean squares error; C: calibration; CV: cross-validation; P: prediction
3.5. Variable selection
The spectral wave range used for modeling significantly affects model performance and calculation efficiency. Owing to the strongly overlapping and correlating spectra, selection of suitable wavebands, which contain useful absorbance information of analytes, should always be considered. Spectral regions were optimized by testing models on different regions, and comparative results can be seen in Table 6. The data suggest that the wider wave range does not necessarily mean a better model performance. As shown in the NIR spectra (Fig. 4), there were two strong absorption peaks at 4300 and 5200 cm−1, which were related with C–H and O–H overtones (Workman and Weyer, 2008). Models exhibited better performance (lower RMSE values) after removing these water peaks. Reducing the amount of data used to construct models can bring down the disturbance of irrelevant regions, resulting in more efficient use of spectral data. Wavebands were narrowed to 5500–s6300 cm−1 (lobetyolin quantification model taken as an example).
Table 6.
Performance indices of the established models for the lobetyolin using different regressions
| Spectrum region (cm−1) | Region percentage (%) | LV | R C | RMSEC (μg/ml) | R CV | RMSECV (μg/ml) | R P | RMSEP (μg/ml) |
| 4000–10000 | 100 | 9 | 0.9953 | 1.38 | 0.9747 | 3.21 | 0.9716 | 4.68 |
| 5500–6300 | 13 | 7 | 0.9975 | 1.02 | 0.9946 | 1.49 | 0.9974 | 1.22 |
| 5500–10000 | 75 | 5 | 0.9931 | 1.69 | 0.9905 | 1.97 | 0.9959 | 1.44 |
LV: latent variable; R: correlation coefficient; RMSE: root mean squares error; C: calibration; CV: cross-validation; P: prediction
Fig. 4.
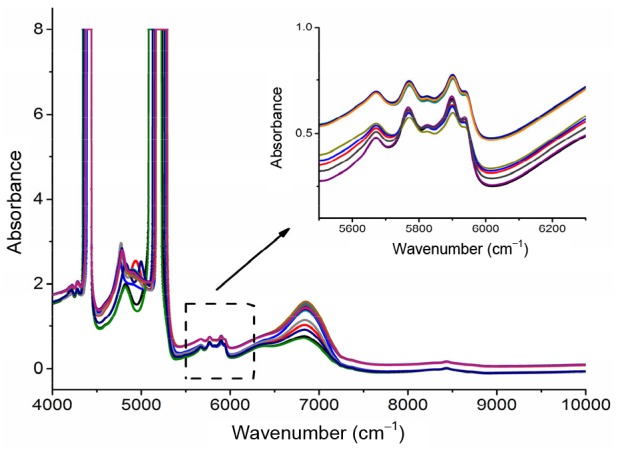
NIR spectra of alcohol precipitation liquid of Codonopsis Radix
The wavebands selected for lobetyolin model are shown in detail
3.6. Determination of the optimal number of PLS factors
When constructing a quantitative model, the number of factors participating in regression should also be selected properly. The calibration model may not accurately describe the behavior of components if the number of factors is too small or too large. Leave-one-out cross-validation was run to decide the optimum number of latent variables (LVs) for each model, in which RMSECV and predicted residual error sum of squares (PRESS) were used to determine the number of PLS factors. Fig. 5 presents how the prediction error develops with the increasing number of factors adopted for calibration (taking the lobetyolin model). As there is no significant change of PRESS value or RMSECV value from 7 PLS factors, this number of latent variables was selected for the lobetyolin model. The factors of other models were obtained in the same way (Fig. S1).
Fig. 5.
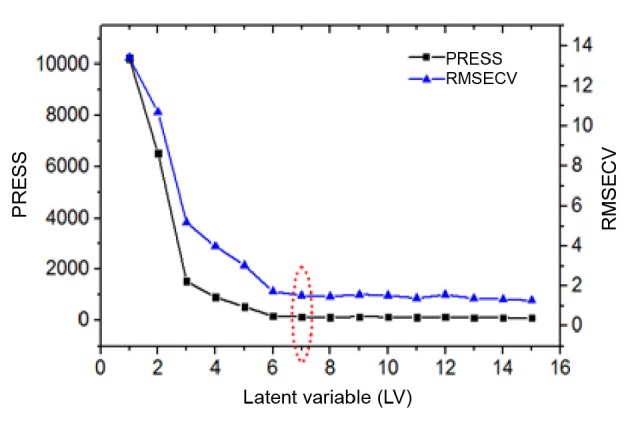
Scree plot: results of different latent variables for lobetyolin regression model
Seven latent variables were considered as the optimum number for lobetyolin model. PRESS: predicted residual error sum of squares; RMSECV: root mean square error of cross-validation
3.7. Evaluation of calibration models
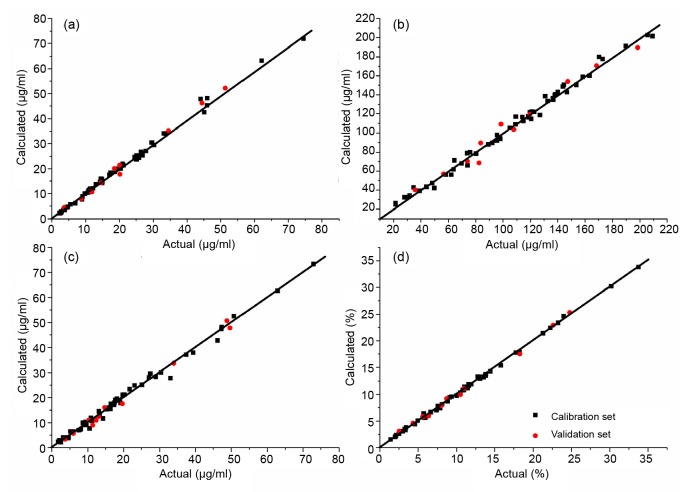
Based on the above optimization results, multivariate calibration models were established for NIR spectra and lobetyolin, total flavonoids, pigments, and total solid contents by PLSR. The detailed performance of final models is summarized in Table 7. Promising results in terms of high correlation coefficients with low prediction errors were obtained, and the RMSEPs in relation to the mean values of actual values were 5.6%, 9.8%, 7.0%, and 3.9% for lobetyolin, total flavonoids, pigments, and total solid contents, respectively. Differences between RMSECV and RMSEP were small (RMSECV/RMSEP values were close to 1), suggesting that the robustness of the models is satisfactory. Fig. 6 presents the good correlation plots between reference values versus NIR predictions for PLS models of lobetyolin, total flavonoids, pigments, and total solid contents. It can be concluded from the parameters that reference values are well fitted with NIR spectra and the four final models achieve satisfactory predictive capacity.
Table 7.
Performance indices of the four established quantitative calibration models
| Quality indicator | Wavelength (cm−1) | LV | Calibration |
Cross-validation |
Validation |
RMSECV/RMSEP | |||
| R C | RMSEC | R CV | RMSECV | R P | RMSEP | ||||
| Lobetyolin | 5500–6300 | 7 | 0.9975 | 1.02 μg/ml | 0.9946 | 1.49 μg/ml | 0.9974 | 1.22 μg/ml | 1.2 |
| Total flavonoids | 5500–6300 | 7 | 0.9835 | 8.69 μg/ml | 0.9748 | 10.80 μg/ml | 0.9759 | 10.50 μg/ml | 1.0 |
| Pigments | 5400–6100 | 9 | 0.9963 | 1.31 μg/ml | 0.9932 | 1.78 μg/ml | 0.9965 | 1.43 μg/ml | 1.2 |
| Total solid contents | 5400–7300 | 9 | 0.9993 | 0.256% | 0.9985 | 0.381% | 0.9982 | 0.433% | 0.9 |
LV: latent variable; R: correlation coefficient; RMSE: root mean squares error; C: calibration; CV: cross-validation; P: prediction
Fig. 6.
Correlation plots between reference actual values versus NIR predictions for PLS models of lobetyolin (a), total flavonoids (b), pigments (c), and total solid contents (d)
4. Discussion
This study explored a rapid NIR method for determination of the four quality indicators of alcohol precipitation liquid. The sample set encompassed the process variability and concentration variability and the final PLS calibration models of NIR data resulted in low RMSEP and RMSECV values. The results suggested that NIRS combined with proper multivariate analysis can be a good analytical tool for quality control of intermediates in the manufacturing and on-line monitoring of different production steps of Codonopsis Radix. This approach can largely reduce the time and resources needed for batch tests in the lab, and the analytical methodology offers the potential to achieve RTRT of intermediates in Codonopsis Radix manufacturing. With further research into basic chemical substances of herbal medicines, NIRS in combination with chemometrics, which could provide comprehensive sample information, will be a promising integrated quality control technology.
List of electronic supplemental materials
Scree plot: results of different latent variables for regression models
Footnotes
Project supported by the National Basic Research Program (973) of China (No. 2012CB518405) and the Zhejiang Traditional Medical Science and Technology Projects (No. 2015ZB023), China
Electronic supplementary materials: The online version of this article((http://dx.doi.org/10.1631/jzus.B1600141)contains supplementary materials, which are available to authorized users
Compliance with ethics guidelines: Yu LUO, Wen-long LI, Wen-hua HUANG, Xue-hua LIU, Yan-gang SONG, and Hai-bin QU declare that they have no conflict of interest.
This article does not contain any studies with human or animal subjects performed by any of the authors.
References
- 1.Draper NR, Smith H. Applied Regression Analysis. Wiley Interscience, New York; 1998. pp. 338–339. [Google Scholar]
- 2.Engel J, Gerretzen J, Szymanska E, et al. Breaking with trends in pre-processing? TrAC Trends Anal Chem. 2013;50:96–106. doi: 10.1016/j.trac.2013.04.015. [DOI] [Google Scholar]
- 3.Fearn T, Riccioli C, Garrido-Varo A, et al. On the geometry of SNV and MSC. Chemom Intell Lab Syst. 2009;96(1):22–26. doi: 10.1016/j.chemolab.2008.11.006. [DOI] [Google Scholar]
- 4.Geladi P, Kowalski BR. Partial least-squares regression:a tutorial. Anal Chim Acta. 1986;185:1. doi: 10.1016/0003-2670(86)80028-9. [DOI] [Google Scholar]
- 5.Gong XC, Zhang Y, Pan JY, et al. Optimization of the ethanol recycling reflux extraction process for saponins using a design space approach. PLoS ONE. 2014;9(12):e114300. doi: 10.1371/journal.pone.0114300. [DOI] [PMC free article] [PubMed] [Google Scholar]
- 6.Gong XC, Li Y, Qu HB. Removing tannins from medicinal plant extracts using an alkaline ethanol precipitation process: a case study of Danshen injection. Molecules. 2014;19(11):18705–18720. doi: 10.3390/molecules191118705. [DOI] [PMC free article] [PubMed] [Google Scholar]
- 7.Han HF, Zhang L, Zhang Y, et al. Rapid analysis of the in-process extract solutions of compound E Jiao oral liquid using near infrared spectroscopy and partial least-squares regression. Anal Methods. 2013;5(19):5272–5278. doi: 10.1039/c3ay40989a. [DOI] [Google Scholar]
- 8.He JY, Zhu S, Komatsu K. HPLC/UV analysis of polyacetylenes, phenylpropanoid and pyrrolidine alkaloids in medicinally used Codonopsis species. Phytochem Anal. 2014;25(3):213–219. doi: 10.1002/pca.2494. [DOI] [PubMed] [Google Scholar]
- 9.He Q, Zhu EY, Wang ZT, et al. Flavones isolated from Codonopsis xundianensis . J Chin Pharm Sci. 2004;13(3):212–213. [Google Scholar]
- 10.Huang HX, Qu HB. In-line monitoring of alcohol precipitation by near-infrared spectroscopy in conjunction with multivariate batch modeling. Anal Chim Acta. 2011;707(1-2):47–56. doi: 10.1016/j.aca.2011.09.031. [DOI] [PubMed] [Google Scholar]
- 11.ICH (International Council for Harmonisation) ICH Harmonised Tripartite Guideline Q8(R2): Pharmaceutical Development, Current Step 4 version; 2009. [Google Scholar]
- 12.Islam MT, Scoutaris N, Maniruzzaman M, et al. Implementation of transmission NIR as a PAT tool for monitoring drug transformation during HME processing. Eur J Pharm Biopharm. 2015;96:106–116. doi: 10.1016/j.ejpb.2015.06.021. [DOI] [PubMed] [Google Scholar]
- 13.Kim EY, Kim JA, Jeon HJ, et al. Chemical fingerprinting of Codonopsis pilosula and simultaneous analysis of its major components by HPLC-UV. Arch Pharm Res. 2014;37(9):1148–1158. doi: 10.1007/s12272-014-0335-3. [DOI] [PubMed] [Google Scholar]
- 14.Koh GY, Chou GX, Liu ZJ. Purification of a water Extract of Chinese sweet tea plant (Rubus suavissimus S. Lee) by alcohol precipitation. J Agric Food Chem. 2009;57(11):5000–5006. doi: 10.1021/jf900269r. [DOI] [PMC free article] [PubMed] [Google Scholar]
- 15.Li BX, Wei YH, Duan HG, et al. Discrimination of the geographical origin of Codonopsis pilosula using near infrared diffuse reflection spectroscopy coupled with random forests and k-nearest neighbor methods. Vib Spectrosc. 2012;62:17–22. doi: 10.1016/j.vibspec.2012.05.001. [DOI] [Google Scholar]
- 16.Li WL, Cheng ZW, Wang YF, et al. A study on the use of near-infrared spectroscopy for the rapid quantification of major compounds in Tanreqing injection. Spectrochim Acta Part A. 2013;101:1–7. doi: 10.1016/j.saa.2012.09.044. [DOI] [PubMed] [Google Scholar]
- 17.Li WL, Han HF, Zhang L, et al. A feasibility study on the non-invasive analysis of bottled compound E Jiao oral liquid using near infrared. Sens Actuators B. 2015;211:131–137. doi: 10.1016/j.snb.2015.01.073. [DOI] [Google Scholar]
- 18.Li WL, Han HF, Zhang L, et al. Manufacturer identification and storage time determination of “Dong’e Ejiao” using near infrared spectroscopy and chemometrics. J Zhejiang Univ-Sci B (Biomed & Biotechnol) 2016;17(5):382–390. doi: 10.1631/jzus.B1500186. [DOI] [PMC free article] [PubMed] [Google Scholar]
- 19.National Commission of Chinese Pharmacopoeia. Pharmacopoeia of the People’s Republic of China. Chemical Industry Press, Beijing; 2015. p. 264. (in Chinese) [Google Scholar]
- 20.Norris KH, Williams PC. Optimization of mathematical treatments of raw near-infrared signal in the measurement of protein in hard red spring wheat. I. Influence of particle size. Cereal Chem. 1984;61(2):158–165. [Google Scholar]
- 21.Qiao CF, He ZD, Han QB, et al. The use of lobetyolin and HPLC-UV fingerprints for quality assessment of Radix Codonopsis. J Food Drug Anal. 2007;15(3):258–264. [Google Scholar]
- 22.Rinnan A, van den Berg F, Engelsen SB. Review of the most common pre-processing techniques for near-infrared spectra. TrAC Trends Anal Chem. 2009;28(10):1201–1222. doi: 10.1016/j.trac.2009.07.007. [DOI] [Google Scholar]
- 23.Savitzky A, Golay MJE. Smoothing and differentiation of data by simplified least squares procedure. Anal Chem. 1964;36(8):1627–1639. doi: 10.1021/ac60214a047. [DOI] [Google Scholar]
- 24.Shi JY, Zou XB, Zhao JW, et al. Determination of total flavonoids content in fresh Ginkgo biloba leaf with different colors using near infrared spectroscopy. Spectrochim Acta Part A. 2012;94:271–276. doi: 10.1016/j.saa.2012.03.078. [DOI] [PubMed] [Google Scholar]
- 25.Valderrama P, Braga JWB, Poppi RJ. Variable selection, outlier detection, and figures of merit estimation in a partial least-squares regression multivariate calibration model. A case study for the determination of quality parameters in the alcohol industry by near-infrared spectroscopy. J Agric Food Chem. 2007;55(21):8331–8338. doi: 10.1021/jf071538s. [DOI] [PubMed] [Google Scholar]
- 26.Wang F, Jiang W, Li C, et al. Application of near infrared spectroscopy in monitoring the moisture content in freeze-drying process of human coagulation factor VIII. J Innov Optheal Sci. 2015;8(6):1550034. doi: 10.1142/S1793545815500340. [DOI] [Google Scholar]
- 27.Wang P, Yu Z. Species authentication and geographical origin discrimination of herbal medicines by near infrared spectroscopy: a review. J Pharm Anal. 2015;5(5):277–284. doi: 10.1016/j.jpha.2015.04.001. [DOI] [PMC free article] [PubMed] [Google Scholar]
- 28.Wang P, Zhang H, Yang H, et al. Rapid determination of major bioactive isoflavonoid compounds during the extraction process of kudzu (Pueraria lobata) by near-infrared transmission spectroscopy. Spectrochim Acta Part A. 2015;137(137C):1403–1408. doi: 10.1016/j.saa.2014.09.002. [DOI] [PubMed] [Google Scholar]
- 29.Workman J, Weyer L. Practical Guide to Interpretive Near-Infrared Spectroscopy. CRC Press, New York; 2008. p. 56. [Google Scholar]
- 30.Wu YJ, Jin Y, Ding HY, et al. In-line monitoring of extraction process of scutellarein from Erigeron breviscapus (vant.) Hand-Mazz based on qualitative and quantitative uses of near-infrared spectroscopy. Spectrochim Acta Part A. 2011;79(5):934–939. doi: 10.1016/j.saa.2011.03.056. [DOI] [PubMed] [Google Scholar]
- 31.Xu ZL, Huang WH, Gong XC, et al. Design space approach to optimize first ethanol precipitation process of Dangshen. Chin J Chin Mater Med. 2015;40(22):4411–4416. (Available from: http://dx.doi.10.4268/cjcmm20152217) [PubMed] [Google Scholar]
- 32.Zhao GP, Dai S, Chen RS. Dictionary of Chinese Traditional Medicine. Shanghai Scientific and Technical Publishers, Shanghai; 2006. pp. 2578–2579. (in Chinese) [Google Scholar]
Associated Data
This section collects any data citations, data availability statements, or supplementary materials included in this article.
Supplementary Materials
Scree plot: results of different latent variables for regression models


