Abstract
This article reports a multidisciplinary approach to produce fluorescently labeled organically modified silica nanoparticles as a nonviral vector for gene delivery and biophotonics methods to optically monitor intracellular trafficking and gene transfection. Highly monodispersed, stable aqueous suspensions of organically modified silica nanoparticles, encapsulating fluorescent dyes and surface functionalized by cationic-amino groups, are produced by micellar nanochemistry. Gel-electrophoresis studies reveal that the particles efficiently complex with DNA and protect it from enzymatic digestion of DNase 1. The electrostatic binding of DNA onto the surface of the nanoparticles, due to positively charged amino groups, is also shown by intercalating an appropriate dye into the DNA and observing the Förster (fluorescence) resonance energy transfer between the dye (energy donor) intercalated in DNA on the surface of nanoparticles and a second dye (energy acceptor) inside the nanoparticles. Imaging by fluorescence confocal microscopy shows that cells efficiently take up the nanoparticles in vitro in the cytoplasm, and the nanoparticles deliver DNA to the nucleus. The use of plasmid encoding enhanced GFP allowed us to demonstrate the process of gene transfection in cultured cells. Our work shows that the nanomedicine approach, with nanoparticles acting as a drug-delivery platform combining multiple optical and other types of probes, provides a promising direction for targeted therapy with enhanced efficacy as well as for real-time monitoring of drug action.
Keywords: nonviral vector, ORMOSIL nanoparticles, confocal microscopy
Nanomedicine is an emerging new field created by fusion of nanotechnology and medicine. It uses a nanoparticle platform for diagnostic probes and effective targeted therapy (1). We recently showed the nanomedicine approach for photodynamic therapy, which produces a more effective dispersion of photodynamic-therapy photosensitizer (2). Biophotonics using optical probes provides numerous opportunities for light-guided and light-activated therapies (3). In an earlier work, we established the cellular mechanism of chemotherapy by using a chemotherapeutic agent containing groups that target a specific cancer (4, 5). In the present article, we demonstrate the application of a combination of nanomedicine with biophotonics for optically tracking the cellular pathways of gene delivery and resulting transfection by using nanoparticles as a nonviral vector.
Gene delivery is an area of considerable current interest; genetic materials (DNA, RNA, and oligonucleotides) have been used as molecular medicine and are delivered to specific cell types to either inhibit some undesirable gene expression or express therapeutic proteins (6, 7). Because of the risk factors (pathogenicity, immunogenicity, etc.) associated with viruses as gene carriers (viral vectors), a major emphasis has been placed on the development of synthetic nanoparticles bearing cationic groups as nonviral vectors (6, 8, 9). Recently, ultrafine silica nanoparticles, with surfaces functionalized by cationic-amino groups, have been shown to not only bind and protect plasmid DNA from enzymatic digestion but also transfect cultured cells and express encoded proteins (10–12). Organically modified silica (ORMOSIL) nanoparticles have the potential to overcome many limitations of their “unmodified” silica counterparts. The presence of both hydrophobic and hydrophilic groups on the precursor alkoxyorganosilane helps them to self-assemble both as normal micelles and reverse micelles under appropriate conditions. The resulting micellar (and reverse micellar) cores can be loaded with biomolecules such as drugs, proteins, etc. (13, 14). Such a system has a number of advantages. (i) They can be loaded with either hydrophilic or hydrophobic drugs/dyes; (ii) they can be precipitated in oil-in-water microemulsions in which corrosive solvents such as cyclohexane and complex purification steps such as solvent evaporation, ultracentrifugation, etc. can be avoided; (iii) their organic groups can be modified further for attachment of targeting molecules; and (iv) they can be possibly biodegraded through the biochemical decomposition of the Si—C bond (13). The presence of the organic group also imparts some degree of flexibility to the otherwise rigid silica matrix, which is expected to enhance the stability of such particles in aqueous systems against precipitation.
In the present work, we have synthesized hydrated ORMOSIL nanoparticles based on the triethoxyvinylsilane (VTES) precursor, both empty and loaded with fluorescent dyes, in the nonpolar core of dioctyl sodium sulfosuccinate (Aerosol-OT)/DMSO/water microemulsions. We have also synthesized hybrid amino-functionalized ORMOSIL nanoparticles by a synchronous hydrolysis of VTES and 3-aminopropyltriethoxysilane (APTES). By varying the concentrations of Aerosol-OT and VTES, monodispersed nanoparticles of various size ranges (between 10 and 100 nm), which are highly stable in aqueous systems against agglomeration, have been synthesized. The nanoparticles have been characterized by transmission electron microscopy and elemental analysis (x-ray photoelectron spectrometry).
The amino-functionalized nanoparticles were able to electrostatically condense DNA (both plasmid and genomic) and protect it from enzymatic degradation as shown by gel-electrophoresis study. The attachment of DNA with the nanoparticles is also shown by an experiment involving fluorescence resonance energy transfer (FRET), occurring between a dye (donor) intercalated into DNA adsorbed on the particle surface and another dye (acceptor) encapsulated in the nanoparticles. Using confocal microscopy, we found that these fluorescently labeled nanoparticles extensively stain the cytoplasm of tumor cells in culture. Using calf-thymus (CT) DNA, separately irreversibly labeled with ethidium monoazide (EMA) (15), we found that the nanoparticles release the genetic material inside the cytoplasm, which diffuses to the nucleus, a prerequisite for successful gene therapy (6). Last, we successfully transfected cultured cells by using the nanoparticles as vectors, as shown by the expression of EGFP in these cells.
Experimental Procedures
Materials. Surfactant [Aerosol OT (98%)], cosurfactants [1-butanol (99.8%) and VTES (97%)], and APTES (99%) were purchased from Aldrich. CT DNA is a product of Sigma. DMSO and the fluorescent dye, rhodamine 6G (Rh6G), were purchased from Fisher Chemicals (Fair Lawn, NJ). The drug 2-devinyl-2-(1-hexyloxyethyl)pyropheophorbide (HPPH) was kindly provided by the Roswell Park Cancer Institute (Buffalo, NY). DNA fluorescence labels, EMA and ethidium homodimer-1 (EthD-1), were purchased from Molecular Probes. Cell-culture products, unless otherwise mentioned, were purchased from GIBCO. All of the above chemicals were used without any additional purification.
Synthesis and Characterization of Drug-Loaded Silica-Based Nanoparticles. The nanoparticles, both empty and dye-loaded, were synthesized in the nonpolar core of Aerosol-OT/DMSO/water micelles as discussed in ref. 2. Typically, the micelles were prepared by dissolving a fixed amount of Aerosol-OT and 1-butanol in 20 ml of double-distilled water by vigorous magnetic stirring. A 100-μl sample of the dye in DMSO (10 mM) was dissolved by magnetic stirring in the resulting clear solution. For void nanoparticles, 100 μl of DMSO without the dye was added. After that, 200 μl of neat VTES was added to the micellar system, and the resulting solution was stirred for ≈30 min. Next, ORMOSIL nanoparticles were precipitated by adding aqueous ammonia solution or APTES and stirring for ≈20 h at room temperature. After the formation of the nanoparticles, surfactant Aerosol-OT and cosurfactant 1-butanol were removed by dialyzing the solution against water in a 12- to 14-kDa cutoff cellulose membrane (Spectrum Laboratories, Houston) for 50 h. The dialyzed solution then was filtered through a 0.2-μm cutoff membrane filter (Nalge) and used straightway for additional experimentation. The composition of different particle systems is given in Table 1.
Table 1. Composition and size of various ORMOSIL nanoparticles.
| Name | Aerosol-OT, g | nBuOH, μl | Water, ml | DMSO,* μl | VTES, μl | NH3, μl | APTES, μl | Diameter, nm |
|---|---|---|---|---|---|---|---|---|
| 3ORM2N20 | 0.33 | 600 | 20 | 100 | 200 | 20 | — | 10–15 |
| 3ORM2A20 | 0.33 | 600 | 20 | 100 | 200 | — | 20 | 10–15 |
| 4ORM2N20 or ORMN20 | 0.44 | 800 | 20 | 100 | 200 | 20 | — | 15–20 |
| 4ORM2A20 or ORMA20 | 0.44 | 800 | 20 | 100 | 200 | — | 20 | 15–20 |
| 4ORM2A40 or ORMA40 | 0.44 | 800 | 20 | 100 | 200 | — | 40 | 15–20 |
| 4ORM3N20 | 0.44 | 800 | 20 | 100 | 300 | 20 | — | 25–30 |
| 4ORM5N20 | 0.44 | 800 | 20 | 100 | 500 | 20 | — | 40–45 |
| 6ORM2N20 | 0.66 | 1200 | 20 | 100 | 200 | 20 | — | 40–45 |
| 6ORM3N20 | 0.66 | 1200 | 20 | 100 | 300 | 20 | — | 65–75 |
| 8ORM2N20 | 0.88 | 1600 | 20 | 100 | 200 | 20 | — | 80–85 |
Either pure or with dissolved dye
Transmission electron microscopy was used to determine the morphology and the size of the aqueous dispersion of nanoparticles with a JEOL JEM 2020 electron microscope operating at an accelerating voltage of 200 kV. UV-visible absorption spectra were recorded by using a Shimadzu UV-3101 PC spectrophotometer in a quartz cuvette with a 1-cm path length. Fluorescence spectra were taken on a Fluorolog-3 spectrof luorometer (Jobin Yvon, Longjumeau, France).
Elemental Analysis (X-Ray Photoelectron Spectrometry). For elemental analysis of solid samples, the nanoparticles in aqueous dispersion (after dialysis) were centrifuged and dried in an oven (1 h at 80°C). The dried samples were crushed to fine powder and spread on a sample holder. A Physical Electronics 5300 x-ray photoelectron spectrometer (Perkin–Elmer) was used for the elemental analysis of the sample.
Determination of Entrapment Efficiency and Release Kinetics of Rh6G and HPPH from ORMOSIL Nanoparticles. To quantify the encapsulation of amphiphilic and hydrophobic dyes, we performed a study of entrapment efficiency and release kinetics of an amphiphilic dye (Rh6G) and a hydrophobic dye (HPPH) from ORMOSIL nanoparticles. In a typical experiment, an aliquot of 500 μl of ORMN20 solution encapsulating Rh6G or HPPH was filtered through microcentrifuge filter device membranes (100-kDa cutoff) to separate the free dye from the nanoparticles. The amount of dye present in the filtrate was determined spectrophotometrically at the wavelength of absorption peak. The entrapment efficiency and release kinetics were determined by using the values for the total concentration of a dye in the system and in the filtrate, as described in ref. 16.
Agarose Gel Electrophoresis. We examined the complex formation of plasmid DNA with nanoparticles by agarose gel electrophoresis. Sterile water (250 μl) and aqueous dispersions of ORMN20, ORMA20, and ORMA40 were gently mixed with 4 μl of plasmid encoding EGFP (pEGFP) (0.5 μg/μl) at room temperature and incubated overnight at 4°C for the formation of the DNA–nanoparticle complex. Next, 50 μl each of the above-described solutions were withdrawn in duplicates in sterile microcentrifuge tubes. One of the sets was mixed with 1 μl of DNase 1 (5 mg/ml) and incubated at 37°C for 30 min. Next, all the solutions were run on 1% agarose at 100 volts for 1.5 h, subsequently stained with ethidium bromide, and documented by using a UVP Bioimaging System. An LM-20E Ultraviolet Benchtop Transilluminator (UVP, Upland, CA) was used in conjunction with an Olympus (Melville, NY) Digital Camedia C-4000 Zoom color camera with a UV filter and lens. Documentation was completed by using the doc-it system software.
FRET Experiment. To confirm the DNA attachment to the surface of the amino-functionalized ORMOSIL nanoparticles, we used the optical technique of FRET (17). Samples for the FRET experiment were prepared as described here. First, a stock solution of CT DNA (1 mg/ml in 0.05 M Tris·HCl, pH 7.5) was prepared and then diluted to a concentration corresponding to an OD260 of3[≈0.24 mM (bp) CT DNA]. Next, 48 μl of EthD-1 stock solution (2 mM in 1:4 DMSO/H2O) was added to 3.95 ml of this DNA solution (final dye concentration, 24 μM). The dye–DNA solution was mixed gently and incubated in dark for 10 min. Amino-functionalized nanoparticles (ORMA40; diameter, 15–20 nm), blank and doped with HPPH, were synthesized as described above. The ORMA40–HPPH suspension (4.0 ml) was dialyzed and used for complexing with DNA. Three solutions were prepared: (i) 2 ml of ORMA40–HPPH suspension plus 2 ml of buffer solution; (ii) 2 ml of DNA–EthD-1 solution plus 2 ml of blank ORMA40 particle suspension; and (iii) 2 ml of DNA–EthD-1 solution plus 2 ml of ORMA40–HPPH suspension. The absorption and fluorescence spectra of these solutions were recorded after incubating them for 2 h at 4°C. The final concentrations of the dye and DNA in the second and third solutions were equivalent [12 μM dye, 120 μM (bp) CT DNA].
The fluorescence lifetime changes during FRET were monitored by using the time-correlated single-photon counting technique (18). For this purpose, a Becker & Hickl (Berlin) photon-counting module (SPC-830), equipped with a fast photomultiplier tube (Hamamatsu H7422, Hamamatsu Photonics, Hamamatsu City, Japan) with a system response of ≈300 ps at full width at half maximum, was used. Recently, this photon-counting module was used extensively for fluorescence lifetime imaging microscopy (FLIM) (19–21). A Ti:sapphire laser (Tsunami, Spectra-Physics), tuned to a center wavelength of 740 nm (≈100-fs pulses at 82 MHz), was doubled by using a beta barium borate up-conversion crystal to obtain 370-nm light, which was used to excite the sample solution in a cuvette. A band-pass filter, 580/40, was used to cut off the acceptor emission to monitor the donor lifetime changes during FRET. A PHD-400-X high-speed photodiode module was used to provide a synchronization signal from the Ti:sapphire laser.
EMA Labeling of DNA and Complexing of EMA-Labeled DNA with Nanoparticles. To optically track the delivery of DNA into cells, with ORMOSIL nanoparticles, we covalently labeled CT DNA with the fluorescent dye, EMA. CT DNA stock solution (2 ml of a 1 mg/ml 0.05 M Tris·HCl buffer, pH 8.0) was incubated for 30 min with 18 ml of aqueous solution of EMA (0.1 mg/ml) in dark. The resulting complex was then exposed to UV light by using a handheld UV torch for 2 h. The resulting solution was precipitated by the addition of ethanol, and the precipitate was collected by centrifugation. The light-red-colored pellet was rinsed and dissolved in 500 μlofsterile water. The resulting DNA–EMA solution was mixed with 2 ml of aqueous dispersion of ORMA40 and incubated overnight at 4°C.
In Vitro Studies: Nanoparticle Uptake and Imaging. COS-1 and KB cells (American Type Culture Collection) were maintained in DMEM with 10% FBS according to the manufacturer's instructions. For nanoparticle uptake and imaging studies, the cells were trypsinized, resuspended in the medium at a concentration of 7.5 × 10³ cells per ml, and replated into 60-mm culture plates (5.0 ml in each). Cells then were placed overnight in an incubator at 37°C with 5% CO2 (VWR Scientific, model 2400). The next day, the cells (≈50% confluency) were rinsed with PBS, and 5 ml of the fresh medium was replaced on the plates. Then, 50 μl of an aqueous dispersion of nanoparticles (dye-doped or with adsorbed DNA–EMA complex) was added to appropriate plates and mixed gently. The treated cells were returned to the incubator (37°C, 5% CO2) for 1 h. After incubation, the plates were rinsed with sterile PBS, and 5.0 ml of fresh medium was added to each. The cells were incubated (37°C, 5% CO2) for 10 min (if the nanoparticles attached to the DNA–EMA complex, the cells were incubated further for 2 h). Cells were then directly imaged by using a confocal laser scanning system (MRC-1024; Bio-Rad) attached to an upright microscope (Eclipse E800; Nikon). A Fluor water-immersion objective lens (Nikon; ×60 objective, 1.0 numerical aperture) was used for cell imaging. A solid-state diode-pumped laser (Verdi, Coherent Radiation, Palo Alto, CA) was used as a source of excitation (532 nm). A long-pass (585 LP) filter was applied as an emission filter for imaging. Localized spectrofluorometry was used to confirm that the observed fluorescence is from the dye used (4). A comparison of the fluorescence spectra of the cells (in vitro) and the fluorescence spectra of the dye (in situ) allows us to confirm the origin of fluorescence as seen in the fluorescence image channel.
Transfection of Cultured Cells. To confirm the prospect of using the ORMOSIL nanoparticles as nonviral vectors for gene therapy, we performed transfection of cultured cells. The pEGFP-N2 vector (BD Biosciences Clontech) was used for transfection in COS-1 cells (American Type Culture Collection) with the amino-functionalized ORMOSIL nanoparticles. First, 20 μl of pEGFP-N2 stock solution (0.3 μg/μl) was mixed with 0.25 ml of OPTI-MEM medium in one microcentrifuge tube. Second, 50 μl of the ORMA40 nanoparticles aqueous suspension was added to 0.25 ml of OPTI-MEM medium in another microcentrifuge tube. Then, the contents were mixed together gently and incubated at room temperature for 30 min. Last, the 570 μl of resulting DNA–ORMOSIL complex suspension was added to a 60-mm culture plate of COS-1 cells containing 5 ml of the medium and incubated for 24 h (37°C, 5% CO2). After incubation, the transfected cells were rinsed with PBS, fresh medium was added, and cells were imaged immediately.
Results and Discussion
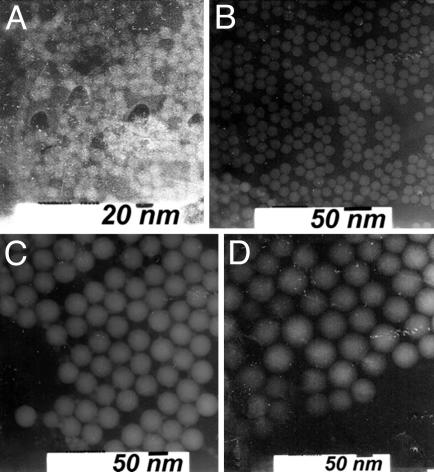
Structural and Compositional Analysis of Nanoparticles. Fig. 1 shows transmission electron microscopy images of ORMOSIL nanoparticles of different composition (see Table 1). Note that the particles are spherical in shape and highly monodispersed.
Fig. 1.
Transmission electron microscopy images of highly monodispersed ORMOSIL nanoparticles. (A) 3ORM2N20. (B) 4ORM2N20. (C) 4ORM5N20. (D) 8ORM2N20.
The relative percentages of different elements present in the nanoparticle samples ORMN20, ORMA20, and ORMA40, as determined by x-ray photoelectron spectrometry, are represented in Table 2. Although the relative percentages of carbon (1S), oxygen (1S), and silicon (1S) are similar in all of the three samples, there is no nitrogen (1S) in ORMN20, and it increases from ORMA20 (1.4%) to ORMA40 (2.0%). These data demonstrate that there are amino groups present in the ORMA samples, increasing from ORMA20 to ORMA40.
Table 2. Relative percentages of different elements present in the ORMN20, ORMA20, and ORMA40.
| Name | C (1S) | O (1S) | Si (1S) | N (1S) |
|---|---|---|---|---|
| ORMN20 | 58.5 ± 2.4 | 30.1 ± 1.2 | 9.7 ± 1.9 | 0 |
| ORMA20 | 54.8 ± 2.4 | 30.7 ± 1.4 | 11.8 ± 1.3 | 1.4 ± 0.3 |
| ORMA40 | 59.4 ± 0.8 | 28.4 ± 0.8 | 8.3 ± 0.4 | 2.0 ± 0.3 |
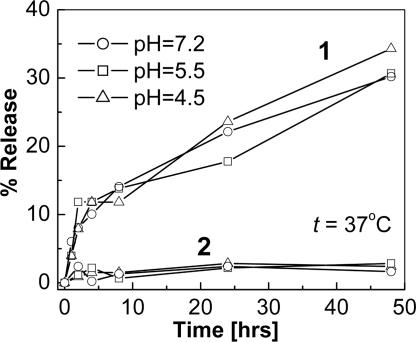
Entrapment Efficiency and Release Kinetics of the Encapsulated Dyes. Silica-based nanoparticles are not known to release encapsulated biomolecules and dyes because of their rigid matrix. However, ORMOSILs, which have a mesoporous structure by virtue of the presence of organic moieties, have been reported to at least partially release encapsulated dyes (13, 22). We investigated the release kinetics of two types of ORMOSIL-encapsulated dyes having similar molecular weights, an amphiphilic dye (Rh6G) and a hydrophobic dye (HPPH), in an aqueous buffer system at 37°C as shown in Fig. 2. There is a marked difference between the release behavior of the amphiphilic and the hydrophobic dyes. The amphiphilic dye shows a controlled release behavior (23), with an initial burst (≈10% release in the first 3 h), followed by a slow release (≈30% release in 48 h). In contrast, there is essentially no release of the hydrophobic dye (≈3% release in 48 h) for different pH values. These data suggest that by encapsulating a fluorescent hydrophobic dye, we can maintain the dye fluorescence properties of the nanoparticles over a long period. Thus, encapsulation of hydrophobic dyes in ORMOSIL nanoparticles can be used for optical tracking of nanoparticles delivery, whereas that of amphiphilic drugs/dyes can be exploited for controlled release. We also found that the entrapment efficiency of the ORMN20 nanoparticles entrapping both Rh6G and HPPH is ≈85–90%.
Fig. 2.
Release kinetics of amphiphilic dye (Rh6G; curves 1) and hydrophobic dye (HPPH; curves 2) from ORMN20 nanoparticles. PBS suspension at 37°C.
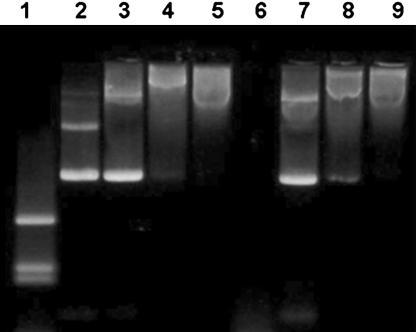
Examination of the Complex Formation of Plasmid DNA with Nanoparticles. Fig. 3 represents the results of agarose gel electrophoresis of plasmid DNA, free and complexed with different ORMOSIL nanoparticles (ORMN20, ORMA20, and ORMA40). It can be seen that with increasing amounts of amino groups (positive charge) on the nanoparticles, the mobility of the complexed DNA toward the positive terminal is retarded (lanes 3–5). This result suggests that the plasmid is no more able to move freely, because the resulting nanoparticle–DNA complex has restricted the mobility in the gel. After treatment with DNase 1, the free plasmid is completely digested (Fig. 3, lane 6), whereas the plasmids bound to the amino-functionalized nanoparticles are completely protected against the same (Fig. 3, lanes 8 and 9). The reason for this protection against enzymatic digestion is not yet fully understood. It was suggested recently that this behavior can be due to (i) repulsion of Mg2+ ions (which are necessary for the enzymatic reaction) by the amino groups, (ii) a hindered access of the enzymes to the DNA that is immobilized on the nanoparticle surface, or (iii) both (12). Note that the plasmid treated with the non-amino-terminated particle (ORMN20) is also partially protected (Fig. 3, lane 7), because it has bands corresponding to both its nonenzymatically treated counterpart (Fig. 3, lane 3) and also some DNA fragments appearing at the bottom of the band. Therefore, these nanoparticles can also be considered as some kind of inhibitors toward the enzymatic action of DNase 1 on plasmid DNA. Alternatively, it is also possible that the interaction between the genetic material and the nanoparticle may not be entirely of electrostatic nature.
Fig. 3.
Image of agarose gel electrophoresis of plasmid DNA, free and complexed with ORMOSIL nanoparticles. Lane 1, λ-DNA HindIII digest; lane 2, pEGFP; lane 3, ORMN20 + pEGFP; lane 4, ORMA20 + pEGFP; lane 5, ORMA40 + pEGFP; lane 6, pEGFP + DNase 1; lane 7, ORMN20 + pEGFP + DNase 1; lane 8, ORMA20 + pEGFP + DNase 1; lane 9, ORMA40 + pEGFP + DNase 1.
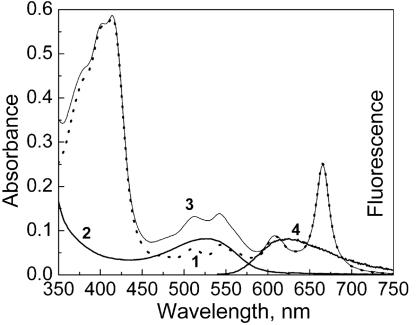
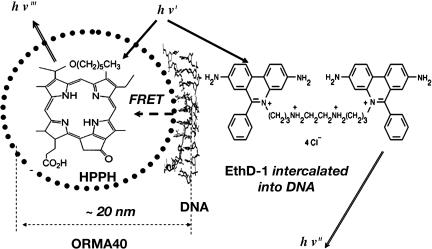
FRET Manifestation in DNA Binding to Nanoparticles. To gain further insights into the ORMOSIL–DNA complex formation, we designed an experiment involving FRET. FRET occurs between two fluorescent dyes with complementary spectral properties (the emission band of the donor dye must overlap with the absorption band of the acceptor dye), within close proximity (<10 nm) (17). FRET, therefore, provides a way for studying the interactions between two fluorescently labeled biomolecules over nanoscopic spatial separation (24). In our FRET experiments, we used a DNA-binding dye, EthD-1, as the donor and the HPPH dye (encapsulated in ORMOSIL nanoparticles) as the acceptor. As described in Experimental Procedures, we stained CT DNA with EthD-1, a nucleic acid staining dye with extremely high binding efficiency to the double-stranded DNA (25, 26). The fluorescence spectrum of EthD-1 bound with DNA overlaps significantly with an absorption band of the HPPH dye (Fig. 4). As shown above, hydrophobic HPPH exhibits practically no release from the nanoparticles and remains encapsulated. The resulting nanoparticle–DNA complex should have two dyes in close proximity for FRET, as shown in Fig. 5. Therefore, the spectral manifestation of FRET (EthD-1 → HPPH) under the excitation of EthD-1 can occur when the DNA molecules are attached to the nanoparticle surface (the two dyes are within the required nanoscopic distance from each other for FRET to occur).
Fig. 4.
Absorption (traces 1–3) and fluorescence (curve 4) spectra of ORMA40–HPPH particles (curve 1), DNA–EthD-1 complexed with blank ORMA40 (curves 2 and 4), and ORMA40–HPPH particles complexed with DNA–EthD-1. 25 mM Tris·HCl buffer (pH 7.5) was used. Concentration of DNA, CDNA = 0.12 mM (bp); concentration of EthD-1, CEthD-1 = 12 μM.
Fig. 5.
Schematic representation of FRET occurring as a result of the attachment of DNA labeled with donor fluorophore, EthD-1, to the surface of an ORMOSIL nanoparticle containing the encapsulated acceptor fluorophore HPPH.
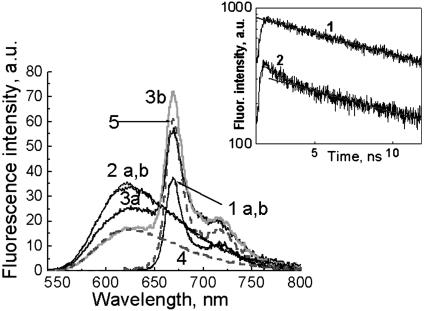
Fig. 6 shows the individual emission spectra of the HPPH encapsulated nanoparticles (ORMA40–HPPH), EthD-1–DNA, and EthD-1–DNA complexed with the (ORMA40–HPPH) nanoparticles. We have compared the absorption and emission spectra of EthD-1–DNA complexed with the ORMA40–HPPH with that of EthD-1–DNA complexed with the blank ORMA40 nanoparticles and that of uncomplexed ORMA40–HPPH. All other conditions (pH and temperature) remained the same.
Fig. 6.
Spectral manifestation of FRET between EthD-1, staining DNA that is attached to the surface of nanoparticles, and HPPH, encapsulated inside ORMOSIL nanoparticles. Steady-state fluorescence spectra: ORMA40–HPPH nanoparticles (1 a,b), EthD-1 bound with CT DNA and complexed with blank ORMA 40 (2 a,b), and the DNA–EthD-1 complexed with ORMOSIL–HPPH nanoparticles (3a and 3b). Spectra were taken 30 min after sample preparation (set a) and 3 h later (set b). Because of significant overlapping of EthD-1 and HPPH emission spectra, they were deconvoluted in 3b. Curves 4 and 5 present the deconvoluted DNA–EthD-1 and HPPH fluorescence spectra. (Inset) EthD-1 fluorescence decays of DNA–EthD-1 complexed with blank ORMA 40 (2b) and DNA–EthD-1 complexed with ORMOSIL–HPPH nanoparticles (3b). Linear fitting in logarithmic scale was applied to show a monoexponential decay for 2b and a biexponential decay in the case of 3b.
The HPPH–nanoparticles sample exhibits the characteristic fluorescence of HPPH with peak at 665 nm, whereas the EthD-1–DNA fluorescence spectrum has a maximum at ≈620 nm. When the sample of ORMA40–HPPH nanoparticles, complexed with EthD-1–DNA, is excited, two bands corresponding to EthD-1 and HPPH can be distinguished (Fig. 6, curves 1–3). The occurrence of FRET in samples of the ORMA40–HPPH nanoparticles complexed with EthD-1–DNA is manifested as a decrease in the emission intensity from EthD-1, with a concomitant increase in the emission intensity from HPPH. Moreover, as it is shown in Fig. 6 (curves 3a and 3b), incubation of the sample for 3 h (in dark at 4°C) causes further decrease in donor fluorescence intensity, with a simultaneous increase in the intensity of acceptor fluorescence, indicating an increased complexation of DNA to the particles. At the same time, fluorescence remains practically the same in the case of uncomplexed ORMA40–HPPH (Fig. 6, 1 a,b) and in the case of DNA–EthD-1 complexed with blank particles (Fig. 6, 2 a,b). Because of a significant overlap between the emission spectra of EthD-1 and that of HPPH, the overlapped spectrum was deconvoluted to obtain their individual spectral components (Fig. 6, curves 4 and 5) for estimating the FRET efficiency. The FRET efficiency E can be estimated (27) by using the equation E = 1 - (Fda/Fd), where Fda is the donor fluorescence intensity in the presence of the acceptor and Fd is the intensity of the donor fluorescence in the absence of the acceptor. By using the fluorescence spectra of the donor, in the absence (Fig. 6, curve 2) and presence of the acceptor (extracted from the overlapped spectrum; Fig. 6, curve 4), one can estimate a value of E to be 0.5.
To confirm occurrence of FRET, we also used lifetime measurements. It was found that the fluorescence of EthD-1–DNA complexed with the blank ORMA40 nanoparticles has a monoexponential decay (Fig. 6 Inset and curve 2b). In contrast, fluorescence of EthD-1–DNA complexed with the ORMA40–HPPH nanoparticles appears to display a biexponential decay, with one of the components similar to the fluorescence decay of EthD-1–DNA complexed with blank ORMA40 and another component that has shorter decay. The appearance of the shorter fluorescence decay component in the case of EthD-1–DNA complexed with ORMA40–HPPH nanoparticles indicates a decrease in the fluorescence lifetime of the donor, further supporting the occurrence of FRET (Fig. 6 Inset and 3b). It is important to stress that we have confirmed that there is no contribution from the acceptor emission (acceptor bleed-through) to the obtained fluorescence decay by looking at the emission of uncomplexed ORMA40–HPPH under the same experimental conditions.
The release of DNA is essential in order for gene delivery to be effective. We suggest that the increased acidic conditions inside living cells would result in the destabilization of the ORMOSIL–DNA complex, leading to the release of DNA. This release process can also be monitored by using the FRET technique, because a decrease in the FRET signal caused by the increased separation between the donor (DNA–EthD-1) and the acceptor (HPPH). Thus, FRET may also be used to monitor the release of DNA from a nonviral vector inside live cells without any deterioration.
Cellular Uptake of Nanoparticles, DNA Delivery into the Nucleus, and pEGFP Expression. In a previous study we reported that hydrophobic dye-doped ORMOSIL nanoparticles are actively taken up by tumor cells in vitro, as seen by fluorescence staining of the cytoplasm (2). This cytoplasmic staining is observed for several types of tumor cells that we have investigated, an example of which is shown for KB cells in Fig. 7 Inset. Although the mechanism of this cellular uptake is not yet fully understood, the net negative charge on the nanoparticles has been thought to play a crucial role. A similar observation was found in a recent study that has demonstrated high nonspecific uptake of anionic magnetic nanoparticles by cells in vitro (28).
Fig. 7.
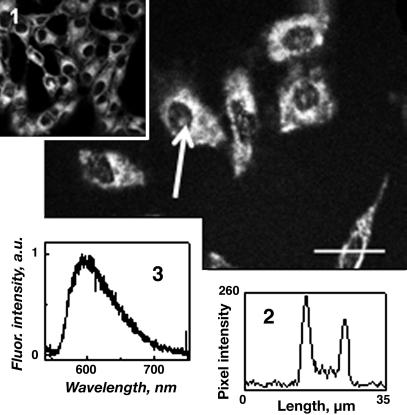
Confocal fluorescence image of KB cells treated with ORMA40 particles previously incubated with DNA labeled with EMA. The arrow indicates the area (nucleus) in which the fluorescence spectrum was taken; fluorescence intensity distribution was measured along the selected line. (Inset) Confocal fluorescence image of KB cells treated with HPPH encapsulated in ORMN20 particles. (Lower Right) Distribution of DNA-EMA fluorescence intensity along the selected line. (Lower Left) Fluorescence spectrum from the cell nucleus.
In gene delivery, the genetic material, as soon as it is released inside the cytoplasm of a cell, should migrate to the nucleus (6). Again, optical imaging can play a significant role in studying this nuclear migration of DNA. In our experiment, we irreversibly labeled CT DNA with the fluorescent dye EMA and complexed with unlabeled ORMA40 nanoparticles as described in Experimental Procedure. The postrelease nuclear trafficking of DNA is demonstrated in the confocal image of KB cells in Fig. 7. After comparison of this image with the image of KB cells stained with HPPH encapsulated nanoparticles (Fig. 7 Inset), it can be seen that in addition to the cytoplasmic staining, there is considerable staining inside the nucleus (Fig. 7). Fluorescence intensity distribution along the line selected across a cell is shown in Fig. 7 Lower Right. Localized fluorescence spectroscopy confirms that this emission originates from EMA (Fig. 7 Lower Left). In contrast, the HPPH-containing nanoparticles are not able to penetrate into the cell nucleus (Fig. 7 Inset). Thus, we believe that this nuclear staining is a result of migration of the released labeled DNA inside the nucleus. A recent report involving study of the mobility of DNA molecules (of various sizes) inside cells has concluded that free DNA molecules of ≥600 bp move very slowly in the cytoplasm, and a small portion of them can reach the intranuclear space (29). This nuclear accumulation of foreign DNA can be increased by tagging with nucleus-targeting peptides (30).
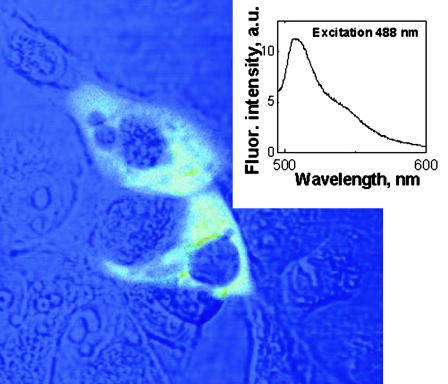
Last, to confirm that the delivered DNA is functional, the expression of GFP was checked by transfection of cultured cells. We observed that pEGFP was transfected successfully by using the ORMA40 nanoparticles as the delivery vector (Fig. 8). The observed green cellular fluorescence is from the expressed EGFP, which has been confirmed by localized spectroscopy (Fig. 8 Inset).
Fig. 8.
COS-1 cells transfected with pEGFP delivered with ORMOSIL nanoparticles. A combined transmission and fluorescence image is shown. (Inset) Fluorescence spectra of EGFP taken from cell cytoplasm.
Conclusions
The present investigation shows that the nanomedicine approach using ORMOSIL nanoparticles provides a promising direction for nonviral gene delivery. We also established optical tracking and monitoring as useful tools for studying drug delivery and drug–cell interactions. In the present context, the use of FRET, together with fluorescence imaging, established DNA delivery to the cell nucleus, whereas the use of pEGFP provided evidence for the functionality of delivered DNA. Preliminary studies have also yielded successful in vivo transfection of neuronal cells in the brain of mice, with a plasmid expressing GFP, by using the ORMOSIL nanoparticles as DNA vectors (unpublished data).
Acknowledgments
We thank Drs. Earl J. Bergey and Purnendu Dutta for useful discussions, Dr. Richard Nowak for analyzing the x-ray photoelectron spectrometer data, and Lisa A. Vathy for excellent technical support. This study was supported by the Directorate of Chemistry and Life Sciences of the Air Force Office of Scientific Research through Defense University Research Initiative on Nanotechnology Grant F496200110358.
Author contributions: I.R., T.Y.O., D.J.B., H.E.P., and P.N.P. designed research; I.R., T.Y.O., D.J.B., H.E.P., R.A.M., and N.K. performed research; I.R., T.Y.O., D.J.B., H.E.P., N.K., and P.N.P. analyzed data; and I.R., T.Y.O., D.J.B., H.E.P., and P.N.P. wrote the paper.
Abbreviations: ORMOSIL, organically modified silica; VTES, triethoxyvinylsilane; APTES, 3-aminopropyltriethoxysilane; Aerosol-OT, dioctyl sodium sulfosuccinate; FRET, fluorescence resonance energy transfer; Rh6G, rhodamine 6G; HPPH, 2-devinyl-2-(1-hexyloxyethyl)pyropheophorbide; CT, calf thymus; EMA, ethidium monoazide bromide; EthD-1, ethidium homodimer-1; pEGFP, plasmid encoding EGFP.
References
- 1.Prasad, P. N. (2004) Nanophotonics (Wiley, New York).
- 2.Roy, I., Ohulchanskyy, T. Y., Pudavar, H. E., Bergey, J. E., Oseroff, A. R., Morgan, J., Dougherty, T. J. & Prasad, P. N. (2003) J. Am. Chem. Soc. 125, 7860-7865. [DOI] [PubMed] [Google Scholar]
- 3.Prasad, P. N. (2003) Introduction to Biophotonics (Wiley, New York).
- 4.Wang, X., Pudavar, H. E., Kapoor, R., Krebs, L. J., Bergey, E. J., Liebow, C., Prasad, P. N., Nagy, A. & Schally, A. V. (2001) J. Biomed. Opt. 6, 319-325. [DOI] [PubMed] [Google Scholar]
- 5.Krebs, L. J., Wang, X., Pudavar, H. E., Bergey, E. J., Schally, A. V., Nagy, A., Prasad, P. N. & Liebow, C. (2000) Cancer Res. 60, 4194-4199. [PubMed] [Google Scholar]
- 6.Davis, S. S. (1997) Trends Biotechnol. 15, 217-224. [DOI] [PubMed] [Google Scholar]
- 7.Anderson, W. F. (1998) Nature 392, 25-30. [DOI] [PubMed] [Google Scholar]
- 8.Roy, I., Mitra, S., Maitra, A. N. & Mozumdar, S. (2003) Int. J. Pharm. 250, 25-33. [DOI] [PubMed] [Google Scholar]
- 9.McAllister, K., Sazani, P., Adam, M., Cho, M. J., Rubinstein, M., Samulski, R. J. & DeSimone, J. M. (2002) J. Am. Chem. Soc. 124, 15198-15207. [DOI] [PubMed] [Google Scholar]
- 10.Kneuer, C., Sameti, M., Haltner, E. G., Schiestel, T., Schirra, H., Schmidt, H. & Lehr, C M. (2000) Int. J. Pharm. 196, 257-261. [DOI] [PubMed] [Google Scholar]
- 11.Kneuer, C., Sameti, M., Bakowsky, U., Schiestel, T., Schirra, H., Schmidt, H. & Lehr, C M. (2000) Bioconjugate Chem. 11, 926-932. [DOI] [PubMed] [Google Scholar]
- 12.He, X. X., Wang, K., Tan, W., Liu, B., Lin, X., He, C., Li, D., Huang, S. & Li, J. (2003) J. Am. Chem. Soc. 125, 7168-7169. [DOI] [PubMed] [Google Scholar]
- 13.Das, S., Jain, T. K. & Maitra, A. N. (2002) J. Colloid Interface Sci. 252, 82-88. [DOI] [PubMed] [Google Scholar]
- 14.Jain, T. K., Roy, I., De, T. K. & Maitra, A. N. (1998) J. Am. Chem. Soc. 120, 11092-11095. [Google Scholar]
- 15.Bolton, P. H & Kearns, D. R. (1978) Nucleic Acids Res. 5, 4891-4903. [DOI] [PMC free article] [PubMed] [Google Scholar]
- 16.Bharali, D. J., Sahoo, S. K., Mozumdar, S. & Maitra, A. N. (2003) J. Colloid Interface Sci. 258415-258423. [DOI] [PubMed]
- 17.Stryer, L. (1978) Annu. Rev. Biochem. 47, 819-846. [DOI] [PubMed] [Google Scholar]
- 18.O'Connor, D. V. & Phillips, D. (1984) Time Correlated Single Photon Counting (Academic, London).
- 19.König, K. & Riemann, I. (2003) J. Biomed. Opt. 8, 432-439. [DOI] [PubMed] [Google Scholar]
- 20.Bacskai, J. B, Skoch, J., Hickey, G. A., Allen, R. & Hyman, B. T. (2003) J. Biomed. Opt. 8, 368-375. [DOI] [PubMed] [Google Scholar]
- 21.Chen, Y. & Periasamy, A. (2004) Microsc. Res. Tech. 63, 72-80. [DOI] [PubMed] [Google Scholar]
- 22.Ferrer, M. L., del Monte, F. & Levy, D. (2001) J. Phys. Chem. 105, 11076-11080. [Google Scholar]
- 23.Uhrich, K. E., Cannizzaro, S. M., Langer, R. S. & Shakesheff, K. V. (1999) Chem. Rev. (Washington, D.C.) 99, 3181-3198. [DOI] [PubMed] [Google Scholar]
- 24.Periasamy, A., ed. (2001) Methods in Cellular Imaging (Oxford Univ. Press, New York).
- 25.Haughland, R. P. (2002) Molecular Probes: Handbook of Fluorescent Probes and Research Chemicals (Molecular Probes, Eugene, OR).
- 26.Glazer, A. N., Peck, K. & Mathies, R. A. (1990) Proc. Natl. Acad. Sci. USA 87, 3851-3855. [DOI] [PMC free article] [PubMed] [Google Scholar]
- 27.Lakowicz, J. R. (1999) Principles of Fluorescence Spectroscopy (Plenum, New York), 2nd Ed.
- 28.Wilhem, C., Billotey, C., Roger, J., Pons, J. N., Bacri, J. C. & Gazeau, F. (2003) Biomaterials 24, 1001-1011. [DOI] [PubMed] [Google Scholar]
- 29.Lukacs, J. L., Haggie, P., Seksek, O., Lechardeur, D., Freedman, N. & Verkman, A. S. (2000) J. Biol. Chem. 275, 1625-1629. [DOI] [PubMed] [Google Scholar]
- 30.Zanta, M. A., Belguise-Valladier, P. & Behr, J. P. (1999) Proc. Natl. Acad. Sci. USA 96, 91-96. [DOI] [PMC free article] [PubMed] [Google Scholar]


