

Abstract
Background
25-hydroxyvitamin D [25(OH)D] deficiency is associated with increased cardiovascular disease risk, perhaps mediated through dyslipidemia. Deficient 25(OH)D is cross-sectionally associated with dyslipidemia, but little is known about longitudinal lipid changes. Our objective was to determine the association of 25(OH)D deficiency with longitudinal lipid changes and risk of incident dyslipidemia.
Research Methods
This is a longitudinal community-based study of 13,039 ARIC participants who had 25(OH)D and lipids measured at baseline (1990–1992) and lipids re-measured in 1993–1994 and 1996–1998. Mixed-effect models were used to assess associations of 25(OH)D with lipid trends after adjusting for clinical characteristics and for baseline or incident use of lipid-lowering therapy. Risk of incident dyslipidemia was determined for those without baseline dyslipidemia.
Results
Baseline mean±SD age was 57±6 years and 25(OH)D was 24±9 ng/ml. Participants were 57% women, 24% black. Over a mean follow-up of 5.2 years, the fully-adjusted average differences (95% CI) comparing deficient (<20 ng/ml) to optimal (≥30 ng/ml) 25(OH)D were: total cholesterol (TC) −2.40 mg/dl (−4.21, −0.60), HDL-cholesterol -3.02 mg/dl (−3.73, −2.32) and TC/HDL-C ratio 0.18 (0.11, 0.26). Those with deficient 25(OH)D compared to optimal had modestly increased risk of incident dyslipidemia in demographic-adjusted models [RR 1.19 (1.02–1.39)], which was attenuated in fully-adjusted models [1.12 (0.95–1.32)].
Conclusions
Deficient 25(OH)D was prospectively associated with lower TC and HDL-C and greater TC/HDL-C ratio after considering factors such as diabetes and adiposity. Further work including randomized controlled trials is needed to better assess how 25(OH)D may impact lipids and cardiovascular risk.
Keywords: Vitamin D, lipids, total cholesterol, HDL-cholesterol, Total cholesterol/HDL-C ratio Clinical Trial Registration: N/A
Graphical abstract
INTRODUCTION
Atherosclerotic cardiovascular disease (ASCVD) is the leading cause of death in the United States and worldwide.[1] Elevated serum levels of low-density lipoprotein cholesterol (LDL-C) and triglycerides (TG) and low levels of high-density lipoprotein cholesterol (HDL-C) are established risk factors for ASCVD.[2] Low levels of vitamin D, as assessed by serum 25-hydroxyvitamin D [25(OH)D],[3] have been independently associated with ASCVD risk,[4] but whether vitamin D supplementation can decrease ASCVD risk has not been definitely established and remains a topic of ongoing investigation.[5]
One mechanism by which vitamin D may influence ASCVD risk is through an effect on lipids. Low 25(OH)D concentrations have been independently associated with dyslipidemia, characterized by elevated LDL-C and TG and lower HDL-C. However, most of the evidence supporting this association was obtained in cross-sectional analyses.[6–9] Causality in these cross-sectional studies cannot be inferred, and additional evidence is needed to better assess how vitamin D status may impact lipid levels over time. One prior observational study[6] evaluated the association of 25(OH)D levels with change in lipids; this study found that patients who had 25(OH)D levels that increased from <20 ng/ml to ≥30 ng/ml over time also had an increase in mean total cholesterol (TC) and HDL-C levels, but no significant change in LDL-C and TG. However, the data from that study were extracted from a clinical diagnostic laboratory dataset without information on important clinical characteristics that may have influenced 25(OH)D levels or changes in lipids, such as medication use, body mass index (BMI), physical activity, and other ASCVD risk factors.[6]
Therefore, we analyzed the association between vitamin D status and the lipid profile, both cross-sectionally and prospectively using data from the Atherosclerosis Risk in Communities (ARIC) study.[10] ARIC collected data on numerous demographic, lifestyle, and clinical variables spanning multiple clinic visits, allowing for extensive adjustment of possible confounders over time, unlike prior investigations. We hypothesized that serum 25(OH)D deficiency would be independently associated with dyslipidemia both in cross-sectional and in longitudinal analyses, over 5-years of follow-up.
METHODS
Study population
The ARIC study, a prospective population-based cohort, recruited 15,792 predominantly white and black adults aged 45–65 years between 1987 and 1989 from 4 U.S. communities (Minneapolis, Minnesota; Washington County, Maryland; Forsyth County, North Carolina; and Jackson, Mississippi).[10] Subjects participated in five main visits: 1987–1989 (visit 1), 1990–1992 (visit 2), 1993–1995 (visit 3), 1996–1998 (visit 4), and 2011–2013 (visit 5). All variables used in this analysis were collected at visits 2, 3, and 4. Data from visit 5 were not used for this study due to the large time interval (>10 years) between visit 4 and visit 5.
25(OH)D was measured in serum samples collected from the full ARIC cohort only at visit 2 and was not available for the large majority of participants at other visits; therefore visit 2 was used as the baseline for this analysis. Of the 14,348 participants who attended visit 2, we excluded patients who did not identify as either white or black (n=49), blacks from the Minnesota and Maryland centers (n=50) as the number of these individuals was too small to allow for adequate adjustment by race/center, and participants missing 25(OH)D data (n=1191) or lipid data (n=26) from visit 2. Our final sample included 13,039 participants at visit 2 (Supplemental Figure 1). In follow-up, 11,506 and 10,397 participants had repeat lipid measurements at visit 3 and visit 4, respectively.
The Institutional Review Boards at all participating institutions approved study protocols, and all participants provided written informed consent at each study visit.
Vitamin D measurement
Serum samples were collected at visit 2 (1990–1992) and stored at −70°C until 2012–2013, when 25(OH)D2 and 25(OH)D3 were measured using liquid chromatography-tandem high-sensitivity mass spectrometry (Waters Alliance e2795, Milford, Massachusetts) at the Molecular Epidemiology and Biomarker Research Laboratory and Advanced Research and Diagnostic Laboratory, University of Minnesota. Using samples collected in duplicate tubes and stored, the coefficient of variation (processing plus assay variation) for 25(OH)D2 was 20.8% and for 25(OH)D3 was 6.9%. The Pearson correlations from these blind duplicate samples were 0.98 for 25(OH)D2 and 0.97 for 25(OH)D3. The intraclass correlation coefficients at visit 2 from the blind duplicate samples, calculated by the function icc in the R package irr, were as follows: 0.96 (95% confidence interval [CI] 0.95–0.96) for 25(OH)D2 and 0.91 (0.86–0.92) for 25(OH)D3. 25(OH)D2 and 25(OH)D3 were added together for total 25(OH)D concentration. To convert 25(OH)D levels to nmol/L from ng/ml, multiply by 2.496.
Levels of 25(OH)D vary by season.[11] We therefore adjusted 25(OH)D for seasonal variation by using a linear regression model to compute the residuals with 25(OH)D as the dependent variable and month of blood draw as the independent variable.[12] By definition, these residuals do not correlate with month of blood draw. The grand mean was then added to the 25(OH)D residuals calculated from this model. Given that seasonal variation in 25(OH)D also varies by race, we performed this adjustment separately for white and black participants. This calculated variable “25(OH)D adjusted for month of blood draw” is an estimate of average annual 25(OH)D levels and was used as the exposure variable in all analyses.
Serum concentrations of 25(OH)D were classified as deficient (<20), intermediate (20–29), or optimal (≥30 ng/ml), based on prior studies and classifications from The Endocrine Society.[13]
Lipid assessment
Fasting blood for lipids was collected at visits 2, 3, and 4 and measured according to standard procedures.[10] Plasma TC and TG were determined by enzymatic methods, and HDL-C was measured after dextran-magnesium precipitation. The Friedewald equation was used to calculate LDL-C in those with TG levels under 400 mg/dL.[14] Taking into account the older age and prevalence of other cardiovascular risk factors in our cohort, dyslipidemia was defined using previously established criteria as the use of lipid-lowering therapy or LDL-C ≥130 mg/dl, HDL-C <40 (men) or <50 (women) mg/dl, and/or TG ≥150 mg/dl.[15]
Other covariates
Baseline covariates used in this analysis were measured at visit 2 except for education and physical activity, which were assessed at visit 1. Medication use, demographic, and behavioral variables were obtained through standard questionnaires and interviews administered by trained staff. We examined demographic and lifestyle factors potentially associated with both 25(OH)D levels and lipid levels including: age, sex, race/center (Minneapolis, MN whites; Washington County, MD whites; Forsyth County, NC whites; Forsyth County, NC blacks; Jackson, MS blacks), education (<high school; high school or vocational school; college, graduate or professional school), physical activity (score range 1 to 5, using a modified Baecke Physical Activity questionnaire[16]), cigarette smoking (current; former; never), current alcohol intake (yes, no), waist circumference ([WC]; continuous), BMI (< 25; 25–<30; ≥30 in kg/m2). We also examined factors associated with ASCVD including: diabetes (defined as a self-reported physician diagnosis, medication use, fasting serum glucose ≥126 mg/dl, or nonfasting glucose ≥200 mg/dl), hypertension (defined as medication use, systolic blood pressure (BP) ≥140 mmHg, or diastolic BP ≥90 mmHg), and estimated GFR (eGFR) using the CKD Epidemiology Collaboration (CKD-EPI) equation[17] (categorized as <30; 30–<60; 60–<90; and ≥90 mL/min/1.72m2).
For our prospective analysis, the time-varying covariates were age, smoking, alcohol consumption, BMI, WC, diabetes, hypertension, and lipid-lowering medication use. The time-fixed covariates were sex, race/center, education, physical activity, and eGFR.
Statistical analyses
Our primary analysis compared lipid levels in 25(OH)D deficient participants (<20 ng/mL) to those with optimal 25(OH)D (≥30 ng/mL) concentrations. In secondary analyses, serum 25(OH)D levels were used as a continuous exposure variable. We also modeled 25(OH)D level as a continuous variable using restricted cubic splines (with knots at the 5th, 35th, 65th and 95th percentiles of their sample distributions) to provide a flexible dose-response relationship between 25(OH)D and change in lipid concentrations. The primary outcome variables of interest were TC, LDL-C, HDL-C, TG, non-HDL-C, and TC/HDL-C as continuous variables. Dyslipidemia was used as a secondary outcome.
For cross-sectional analysis using visit 2 data, we used multivariable-adjusted linear regression to estimate average differences (with 95% CIs) in lipid levels comparing participants with deficient vs. optimal 25(OH)D levels. In addition, we calculated the odds ratios (OR) for dyslipidemia comparing 25(OH)D deficient individuals vs. optimal using multivariable-adjusted logistic regression.
For prospective analyses, we used random-intercept linear mixed models for longitudinal data to estimate the average differences (with 95% CIs) in lipid parameters across three time points (visits 2, 3, and 4) comparing participants with deficient vs. optimal 25(OH)D levels. In addition, risk of incident dyslipidemia at visits 3 or 4 was determined by using multivariable-adjusted flexible parametric proportional hazards models to account for interval censoring among those without dyslipidemia at baseline.[18]
For both cross-sectional and prospective analyses, we used three models with progressive adjustment for covariates. Model 1 was adjusted for age, sex, and race/center. Model 2 additionally adjusted for lifestyle factors including education, physical activity, cigarette smoking, current alcohol intake, BMI and WC. Model 3 additionally adjusted for ASCVD risk factors including diabetes, hypertension, eGFR categories, and use of lipid-lowering therapy.
To account for the impact of lipid lowering therapy on change in lipid levels, our primary analyses adjusted for use of lipid-lowering therapy at visit 2, 3, and 4 as a time-varying covariate in the fully-adjusted Model 3. In sensitivity analyses, we additionally performed two alternate approaches. First, we added a constant to the lipid levels at visits 2, 3, or 4 of participants taking lipid-lowering medications at each respective visit to represent what their lipid levels might have been if they were not taking medications. The constant used was dependent on the specific type of medication(s) used as recommended by Wu et al (Supplemental Methods).[19, 20] As a second sensitivity analysis, we excluded participants on lipid-lowering therapies at visit 2 in cross-sectional analysis and participants on lipid-lowering therapies at any visit in prospective analysis.
Wald tests were used to test for interactions of 25(OH)D with race and sex by including cross-product terms in Model 2. Two sided p-values ≤0.05 were considered statistically significant. All statistical analyses were conducted by Stata version 12 (StataCorp, College Station, TX).
RESULTS
We studied 13,039 ARIC participants with a mean age of 56.9 years at visit 2, 56.6% were women, 75.8% were white, and 24.2% were black (Table I). At visit 2, the mean(SD) levels were as follows: 25(OH)D: 24.3(8.6) ng/ml, TC: 210.0(39.5) mg/dl, HDL-C: 49.7(16.8) mg/dl, LDL-C: 133.5(36.8) mg/dl, TG: 135.0(87.0) mg/dl, and non-HDL-C: 160.2(42.0) mg/dl. The prevalence of dyslipidemia at visit 2 was 74.2%, and 6.4% were on lipid lowering medication.
Table I.
Basic Characteristics of Study Participants by 25(OH)D Status at Visit 2*
| Overall | Optimal (≥30 ng/ml) | Sufficient (20–<30 ng/ml) | Deficient (<20 ng/ml) | P-value† | |
|---|---|---|---|---|---|
| N | 13039 | 3053 | 5759 | 4227 | |
| Biomarkers | |||||
| 25(OH)D (ng/ml) | 24.3 ± 8.6 | 35.8 ± 5.9 | 24.8 ± 2.8 | 15.3 ± 3.5 | |
| Total Cholesterol (mg/dl) | 210.0 ± 39.5 | 209.2 ± 38.0 | 210.3 ± 38.6 | 210.3 ± 41.6 | 0.403 |
| HDL-C (mg/dl) | 49.7 ± 16.8 | 51.2 ± 17.9 | 48.7 ± 16.1 | 50.1 ± 16.8 | <0.001 |
| LDL-C (mg/dl) | 133.5 ± 36.8 | 131.3 ± 35.9 | 134.4 ± 36.1 | 134.0 ± 38.4 | <0.001 |
| TG (mg/dl) | 135.0 ± 87.0 | 133.6 ± 77.6 | 137.8 ± 87.5 | 132.3 ± 92.3 | 0.004 |
| non-HDL-C (mg/dl) | 160.2 ± 42.0 | 157.9 ± 41.0 | 161.5 ± 40.9 | 160.2 ± 44.0 | <0.001 |
| Total cholesterol (TC)/HDL-C | 4.7 ± 1.9 | 4.6 ± 2.0 | 4.8 ± 1.8 | 4.7 ± 1.9 | <0.001 |
| Dyslipidemia, N (%) | 9,654 (74.2) | 2,189 (71.9) | 4,323 (75.2) | 3,142 (74.5) | 0.003 |
| Demographics | |||||
| Age (years) | 56.9 ± 5.7 | 57.4 ± 5.7 | 57.1 ± 5.7 | 56.4 ± 5.7 | <0.001 |
| Male, N (%) | 5,663 (43.4) | 1,562 (51.2) | 2,763 (48.0) | 1,338 (31.7) | <0.001 |
| Race/center, N (%) | <0.001 | ||||
| Minneapolis, MN Whites | 3,527 (27.0) | 982 (32.2) | 1,719 (29.8) | 826 (19.5) | |
| Washington County, MD Whites | 3,377 (25.9) | 905 (29.6) | 1,622 (28.2) | 850 (20.1) | |
| Forsyth County, NC Whites | 2,976 (22.8) | 963 (31.5) | 1,400 (24.3) | 613 (14.5) | |
| Forsyth County, NC Blacks | 343 (2.6) | 18 (0.6) | 95 (1.6) | 230 (5.4) | |
| Jackson, MS Blacks | 2,816 (21.6) | 185 (6.1) | 923 (16.0) | 1,708 (40.4) | |
| Lifestyle Factors | |||||
| Body mass index (kg/m2) | 28.0 ± 5.4 | 26.3 ± 4.2 | 27.8 ± 5.0 | 29.4 ± 6.3 | <0.001 |
| Waist circumference (cm) | 97.9 ± 14.3 | 94.0 ± 12.5 | 98.0 ± 13.6 | 100.8 ± 15.9 | <0.001 |
| Education‡ | <0.001 | ||||
| <High School | 2,780 (21.4) | 563 (18.5) | 1,180 (20.5) | 1,037 (24.6) | |
| High School or Vocational School | 5,444 (41.8) | 1,358 (44.6) | 2,388 (41.5) | 1,698 (40.2) | |
| College, Graduate, or Professional School | 4,794 (36.8) | 1,125 (36.9) | 2,184 (38.0) | 1,485 (35.2) | |
| Smoking Status | <0.001 | ||||
| Never | 5,254 (40.4) | 1,105 (36.2) | 2,394 (41.6) | 1,755 (41.7) | |
| Former | 4,902 (37.7) | 1,351 (44.3) | 2,208 (38.4) | 1,343 (31.9) | |
| Current | 2,861 (22.0) | 597 (19.6) | 1,149 (20.0) | 1,115 (26.5) | |
| Current alcohol consumption | 10,052 (77.2) | 2,497 (81.8) | 4,518 (78.6) | 3,037 (72.1) | <0.001 |
| Physical activity index‡ | 2.4 ± 0.8 | 2.7 ± 0.8 | 2.5 ± 0.8 | 2.2 ± 0.7 | <0.001 |
| ASCVD Risk Factors | |||||
| Cholesterol lowering medication, N (%) | 830 (6.4) | 225 (7.4) | 381 (6.6) | 224 (5.3) | 0.001 |
| Diabetes | 1,911 (14.7) | 273 (9.0) | 785 (13.7) | 853 (20.3) | <0.001 |
| Hypertension | 4,641 (35.7) | 861 (28.2) | 1,950 (34.0) | 1,830 (43.5) | <0.001 |
| Estimated GFR, ml/min/1.73 m2 | <0.001 | ||||
| ≥90 | 9,449 (72.5) | 2,012 (65.9) | 4,161 (72.3) | 3,276 (77.5) | |
| 60–<90 | 3,316 (25.4) | 962 (31.5) | 1,497 (26.0) | 857 (20.3) | |
| <60 | 274 (2.1) | 79 (2.6) | 101 (1.8) | 94 (2.2) |
Data are means (SDs) or number (%). To convert 25(OH)D levels to nmol/L from ng/ml, multiply by 2.496.
P values derived from one-way ANOVA test for continuous variables and χ2 test using categorical variables
Education information and physical activity are from visit 1 (1987–1989)
Abbreviations: HDL-C, high-density lipoprotein cholesterol; LDL-C, low-density lipoprotein cholesterol; ASCVD, atherosclerotic glomerular filtration rate; GFR, glomerular filtration rate
Missing variables (n): 25(OH)D 0; age 0; sex 0; race 0; total cholesterol 1; HDL-C 40; LDL-C 225; TG 3; cholesterol-lowering medication 35; waist circumference 10; body mass index 21; education 21; physical activity 47; smoking 22; alcohol consumption 23; diabetes 35; hypertension 40; eGFR 0
In cross-sectional analyses using data from visit 2, the fully-adjusted average (95% CI) differences in lipid parameters showed lower HDL-C [−2.94 mg/dl (−3.69, −2.19)] and higher TC/HDL-C ratio [0.23 (0.14, 0.32)] for participants with deficient (<20 ng/ml) compared to optimal (≥30 ng/ml) 25(OH)D concentrations (Table II). Lower 25(OH)D was associated with lower TC in analyses using 25(OH)D as a continuous variable (−1.04 mg/dl (−1.91, −0.16) per 10 ng/ml lower 25(OH)D) but was not statistically significant in analyses using 25(OH)D as a categorical variable with deficient and optimal groups. There were no statistically significant associations for TG or non-HDL in fully-adjusted models. Sensitivity analyses evaluating the impact of lipid lowering medication use on study results were generally consistent with the primary analysis (Supplemental Tables I and II), although in analyses excluding patients on lipid-lowering therapies at any clinic visit, participants with 25(OH)D deficiency had significantly lower HDL-C and significantly higher LDL-C, non-HDL-C, and TC/HDL-C in all models (Supplemental Table II).
Table II.
Cross-sectional Analysis of 25(OH)D Status with Lipids at ARIC visit 2 (1990–1992)
| Model 1* | Model 2† | Model 3‡ | |
|---|---|---|---|
| Total cholesterol, mg/dl | |||
| N | 13038 | 12929 | 12842 |
| Continuous [per 10 ng/ml lower 25(OH)D] | −0.68 (−1.53, 0.17) | −1.09 (−1.96, −0.22) | −1.04 (−1.91, −0.16) |
| Optimal (≥30 ng/ml) | Reference | Reference | Reference |
| Deficient (<20 ng/ml) | −0.49 (−2.44, 1.46) | −1.38 (−3.38, 0.63) | −1.37 (−3.38, 0.64) |
| LDL-C, mg/dl | |||
| N | 12814 | 12707 | 12621 |
| Continuous [per 10 ng/ml lower 25(OH)D] | 0.89 (0.09, 1.70) | 0.26 (−0.56, 1.09) | 0.42 (−0.41, 1.25) |
| Optimal (≥30 ng/ml) | Reference | Reference | Reference |
| Deficient (<20 ng/ml) | 2.64 (0.79, 4.49) | 1.22 (−0.67, 3.12) | 1.48 (−0.42, 3.38) |
| HDL-C, mg/dl | |||
| N | 12999 | 12891 | 12804 |
| Continuous [per 10 ng/ml lower 25(OH)D] | −2.51 (−2.85, −2.18) | −1.38 (−1.71, −1.06) | −1.39 (−1.72, −1.07) |
| Optimal (≥30 ng/ml) | Reference | Reference | Reference |
| Deficient (<20 ng/ml) | −5.48 (−6.25, −4.72) | −2.94 (−3.69, −2.19) | −2.94 (−3.69, −2.19) |
| TG, mg/dl | |||
| N | 13036 | 12927 | 12840 |
| Continuous [per 10 ng/ml lower 25(OH)D] | 5.33 (3.46, 7.20) | 0.67 (−1.21, 2.56) | 0.13 (−1.72, 1.99) |
| Optimal (≥30 ng/ml) | Reference | Reference | Reference |
| Deficient (<20 ng/ml) | 12.75 (8.45, 17.04) | 2.51 (−1.81, 6.84) | 1.09 (−3.17, 5.35) |
| Non-HDL-C, mg/dl | |||
| N | 12998 | 12890 | 12803 |
| Continuous [per 10 ng/ml lower 25(OH)D] | 1.87 (0.96, 2.77) | 0.32 (−0.60, 1.25) | 0.39 (−0.54, 1.31) |
| Optimal (≥30 ng/ml) | Reference | Reference | Reference |
| Deficient (<20 ng/ml) | 5.05 (2.96, 7.13) | 1.61 (−0.51, 3.73) | 1.62 (−0.50, 3.73) |
| TC/HDL-C | |||
| N | 12998 | 12890 | 12803 |
| Continuous [per 10 ng/ml lower 25(OH)D] | 0.21 (0.17, 0.25) | 0.10 (0.06, 0.14) | 0.10 (0.06, 0.14) |
| Optimal (≥30 ng/ml) | Reference | Reference | Reference |
| Deficient (<20 ng/ml) | 0.47 (0.38, 0.56) | 0.23 (0.14, 0.32) | 0.23 (0.14, 0.32) |
Model 1 adjusted for age, sex and race/center
Model 2 additionally adjusted for lifestyle factors (education, BMI, WC, physical activity, smoking, current alcohol)
Model 3 additionally adjusted for other CVD risk factors (hypertension, diabetes, eGFR) and for use of lipid lowering therapy
Abbreviations: LDL-C, low-density lipoprotein cholesterol; HDL-C, high-density lipoprotein cholesterol; TG, triglycerides; BMI, body mass index; WC, waist circumference; CVD, cardiovascular disease; eGFR, estimated glomerular filtration rate
We also evaluated the association of vitamin D status with the prevalence of dyslipidemia in cross-sectional analysis (Table III). The odds ratios (OR) for dyslipidemia comparing participants with 25(OH)D deficiency to optimal levels was 1.43 (1.27–1.60) in Model 1 and attenuated to 1.07 (0.95–1.21) in fully-adjusted models.
Table III.
Cross-Sectional Association of 25(OH)D Status and Dyslipidemia at ARIC visit 2 (1990–1992).
| Model 1* Adjusted Odds Ratios (95% CI) |
Model 2† Adjusted Odds Ratios (95% CI) |
Model 3‡ Adjusted Odds Ratios (95% CI) |
|
|---|---|---|---|
| N | 13007 | 12898 | 12839 |
| Optimal (≥30 ng/ml) | Reference | Reference | Reference |
| Deficient (<20 ng/ml) | 1.43 (1.27, 1.60) | 1.08 (0.95, 1.22) | 1.07 (0.95, 1.21) |
Model 1 adjusted for age, sex, and race/center.
Model 2 additionally adjusted for lifestyle factors (education, BMI, WC, physical activity, smoking, current alcohol)
Model 3 additionally adjusted for other CVD risk factors (hypertension, diabetes, eGFR)
Abbreviations: LDL-C, low-density lipoprotein cholesterol; HDL-C, high-density lipoprotein cholesterol; TG, triglycerides; BMI, body mass index; WC, waist circumference; CVD, cardiovascular disease; eGFR, estimated glomerular filtration rate
In prospective analyses using data from visits 2, 3, and 4 (mean 5.2 years follow-up), the fully-adjusted average differences (95% CI) in lipid parameters showed lower TC [−2.40 mg/dl (−4.21, −0.60)], lower HDL-C [−3.02 mg/dl (−3.73, −2.32)] and higher TC/HDL-C ratio [0.18 (0.11, 0.26)] for those with 25(OH)D deficiency compared to those with optimal levels (Table IV). In sensitivity analysis, significant associations were consistent in prospective analyses using a constant to account for lipid-lowering therapies (Supplemental Table III). Findings were also similar in analyses excluding participants on lipid-lowering therapies at any ARIC visit, though in this group 25(OH)D deficiency was also associated with significantly higher LDL-C (Supplemental Table IV).
Table IV.
Prospective Analysis of 25(OH)D Status at Visit 2 with Lipid Changes from ARIC visits 2 (1990–1992) through ARIC visit 3 (1993–1995) and ARIC visit 4 (1996–1998). Results presented as beta-coefficients and 95% confidence intervals.
| Model 1* | Model 2† | Model 3‡ | |
|---|---|---|---|
| Total cholesterol, mg/dl | |||
| N participants/n visits | 13039/34941 | 12930/34680 | 12843/34462 |
| Continuous [per 10 ng/ml decrease in 25(OH)D] | −1.25 (−1.99, −0.51) | −1.44 (−2.20, −0.68) | −1.39 (−2.18, −0.61) |
| Optimal (≥30 ng/ml) | Reference | Reference | Reference |
| Deficient (<20 ng/ml) | −2.08 (−3.77, −0.38) | −2.54 (−4.28, −0.79) | −2.40 (−4.21, −0.60) |
| LDL-C, mg/dl | |||
| N | 12971/34365 | 12863/34110 | 12777/33895 |
| Continuous [per 10 ng/ml decrease in 25(OH)D] | 0.42 (−0.28, 1.12) | 0.11 (−0.60, 0.83) | 0.28 (−0.45, 1.02) |
| Optimal (≥30 ng/ml) | Reference | Reference | Reference |
| Deficient (<20 ng/ml) | 1.33 (−0.27, 2.93) | 0.59 (−1.05, 2.23) | 0.99 (−0.70, 2.68) |
| HDL-C, mg/dl | |||
| N | 13036/34902 | 12927/34642 | 12840/34424 |
| Continuous [per 10 ng/ml decrease in 25(OH)D] | −2.40 (−2.71, −2.08) | −1.36 (−1.67, −1.05) | −1.38 (−1.68, −1.07) |
| Optimal (≥30 ng/ml) | Reference | Reference | Reference |
| Deficient (<20 ng/ml) | −5.31 (−6.04, −4.58) | −2.99 (−3.69, −2.28) | −3.02 (−3.73, −2.32) |
| TG, mg/dl | |||
| N | 13039/34939 | 12930/34678 | 12843/34460 |
| Continuous [per 10 ng/ml decrease in 25(OH)D] | 4.11 (2.40, 5.82) | −0.79 (−2.51, 0.93) | −1.40 (−3.09, 0.28) |
| Optimal (≥30 ng/ml) | Reference | Reference | Reference |
| Deficient (<20 ng/ml) | 10.70 (6.77, 14.62) | −0.18 (−4.12, 3.76) | −1.70 (−5.57, 2.16) |
| Non-HDL-C, mg/dl | |||
| N | 10954/29040 | 10881/28764 | 10865/28565 |
| Continuous [per 10 ng/ml decrease in 25(OH)D] | 1.15 (0.35, 1.94) | −0.11 (−0.91, 0.70) | −0.04 (−0.88, 0.79) |
| Optimal (≥30 ng/ml) | Reference | Reference | Reference |
| Deficient (<20 ng/ml) | 3.24 (1.42, 5.06) | 0.38 (−1.47, 2.23) | 0.55 (−1.36, 2.46) |
| TC/HDL-C | |||
| N | 10954/29040 | 10881/28764 | 10865/28565 |
| Continuous [per 10 ng/ml decrease in 25(OH)D] | 0.16 (0.13, 0.20) | 0.07 (0.04, 0.11) | 0.08 (0.04, 0.11) |
| Optimal (≥30 ng/ml) | Reference | Reference | Reference |
| Deficient (<20 ng/ml) | 0.38 (0.31, 0.46) | 0.18 (0.10, 0.25) | 0.18 (0.11, 0.26) |
Model 1 adjusted for age, sex, race/center, and time since visit 2
Model 2 additionally adjusted for lifestyle factors (education, BMI, WC, physical activity, smoking, current alcohol)
Model 3 additionally adjusted for other CVD risk factors (hypertension, diabetes, eGFR) and for use of lipid lowering therapy
Abbreviations: LDL-C, low-density lipoprotein cholesterol; HDL-C, high-density lipoprotein cholesterol; TG, triglycerides; BMI, body mass index; WC, waist circumference; CVD, cardiovascular disease; eGFR, estimated glomerular filtration rate
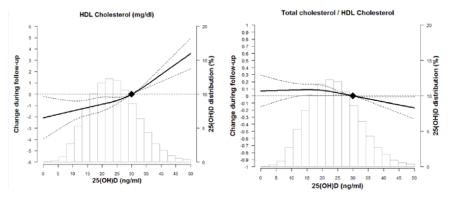
Figure 1 shows the fully-adjusted cubic spline models for the association of 25(OH)D at visit 2 with lipid parameters from visit 2 through visit 4. In general, there was a positive linear association of higher 25(OH)D with TC and HDL-C and inverse relationship with TC/HDL-C ratio.
Figure 1. The Association of 25(OH)D at ARIC Visit 2 with Trajectory of Lipids over Time through ARIC Visit 4 Using Adjusted* Restricted Cubic Spline Models (95% confidence intervals).

The solid line represents the change and the dashed lines represents the 95% confidence intervals. Knots at 5th, 35th, 65th, and 95th percentiles. Spline centered at 30 ng/ml. Histogram shows the distribution of 25(OH)D.
*Model is adjusted for age, sex, race/center, time since visit 2, education, BMI, WC, physical activity, smoking, current alcohol, hypertension, diabetes, eGFR and lipid lowering therapy.
In prospective analyses of participants without dyslipidemia at baseline (Table V), 25(OH)D deficiency was modestly associated with increased risk of incident dyslipidemia in demographic-adjusted analyses [RR 1.19 (1.02–1.39)] but attenuated in fully-adjusted analyses [1.12 (0.95–1.32)].
Table V.
Prospective Association of 25(OH)D Status and Incident Dyslipidemia from ARIC visits 2 (1990–1992) through ARIC visit 3 (1993–1995) and ARIC visit 4 (1996–1998).
| N event/N total | Model 1* Adjusted Relative Risk Ratios (95% CI) |
Model 2† Adjusted Relative Risk Ratios (95% CI) |
Model 3‡ Adjusted Relative Risk Ratios (95% CI) |
|
|---|---|---|---|---|
| Optimal (≥30 ng/ml) | 353/807 | Reference | Reference | Reference |
| Deficient (<20 ng/ml) | 409/941 | 1.19 (1.02, 1.39) | 1.12 (0.96, 1.32) | 1.12 (0.95, 1.32) |
Model 1 adjusted for age, sex, race/center, and time since visit 2
Model 2 additionally adjusted for lifestyle factors (education, BMI, WC, physical activity, smoking, current alcohol)
Model 3 additionally adjusted for other CVD risk factors (hypertension, diabetes, eGFR)
Abbreviations: LDL-C, low-density lipoprotein cholesterol; HDL-C, high-density lipoprotein cholesterol; TG, triglycerides; BMI, body mass index; WC, waist circumference; CVD, cardiovascular disease; eGFR, estimated glomerular filtration rate
There was no meaningful interaction of 25(OH)D with each lipid parameter by race; however some interactions were found by sex (Supplemental Table V). In fully-adjusted models, deficient 25(OH)D was associated with higher LDL-C, non-HDL-C, and TC/HDL-C ratio in women but with lower values in men (p-interactions<0.001). The association of deficient 25(OH)D with lower HDL-C was qualitatively stronger in women (p-interaction<0.001).
DISCUSSION
We found that 25(OH)D deficiency was prospectively associated with lower TC and HDL-C along with higher TC/HDL-C ratio over a median 5-year follow-up after adjusting for demographics, lifestyle measures, cardiovascular risk factors, and lipid-lowering medication use, although average differences were relatively small. There was no prospective association between lower 25(OH)D and TG, LDL-C, or with incident dyslipidemia after multivariable adjustment, though lower 25(OH)D was associated with higher LDL-C when excluding participants on lipid-lowering therapies. This study is one of the first studies to show the relationship between 25(OH)D levels and lipid measures over time.
It is important to note that findings in our study were consistent with prior studies that have also shown that deficient 25(OH)D is cross-sectionally associated with lower HDL-C and higher TC.[6–9] However, these prior investigations[6–9, 21] have also found that individuals with low 25(OH)D D (defined as either <20 ng/mL[6, 9] or lowest quartile[7]) have higher LDL-C and TG than individuals with higher 25(OH)D levels after multivariable adjustment. In contrast, our work showed a cross-sectional association between 25(OH)D deficiency and higher LDL-C, non-HDL-C, and TG (and a prospective association with non-HDL-C and TG) only after adjustment for age and sex which did not persist after adjusting for other clinical variables.
Though it is unclear why 25(OH)D was significantly associated with HDL-C, TC, and TC/HDL-C ratio but not with LDL-C, non-HDL-C or TG, these findings have several important implications for our current knowledge of 25(OH)D and dyslipidemia. First, our results may be explained by vitamin D-dependent metabolic pathways which preferentially impact HDL-C more so than other types of lipids. For example, prior work has shown a stronger positive association between 25(OH)D and large HDL-C particles than with total HDL-C, suggesting a possible role for vitamin D in reverse cholesterol transport with increased formation of these larger, more cardioprotective HDL-C particles.[22] In addition, certain vitamin D genomic receptor binding sites are related to the APOA5 locus which is involved in lipid transport and metabolism. Notably, in 25(OH)D-deficient individuals certain polymorphisms at these sites were associated with low HDL-C, whereas no significant associations were seen with TG or LDL-C.[23] These findings were confirmed in a later study[24] and suggest that vitamin D may impact HDL-C levels directly via variable effects on gene expression. We also newly showed that deficient 25(OH)D was more strongly associated with an adverse lipid profile of higher LDL-C and lower HDL-C in women compared to men. We previously have found that lower 25(OH)D was associated with a more androgenic sex hormone pattern in women,[25] which may be another potential mechanism how vitamin D impacts HDL-C.
Secondly, an alternative explanation of our findings may be related to confounding factors affecting both 25(OH)D and lipid levels. For example, lower amounts of physical activity are associated with both lower 25(OH)D[12, 26] and lower HDL-C.[27] Although we adjusted for physical activity in our analyses, this may not have fully accounted for the interaction between activity, 25(OH)D, and HDL-C. Few studies have thoroughly examined the relationship between 25(OH)D and HDL-C and our study adds to the literature by showing that further work needs to be done to investigate the potentially clinically meaningful impact of this association.
In addition, given that lower 25(OH)D was associated with higher TG and LDL-C after adjusting for demographic variables but not after adjustment for other clinical variables, our results imply that the cross-sectional association between low 25(OH)D and elevated TG may also be explained by other factors such as obesity, as has been suggested previously.[28–30] Interestingly, we did find that lower 25(OH)D was associated with higher LDL-C when evaluating patients who were not on a lipid-lowering therapy. Given that statin-use is associated with increased serum 25(OH)D levels,[31, 32] the relationship between 25(OH)D and LDL-C may have been attenuated in our final cohort despite attempting to account for this with the inclusion of previously-studied constants to account for baseline and incident lipid-lowering medication use.
A third major point of our study is the prospective association observed between deficient 25(OH)D and lower HDL-C at a mean follow-up of 5.2 years. This adds significantly to prior analyses because although there have been numerous prior cross-sectional studies linking low 25(OH)D with dyslipidemia, there has been little data to date regarding prospective associations. We have also shown that 25(OH)D deficiency is associated with higher a TC/HDL-C ratio in prospective analyses, which is important because the TC/HDL-C ratio has been shown to be associated with greater cardiovascular risk than other lipid measures including LDL-C.[33, 34] Our results extend findings from one prior prospective study by Ponda et al[6] which showed that increases in 25(OH)D over time were associated with corresponding increases in HDL-C without any changes in TG or LDL-C. Unlike that prior study, we were able to adjust for numerous clinically significant variables such as race, BMI, diabetes, hypertension, kidney function, and use of lipid-lowering therapy.
Importantly, in the context of both this study and prior studies it remains uncertain why low 25(OH)D is repeatedly associated with dyslipidemia. One possible explanation may be that 25(OH)D deficiency results in increased parathyroid hormone levels which subsequently reduces lipolysis.[35] Vitamin D may also increase calcium levels and thereby reduce TG formation and secretion from the liver.[36, 37] Lipid metabolism may also be affected by vitamin D indirectly through effects on insulin secretion and insulin sensitivity.[38] Lastly, the association between 25(OH)D and dyslipidemia may be confounded by overall health status and metabolic risk factors such as obesity rather than causal mechanisms. BMI is known to be inversely associated with 25(OH)D.[28] Even so, we found that the association between 25(OH)D deficiency and lower HDL-C along with higher TC/HDL-C ratio persists longitudinally over time despite adjusting for numerous clinical variables including obesity.
Given that we consistently observed both cross-sectional and longitudinal associations between deficient 25(OH)D and certain measures of dyslipidemia, our findings suggest that the cardiovascular risk associated with low 25(OH)D may indeed be mediated through interactions with lipid pathways. Therefore, a final major implication of our study is the possibility of modifying cardiovascular risk through Vitamin D supplementation. Though our findings are observational only and did not examine any effects of treatment, Vitamin D supplementation remains an intriguing potential intervention for individuals with 25(OH)D deficiency and dyslipidemia at increased cardiovascular risk given its widespread availability and low cost,. Our results also complement recent findings from several small studies that suggest vitamin D supplementation may improve HDL-C levels in certain populations.[39–42] However, vitamin D supplementation has not yet been definitively shown to decrease the risk of cardiovascular events or improve the lipid profile,[43–46] but prior studies of vitamin D supplementation have been limited due to factors such as inadequate power, reliance on post hoc analyses, and low dose supplementation.[5] Results from further studies including large randomized clinical trials such as the ongoing VITAL study[47] are needed to definitively determine the benefit of 25(OH)D supplementation on cardiovascular outcomes.
Our study has several limitations. First, given the observational nature of this study, we are not able to discern whether the associations we observed between 25(OH)D and measured lipid variables are causal or explained by unmeasured variables. We did rigorously adjust for available demographic and lifestyle variables, including two measures of adiposity (BMI and WC), along with established cardiovascular risk factors and still found significant associations between 25(OH)D and several of our measured outcomes. Our data were limited as serum 25(OH)D measurements were only available at a single time point, visit 2, for the full cohort. We therefore were unable to determine how 25(OH)D varied over time and how any such variability may have impacted our findings. Another potential concern is vitamin D supplement use. While vitamin D supplement use directly influences 25(OH)D levels, it can also be a marker of health-seeking behavior and a potential confounder. Unfortunately, we were unable to adjust for the use of vitamin D supplements in our analyses because of limitations regarding ascertainment of this variable in the ARIC cohort.[12] Supplementation initiated after visit 2 may have weakened the associations between vitamin D deficiency and change in lipids over time. Lastly, lipid measurements were likely significantly affected by using of lipid-lowering therapies for which we did not have detailed data such as type of statin or medication dose. However, we addressed this rigorously using three methods: (1) by adjusting for use of lipid-lowering medications at baseline and at any respective follow-up visit in multivariable analyses, (2) using a previously studied method of adding constants to lipid values at all visits where medication use was reported,[19, 20] and (3) excluding participants on lipid-lowering therapies at any clinic visit. In all analyses our main results did not materially change.
The strengths of our study include the use of a diverse cohort of both white and black participants, the prospective nature of this study to improve upon the findings from cross-sectional analyses performed previously, and the inclusion of numerous variables accounting for demographic and lifestyle variables along with established cardiovascular risk factors.
CONCLUSIONS
In a U.S. population cohort, lower 25(OH)D was cross-sectionally and prospectively associated with lower HDL-C and higher TC/HDL-C ratio after adjusting for demographic, lifestyle, and cardiovascular risk factors, whereas other lipid measures were not significantly associated with 25(OH)D. This relationship between 25(OH)D and these lipid parameters may partially explain the association between 25(OH)D deficiency and ASCVD. Further evidence from clinical studies including randomized controlled trials is needed to better assess how 25(OH)D may impact lipids and thereby possibly influence cardiovascular risk.
Supplementary Material
Highlights.
We investigated the longitudinal association between Vit D deficiency and lipids.
Vit D deficiency was associated with lower HDL cholesterol over time.
Vit D deficiency was associated with higher Total Cholesterol/HDL ratio over time.
More data are needed to determine if Vit D supplementation improves lipid levels.
Acknowledgments
The authors thank the staff and participants of the ARIC study for their important contributions.
Funding:
This research was supported by grants from NIH/NINDS (R01NS072243 to Dr. Michos), the NIH/NHLBI (R01HL103706 to Dr. Lutsey), the NIH Office of Dietary Supplements (R01HL103706-S1 to Dr. Lutsey). The Atherosclerosis Risk in Communities Study is carried out as a collaborative study supported by National Heart, Lung, and Blood Institute contracts (HHSN268201100005C, HHSN268201100006C, HHSN268201100007C, HHSN268201100008C, HHSN268201100009C, HHSN268201100010C, HHSN268201100011C, and HHSN268201100012C). Dr. Michos is also supported by the Blumenthal Scholars Fund for Preventive Cardiology research.
ABBREVIATIONS
- 25(OH)D
25-hydroxyvitamin D
- ASCVD
Atherosclerotic cardiovascular disease
- LDL-C
Low density lipoprotein cholesterol
- TG
Triglycerides
- HDL-C
High density lipoprotein cholesterol
- TC
Total Cholesterol
- BMI
Body Mass Index
- ARIC
Atherosclerosis Risk in Communities
- BP
Blood pressure
- WC
Waist circumference
- eGFR
Estimated Glomerular Filtration Rate
Footnotes
Author Contributions:
KFF and EDM designed the research. DZ analyzed the data under the supervision of EG and EDM. KFF wrote the first draft of the paper. DZ, SSM, JRL, SRJ, EG, CMB, and EDM all reviewed manuscript and provided critical scientific input. KFF and EDM had primary responsibility for final content. All authors approved of final manuscript draft.
Conflicts of Interest:
- Grant/Research Support (all significant; all paid to institution, not individual): Abbott Diagnostic, Roche Diagnostic
- Consultant (all modest): Abbott Diagnostics, Roche
- Other: Provisional patent (patent no. 61721475) entitled “Biomarkers to Improve Prediction of Heart Failure Risk” filed by Baylor College of Medicine and Roche
- Grant/Research Support (all significant; all paid to institution, not individual; all outside subject matter of this manuscript): PJ Schafer Cardiovascular Research Fund, Aetna Foundation, American Heart Association, Google
- Consultant (all modest): Abbott Nutrition, Pressed Juicery, Quest Diagnostics, Pew Research Institute
- Other: co-inventor on a provisional patent filed by Johns Hopkins University for a novel method of LDL-C
- Consultant (modest): Siemens Healthcare Diagnostics
No other authors declare a conflict of interest.
Publisher's Disclaimer: This is a PDF file of an unedited manuscript that has been accepted for publication. As a service to our customers we are providing this early version of the manuscript. The manuscript will undergo copyediting, typesetting, and review of the resulting proof before it is published in its final citable form. Please note that during the production process errors may be discovered which could affect the content, and all legal disclaimers that apply to the journal pertain.
References
- 1.Mozaffarian D, Benjamin EJ, Go AS, Arnett DK, Blaha MJ, Cushman M, et al. Executive Summary: Heart Disease and Stroke Statistics-2016 Update: A Report From the American Heart Association. Circulation. 2016;133:447–54. doi: 10.1161/CIR.0000000000000366. [DOI] [PubMed] [Google Scholar]
- 2.Austin MA, Breslow JL, Hennekens CH, Buring JE, Willett WC, Krauss RM. Low-density lipoprotein subclass patterns and risk of myocardial infarction. JAMA. 1988;260:1917–21. [PubMed] [Google Scholar]
- 3.Zerwekh JE. Blood biomarkers of vitamin D status. Am J Clin Nutr. 2008;87:1087S–91S. doi: 10.1093/ajcn/87.4.1087S. [DOI] [PubMed] [Google Scholar]
- 4.Wang L, Song Y, Manson JE, Pilz S, Marz W, Michaelsson K, et al. Circulating 25-hydroxy-vitamin D and risk of cardiovascular disease: a meta-analysis of prospective studies. Circ Cardiovasc Qual Outcomes. 2012;5:819–29. doi: 10.1161/CIRCOUTCOMES.112.967604. [DOI] [PMC free article] [PubMed] [Google Scholar]
- 5.Manson JE, Bassuk SS. Vitamin D research and clinical practice: at a crossroads. JAMA. 2015;313:1311–2. doi: 10.1001/jama.2015.1353. [DOI] [PubMed] [Google Scholar]
- 6.Ponda MP, Huang X, Odeh MA, Breslow JL, Kaufman HW. Vitamin D may not improve lipid levels: a serial clinical laboratory data study. Circulation. 2012;126:270–7. doi: 10.1161/CIRCULATIONAHA.111.077875. [DOI] [PMC free article] [PubMed] [Google Scholar]
- 7.Jorde R, Figenschau Y, Hutchinson M, Emaus N, Grimnes G. High serum 25-hydroxyvitamin D concentrations are associated with a favorable serum lipid profile. Eur J Clin Nutr. 2010;64:1457–64. doi: 10.1038/ejcn.2010.176. [DOI] [PubMed] [Google Scholar]
- 8.Kelishadi R, Farajzadegan Z, Bahreynian M. Association between vitamin D status and lipid profile in children and adolescents: a systematic review and meta-analysis. Int J Food Sci Nutr. 2014;65:404–10. doi: 10.3109/09637486.2014.886186. [DOI] [PubMed] [Google Scholar]
- 9.Lupton JR, Faridi KF, Martin SS, Sharma S, Kulkarni K, Jones SR, et al. Deficient serum 25-hydroxyvitamin D is associated with an atherogenic lipid profile: The Very Large Database of Lipids (VLDL-3) study. J Clin Lipidol. 2016;10:72–81. e1. doi: 10.1016/j.jacl.2015.09.006. [DOI] [PMC free article] [PubMed] [Google Scholar]
- 10.The Atherosclerosis Risk in Communities (ARIC) Study: design and objectives. The ARIC investigators. Am J Epidemiol. 1989;129:687–702. [PubMed] [Google Scholar]
- 11.Shoben AB, Kestenbaum B, Levin G, Hoofnagle AN, Psaty BM, Siscovick DS, et al. Seasonal variation in 25-hydroxyvitamin D concentrations in the cardiovascular health study. Am J Epidemiol. 2011;174:1363–72. doi: 10.1093/aje/kwr258. [DOI] [PMC free article] [PubMed] [Google Scholar]
- 12.McKibben RA, Zhao D, Lutsey PL, Schneider AL, Guallar E, Mosley TH, et al. Factors associated with change in 25-hydroxyvitamin D levels over longitudinal followup in the ARIC study. J Clin Endocrinol Metab. 2015:jc20151711. doi: 10.1210/jc.2015-1711. [DOI] [PMC free article] [PubMed] [Google Scholar]
- 13.Holick MF, Binkley NC, Bischoff-Ferrari HA, Gordon CM, Hanley DA, Heaney RP, et al. Evaluation, treatment, and prevention of vitamin D deficiency: an Endocrine Society clinical practice guideline. J Clin Endocrinol Metab. 2011;96:1911–30. doi: 10.1210/jc.2011-0385. [DOI] [PubMed] [Google Scholar]
- 14.Friedewald WT, Levy RI, Fredrickson DS. Estimation of the concentration of low-density lipoprotein cholesterol in plasma, without use of the preparative ultracentrifuge. Clin Chem. 1972;18:499–502. [PubMed] [Google Scholar]
- 15.National Cholesterol Education Program Expert Panel on Detection E, Treatment of High Blood Cholesterol in A. Third Report of the National Cholesterol Education Program (NCEP) Expert Panel on Detection, Evaluation, and Treatment of High Blood Cholesterol in Adults (Adult Treatment Panel III) final report. Circulation. 2002;106:3143–421. [PubMed] [Google Scholar]
- 16.Baecke JA, Burema J, Frijters JE. A short questionnaire for the measurement of habitual physical activity in epidemiological studies. Am J Clin Nutr. 1982;36:936–42. doi: 10.1093/ajcn/36.5.936. [DOI] [PubMed] [Google Scholar]
- 17.Inker LA, Schmid CH, Tighiouart H, Eckfeldt JH, Feldman HI, Greene T, et al. Estimating glomerular filtration rate from serum creatinine and cystatin C. N Engl J Med. 2012;367:20–9. doi: 10.1056/NEJMoa1114248. [DOI] [PMC free article] [PubMed] [Google Scholar]
- 18.Royston P, Parmar MK. Flexible parametric proportional-hazards and proportional-odds models for censored survival data, with application to prognostic modelling and estimation of treatment effects. Stat Med. 2002;21:2175–97. doi: 10.1002/sim.1203. [DOI] [PubMed] [Google Scholar]
- 19.Wu J, Province MA, Coon H, Hunt SC, Eckfeldt JH, Arnett DK, et al. An investigation of the effects of lipid-lowering medications: genome-wide linkage analysis of lipids in the HyperGEN study. BMC Genet. 2007;8:60. doi: 10.1186/1471-2156-8-60. [DOI] [PMC free article] [PubMed] [Google Scholar]
- 20.Lutsey PL, Rasmussen-Torvik LJ, Pankow JS, Alonso A, Smolenski DJ, Tang W, et al. Relation of lipid gene scores to longitudinal trends in lipid levels and incidence of abnormal lipid levels among individuals of European ancestry: the Atherosclerosis Risk in Communities (ARIC) study. Circ Cardiovasc Genet. 2012;5:73–80. doi: 10.1161/CIRCGENETICS.111.959619. [DOI] [PMC free article] [PubMed] [Google Scholar]
- 21.Jorde R, Grimnes G. Vitamin D and metabolic health with special reference to the effect of vitamin D on serum lipids. Prog Lipid Res. 2011;50:303–12. doi: 10.1016/j.plipres.2011.05.001. [DOI] [PubMed] [Google Scholar]
- 22.Kazlauskaite R, Powell LH, Mandapakala C, Cursio JF, Avery EF, Calvin J. Vitamin D is associated with atheroprotective high-density lipoprotein profile in postmenopausal women. J Clin Lipidol. 2010;4:113–9. doi: 10.1016/j.jacl.2010.01.006. [DOI] [PMC free article] [PubMed] [Google Scholar]
- 23.Shirts BH, Howard MT, Hasstedt SJ, Nanjee MN, Knight S, Carlquist JF, et al. Vitamin D dependent effects of APOA5 polymorphisms on HDL cholesterol. Atherosclerosis. 2012;222:167–74. doi: 10.1016/j.atherosclerosis.2012.02.030. [DOI] [PMC free article] [PubMed] [Google Scholar]
- 24.Vimaleswaran KS, Cavadino A, Hypponen E. APOA5 genotype influences the association between 25-hydroxyvitamin D and high density lipoprotein cholesterol. Atherosclerosis. 2013;228:188–92. doi: 10.1016/j.atherosclerosis.2013.02.006. [DOI] [PubMed] [Google Scholar]
- 25.Zhao D, Ouyang P, de Boer IH, Lutsey PL, Farag YMK, Guallar E, et al. Serum vitamin D and sex hormones levels in men and women: The Multi-Ethnic Study of Atherosclerosis (MESA) Maturitas. 2017;96:95–102. doi: 10.1016/j.maturitas.2016.11.017. [DOI] [PMC free article] [PubMed] [Google Scholar]
- 26.Klenk J, Rapp K, Denkinger M, Nagel G, Nikolaus T, Peter R, et al. Objectively measured physical activity and vitamin D status in older people from Germany. J Epidemiol Community Health. 2015;69:388–92. doi: 10.1136/jech-2014-204632. [DOI] [PubMed] [Google Scholar]
- 27.Monda KL, Ballantyne CM, North KE. Longitudinal impact of physical activity on lipid profiles in middle-aged adults: the Atherosclerosis Risk in Communities Study. J Lipid Res. 2009;50:1685–91. doi: 10.1194/jlr.P900029-JLR200. [DOI] [PMC free article] [PubMed] [Google Scholar]
- 28.Wortsman J, Matsuoka LY, Chen TC, Lu Z, Holick MF. Decreased bioavailability of vitamin D in obesity. Am J Clin Nutr. 2000;72:690–3. doi: 10.1093/ajcn/72.3.690. [DOI] [PubMed] [Google Scholar]
- 29.Vimaleswaran KS, Berry DJ, Lu C, Tikkanen E, Pilz S, Hiraki LT, et al. Causal relationship between obesity and vitamin D status: bi-directional Mendelian randomization analysis of multiple cohorts. PLoS Med. 2013;10:e1001383. doi: 10.1371/journal.pmed.1001383. [DOI] [PMC free article] [PubMed] [Google Scholar]
- 30.Vogt S, Baumert J, Peters A, Thorand B, Scragg R. Effect of waist circumference on the association between serum 25-hydroxyvitamin D and serum lipids: results from the National Health and Nutrition Examination Survey 2001–2006. Public Health Nutr. 2016:1–10. doi: 10.1017/S1368980016001762. [DOI] [PMC free article] [PubMed] [Google Scholar]
- 31.Ertugrul DT, Yavuz B, Cil H, Ata N, Akin KO, Kucukazman M, et al. STATIN-D study: comparison of the influences of rosuvastatin and fluvastatin treatment on the levels of 25 hydroxyvitamin D. Cardiovasc Ther. 2011;29:146–52. doi: 10.1111/j.1755-5922.2010.00141.x. [DOI] [PubMed] [Google Scholar]
- 32.Perez-Castrillon JL, Vega G, Abad L, Sanz A, Chaves J, Hernandez G, et al. Effects of Atorvastatin on vitamin D levels in patients with acute ischemic heart disease. Am J Cardiol. 2007;99:903–5. doi: 10.1016/j.amjcard.2006.11.036. [DOI] [PubMed] [Google Scholar]
- 33.Castelli WP, Anderson K, Wilson PW, Levy D. Lipids and risk of coronary heart disease. The Framingham Study. Ann Epidemiol. 1992;2:23–8. doi: 10.1016/1047-2797(92)90033-m. [DOI] [PubMed] [Google Scholar]
- 34.Ingelsson E, Schaefer EJ, Contois JH, McNamara JR, Sullivan L, Keyes MJ, et al. Clinical utility of different lipid measures for prediction of coronary heart disease in men and women. JAMA. 2007;298:776–85. doi: 10.1001/jama.298.7.776. [DOI] [PubMed] [Google Scholar]
- 35.Zemel MB, Shi H, Greer B, Dirienzo D, Zemel PC. Regulation of adiposity by dietary calcium. FASEB J. 2000;14:1132–8. [PubMed] [Google Scholar]
- 36.Zittermann A, Frisch S, Berthold HK, Gotting C, Kuhn J, Kleesiek K, et al. Vitamin D supplementation enhances the beneficial effects of weight loss on cardiovascular disease risk markers. Am J Clin Nutr. 2009;89:1321–7. doi: 10.3945/ajcn.2008.27004. [DOI] [PubMed] [Google Scholar]
- 37.Cho HJ, Kang HC, Choi SA, Ju YC, Lee HS, Park HJ. The possible role of Ca2+ on the activation of microsomal triglyceride transfer protein in rat hepatocytes. Biol Pharm Bull. 2005;28:1418–23. doi: 10.1248/bpb.28.1418. [DOI] [PubMed] [Google Scholar]
- 38.Pham TM, Ekwaru JP, Loehr SA, Veugelers PJ. The Relationship of Serum 25-Hydroxyvitamin D and Insulin Resistance among Nondiabetic Canadians: A Longitudinal Analysis of Participants of a Preventive Health Program. PLoS One. 2015;10:e0141081. doi: 10.1371/journal.pone.0141081. [DOI] [PMC free article] [PubMed] [Google Scholar]
- 39.Tavakoli F, Namakin K, Zardast M. Vitamin D Supplementation and High-Density Lipoprotein Cholesterol: A Study in Healthy School Children. Iran J Pediatr. 2016;26:e3311. doi: 10.5812/ijp.3311. [DOI] [PMC free article] [PubMed] [Google Scholar]
- 40.Samimi M, Kashi M, Foroozanfard F, Karamali M, Bahmani F, Asemi Z, et al. The effects of vitamin D plus calcium supplementation on metabolic profiles, biomarkers of inflammation, oxidative stress and pregnancy outcomes in pregnant women at risk for pre-eclampsia. J Hum Nutr Diet. 2016;29:505–15. doi: 10.1111/jhn.12339. [DOI] [PubMed] [Google Scholar]
- 41.Asemi Z, Raygan F, Bahmani F, Rezavandi Z, Talari HR, Rafiee M, et al. The effects of vitamin D, K and calcium co-supplementation on carotid intima-media thickness and metabolic status in overweight type 2 diabetic patients with CHD. Br J Nutr. 2016;116:286–93. doi: 10.1017/S0007114516001847. [DOI] [PubMed] [Google Scholar]
- 42.Lorvand Amiri H, Agah S, Mousavi SN, Hosseini AF, Shidfar F. Regression of Non-Alcoholic Fatty Liver by Vitamin D Supplement: A Double-Blind Randomized Controlled Clinical Trial. Arch Iran Med. 2016;19:631–8. [PubMed] [Google Scholar]
- 43.Andersen R, Brot C, Mejborn H, Molgaard C, Skovgaard LT, Trolle E, et al. Vitamin D supplementation does not affect serum lipids and lipoproteins in Pakistani immigrants. Eur J Clin Nutr. 2009;63:1150–3. doi: 10.1038/ejcn.2009.18. [DOI] [PubMed] [Google Scholar]
- 44.Jorde R, Sneve M, Torjesen P, Figenschau Y. No improvement in cardiovascular risk factors in overweight and obese subjects after supplementation with vitamin D3 for 1 year. J Intern Med. 2010;267:462–72. doi: 10.1111/j.1365-2796.2009.02181.x. [DOI] [PubMed] [Google Scholar]
- 45.Wang H, Xia N, Yang Y, Peng DQ. Influence of vitamin D supplementation on plasma lipid profiles: a meta-analysis of randomized controlled trials. Lipids Health Dis. 2012;11:42. doi: 10.1186/1476-511X-11-42. [DOI] [PMC free article] [PubMed] [Google Scholar]
- 46.Ford JA, MacLennan GS, Avenell A, Bolland M, Grey A, Witham M, et al. Cardiovascular disease and vitamin D supplementation: trial analysis, systematic review, and meta-analysis. Am J Clin Nutr. 2014;100:746–55. doi: 10.3945/ajcn.113.082602. [DOI] [PubMed] [Google Scholar]
- 47.Manson JE, Bassuk SS, Lee IM, Cook NR, Albert MA, Gordon D, et al. The VITamin D and OmegA-3 TriaL (VITAL): rationale and design of a large randomized controlled trial of vitamin D and marine omega-3 fatty acid supplements for the primary prevention of cancer and cardiovascular disease. Contemp Clin Trials. 2012;33:159–71. doi: 10.1016/j.cct.2011.09.009. [DOI] [PMC free article] [PubMed] [Google Scholar]
Associated Data
This section collects any data citations, data availability statements, or supplementary materials included in this article.