

Abstract
Purpose
To assess inter-rater and test-retest reliability of the 6th Edition Beery-Buktenica Developmental Test of Visual-Motor Integration (VMI) and test-retest reliability of the VMI Visual Perception Supplemental Test (VMIp) in school-age children.
Methods
Subjects were 163 Native American 3rd – 8th grade students with no significant refractive error (astigmatism < 1.00 D, myopia: < 0.75 D, hyperopia: < 2.50 D, anisometropia < 1.50 D) or ocular abnormalities. The VMI and VMIp were administered twice, on separate days. All VMI tests were scored by two trained scorers and a subset of 50 tests were also scored by an experienced scorer. Scorers strictly applied objective scoring criteria. Analyses included inter-rater and test-retest assessments of bias, 95% limits of agreement, and intraclass correlation analysis.
Results
Trained scorers had no significant scoring bias compared to the experienced scorer. One of the two trained scorers tended to provide higher scores than the other (mean difference in standardized scores = 1.54). Inter-rater correlations were strong (0.75 to 0.88). VMI and VMIp test-retest comparisons indicated no significant bias (subjects did not tend to score better on retest). Test-retest correlations were moderate (0.54 to 0.58). The 95% LOAs for the VMI were −24.14 to 24.67 (scorer 1) and −26.06 to 26.58 (scorer 2) and the 95% LOAs for the VMIp were −27.11 to 27.34.
Conclusions
The 95% LOA for test-retest differences will be useful for determining if the VMI and VMIp have sufficient sensitivity for detecting change with treatment in both clinical and research settings. Further research on test-retest reliability reporting 95% LOAs for children across different age ranges are recommended, particularly if the test is to be used to detect changes due to intervention or treatment.
Keywords: children, visual motor integration, test-retest reliability, inter-rater reliability
Clinical studies assessing the impact of uncorrected refractive errors and ocular abnormalities in children and studies assessing the effectiveness of treatments for such conditions typically focus on traditional measures of visual function (e.g., visual acuity, stereopsis, ocular alignment). However, assessment of the broader impact of impaired visual function on other aspects of child development and learning can also provide valuable input for clinical decision-making. For example, development of the skills necessary to effectively coordinate vision, perception, and finger/hand movements to perform fine motor tasks (e.g., writing, drawing, manipulation of small objects), often referred to as visual motor integration, is likely to rely on the quality of visual input and accuracy of visual perception as well as the ability to execute and control fine movements. Despite this, there are few studies in the literature assessing the effects of refractive errors or ocular abnormalities on visual motor integration in children.1–4 In the present study, we assessed reliability of the Beery-Buktenica Developmental Test of Visual-Motor Integration (VMI) and Visual Perception Test (VMIp) (Pearson Clinical Assessment, Bloomington MN). This data will help clinicians and researchers determine if these instruments have sufficient reliability for assessment of pediatric patients and for monitoring change in pediatric patients with treatment.
For almost 50 years, the Beery-Buktenica Developmental Test of Visual-Motor Integration (VMI, currently in its 6th Edition) has been a widely used and accepted test of visual motor abilities.5 The VMI consists of a series of line drawings of geometric forms that are to be copied as accurately as possible. Two optional supplemental tests were introduced with the 4th Edition of the VMI. The supplemental tests, administered after the VMI, can be used to separately assess visual (Visual Perception Test (VMIp)) and motor performance (Motor Coordination Test).5 For each item on the Visual Perception Test, students are shown a form with several similar forms below it, and are asked identify the form that is identical to the one on top. For each item on the Motor Coordination Test, students are asked to draw lines within specific areas on each form. The VMI has included the same 24 forms since its introduction and the same forms are used in all three tests.
The VMI may be a particularly useful instrument for assessing change over time in pediatric clinical vision studies as it can be used across a wide age range (norms provided for age 2 through adult), allowing for longitudinal assessments with the same instrument from toddlerhood through adulthood. However, the usefulness of any measurement instrument is dependent upon the reliability of its measurements.
There have been several previous reports on reliability of the VMI. However, most reports used correlation analyses to assess inter-rater and test-retest reliability. Correlation analysis has several limitations for assessment of agreement between two measurements.6 While correlation coefficient can provide an indication of how related two measurements are (e.g., high scores from one scorer are associated with high scores from the other scorer), it provides little information on the limits of agreement between two measurements and the nature of any bias between measurements. If there is consistent bias between measurements (e.g., if one scorer consistently scores higher than the other), the correlation can be high, even though absolute agreement between test scores is poor. Bland-Altman analysis is a widely accepted method of assessing agreement between two measurements because it provides information on measurement bias, variability between measurements, and an estimate of the range of differences between measurements that can be expected in the population (limits of agreement, LOA).6 In the present analysis, we assessed inter-rater reliability (agreement between two individuals scoring the same tests) and test-retest reliability (agreement between tests completed twice, on separate days, by the same student) of measurements using 6th Edition VMI and VMIp in a sample of 3rd through 8th grade students. We report bias (mean difference between scores) and 95% LOA for inter-rater and test-retest differences in scores and correlation between inter-rater and test-retest scores was determined for comparison with previous studies.
METHODS
Participants
Participants were students who attended school on the Tohono O’odham Native American Reservation during the 2013/14 school year. All students in 3rd through 8th grades were eligible to participate. Data were collected as part of a larger study assessing the effects of eyeglass correction of astigmatism. The present analysis includes only the cohort of students in the sample who did not require eyeglasses and had no ocular abnormalities.
This study complied with the Declaration of Helsinki and was approved by the Tohono O’odham Nation and the Institutional Review Board of the University of Arizona. Written informed consent was obtained from parents and written assent was obtained from students prior to testing.
Procedures
Each student had a full cycloplegic eye examination. The exam included assessments of uncorrected monocular and binocular distance acuity using logMAR letter acuity charts, ocular health, ocular alignment, and cycloplegic refraction.
Students completed the Full Form VMI and the VMIp twice at least 1 week apart. The Motor Coordination subtest was not administered. Our primary interest in the larger study (for which the data was collected) was to assess the effects of astigmatism on several outcome measures, including the VMI. The time available for testing was limited, as testing was conducted during the school day. Therefore, we chose to focus on tests that rely more heavily on visual demands, the VMI and VMIp.5 The Motor Coordination test was excluded because it was designed specifically to reduce visual-perceptual demands.5
On each day, the VMI was administered first and was followed immediately by the VMIp. Students were tested individually according to procedures outlined in the VMI Manual.5 They were provided a pen and were seated at a table with the VMI test booklet centered in front of them and squared with the table. Students were instructed to “copy the forms in order, to do their best (even though some of them are hard, even for adults), and to remember that they cannot erase”, and were given an example.5 Once the VMI test was completed, the tester collected the booklet and proceeded with the VMIp according to procedures outlined in the VMI manual.5 For each item on the VMIp, students are shown a form with several forms below it, and are asked to look at each form and identify the form that is identical to the one on top.
Data Analysis
Analyses only included data from students with no ocular abnormalities and no significant refractive error (astigmatism < 1.00 D, myopia < 0.75 D on any meridian, hyperopia < 2.50 D on any meridian, spherical equivalent anisometropia < 1.50 D).
In order to assess inter-rater agreement, every VMI test (2 for each student) was scored by two research team members (KMM and TKL). Scorers were instructed to follow the objective VMI objective scoring criteria strictly, using rulers and protractors as needed.5 The scorers, both experienced pediatric vision research coordinators, received extensive training and practice in scoring the VMI prior to scoring results from the present study. Training included studying the VMI manual, attending a web-based presentation on scoring provided by an experienced scorer (MTK), practice administering the test to children and adults, and practice scoring tests. Prior to scoring of study data, results from practice tests scored by both scorers were compared, and scoring discrepancies were discussed and resolved between the two scorers using the objective criteria as a reference.
Previous studies have reported a wide range of reliability results and have suggested that inter-rater reliability may be significantly influenced by the amount of scorer training and experience.7–12 Therefore, a subset of 50 VMI tests (from 50 different students) were also scored by the experienced scorer in order to determine if scorers 1 and 2 were performing in a manner comparable to a highly experienced scorer. The experienced scorer is an academic optometrist (MTK) who has published several research studies on the VMI.13–16 Since the VMIp is a multiple choice assessment, it was scored by one research team member and verified by a second.
Summary raw scores and standardized scores for each test and for each scorer were determined and results are presented and analyzed in terms of both raw and standardized scores. Standardized scores are based on a norming sample of 1,737 children selected to be representative of the US population (based on the 2010 US Census) and included children with the following ethnicities: White (59%), Hispanic (18%), Black (16%), Asian (4%), and Other (3%).5
Inter-rater reliability for the VMI was assessed in terms of the following comparisons: scorer 1 vs. experienced scorer, scorer 2 vs. experienced scorer, scorer 1 vs. scorer 2 (separate analyses for data from the first test administered to subjects and second test administered to subjects). Test-retest reliability for the VMI and VMIp were assessed by comparing first and second tests completed by each student. Test-retest reliability for the VMI was assessed separately for data from scorer 1 and scorer 2 so that results would not be confounded by any inter-rater differences. Intraclass correlation (ICC) was used to assess reliability.17 This was a two-way random effects model assessing absolute difference between measures that used the ICC for a single measure.
Wilcoxon Signed Rank Tests were used to determine if the inter-rater difference in scores and if the test-retest difference in scores significantly differed from 0, i.e., to determine if any bias was present. We also examined the data from the first tests administered to students to determine if any specific test forms had particularly high, or low, scorer agreement.
Test-retest differences were compared across grade using a Kruskal-Wallis Test to determine if the distributions varied significantly across grade. The 95% limits of agreement (LOA) for inter-rater and test-retest differences (mean difference between scores +/− 1.96 standard deviations) were determined and Bland-Altman plots (mean of two measurements on the x axis, difference between measurements on the y axis) were constructed for raw and standardized score data.
RESULTS
Demographic characteristics of the 163 students in the primary study sample (comparison between trained scorers) and the sub-sample of 50 tests (comparison between trained scorers and an experienced scorer) are summarized in Table 1. Mean uncorrected distance acuity in the primary analysis sample was −0.10 logMAR (20/16, SD 0.12).
Table 1.
Demographic characteristics of study samples.
| Variable | Study Sample (n=163) | Sub-Sample (n=50) | |
|---|---|---|---|
|
| |||
| Gender (female/Male) | 46.6%/53.4% | 48%/52% | |
|
| |||
| Mean Age (SD, range) | 11.51 (1.76, 8.21–15.87) | 11.41 (1.76, 8.33–15.33) | |
| Grade (%) | 3 | 16.6% | 24% |
| 4 | 19.0% | 14% | |
| 5 | 14.7% | 10% | |
| 6 | 23.3% | 24% | |
| 7 | 8.6% | 18% | |
| 8 | 17.8% | 10% | |
Inter-Rater Reliability: Scorers 1 and 2 vs. Experienced Scorer
Results of analyses assessing inter-rater reliability are shown in the upper portion of Table 2 (raw scores) and Table 3 (standardized scores). The difference between the scorers and the experienced scorer did not significantly differ from 0, indicating no significant scoring bias. Correlations were all positive, significant, and were very strong (≥ 0.84, p < 0.001).
Table 2.
Summary of Inter-rater and test-retest Intraclass Correlation (ICC), Wilcoxon Signed Rank Test, and 95% limits of agreement for difference in raw scores for the VMI and VMIp tests among 3rd to 8th graders.
| Raw Score Comparison | N | Intraclass Correlation (95% Confidence Interval) | Mean Difference (SD) | Wilcoxon Signed Rank Test | 95% Limits of Agreement for Difference in Scores | ||
|---|---|---|---|---|---|---|---|
|
| |||||||
| p value | Lower | Upper | |||||
| VMI Inter-Rater Reliability: Scorers 1 & 2 vs. Experienced Scorer | Scorer 1 | 50 | 0.89 (0.82–0.94) | 0.32 (1.56) | 0.212 | −2.73 | 3.37 |
| Scorer 2 | 50 | 0.84 (0.74–0.91) | 0.30 (1.85) | 0.314 | −3.33 | 3.93 | |
|
| |||||||
| VMI Inter-Rater Reliability | Test 1* | 163 | 0.75 (0.68–0.81) | 0.34 (2.24) | 0.074 | −4.06 | 4.73 |
| Test 2* | 163 | 0.86 (0.81–0.90) | 0.37 (1.82) | 0.002 | −3.20 | 3.93 | |
|
| |||||||
| VMI Test-Retest Reliability | Scorer 1† | 163 | 0.62 (0.52–0.71) | −0.09 (2.92) | 0.515 | −5.81 | 5.62 |
| Scorer 2† | 163 | 0.56 (0.44–0.65) | −0.06 (3.17) | 0.455 | −6.27 | 6.14 | |
|
| |||||||
| VMIp Test-Retest Reliability | 163 | 0.56 (0.45–0.66) | −0.13 (3.50) | 0.597 | −6.99 | 6.73 | |
Scorer 1 vs. scorer 2;
First test administered vs. second test administered.
Table 3.
Summary of Inter-rater and test-retest Intraclass Correlations, Wilcoxon Signed Rank Test, and 95% limits of agreement for difference in standardized scores for the VMI and VMIp among 3rd to 8th graders.
| Standardized Score Comparison | N | Intraclass Correlation (95% Confidence Interval) | Mean Difference (SD) | Wilcoxon Signed Rank Test | 95% Limits of Agreement for Difference in Scores | ||
|---|---|---|---|---|---|---|---|
|
| |||||||
| p value | Lower | Upper | |||||
| VMI Inter-Rater Reliability: Scorers 1 & 2 vs. Experienced Scorer | Scorer 1 | 50 | 0.88 (0.80–0.93) | 1.18 (6.32) | 0.218 | −11.21 | 13.57 |
| Scorer 2 | 50 | 0.85 (0.75–0.91) | 1.12 (7.24) | 0.344 | −13.07 | 15.31 | |
|
| |||||||
| VMI Inter-Rater Reliability | Test 1* | 163 | 0.75 (0.67–0.81) | 1.54 (9.34) | 0.047 | −16.78 | 19.86 |
| Test 2* | 163 | 0.85 (0.80–0.89) | 1.53 (7.66) | 0.004 | −13.47 | 16.54 | |
|
| |||||||
| VMI Test-Retest Reliability | Scorer 1† | 163 | 0.58 (0.47–0.67) | 0.26 (12.45) | 0.977 | −24.14 | 24.67 |
| Scorer 2† | 163 | 0.54 (0.43–0.64) | 0.26 (13.43) | 0.950 | −26.06 | 26.58 | |
|
| |||||||
| VMIp Test-Retest Reliability | 163 | 0.58 (0.47–0.68) | 0.12 (13.89) | 0.832 | −27.11 | 27.34 | |
Scorer 1 vs. scorer 2;
First test administered vs. second test administered.
Inter-Rater Reliability: Scorer 1 vs. Scorer 2
Analyses were conducted separately for the first VMI test and for the 2nd VMI test (retest). Results are shown in Tables 2 (raw scores) and 3 (standardized scores) and in Figure 1. The difference between standardized scores was statistically significant, indicating that one scorer tended to give higher scores (mean difference in standardized scores of 1.54 and 1.53 for the first and second tests administered to subjects). The difference between raw scores was significant only for the second test administered to subjects (see Table 2). Correlation analysis indicated significant strong positive associations between scores from scorers 1 and 2 (p<0.001).
Figure 1.
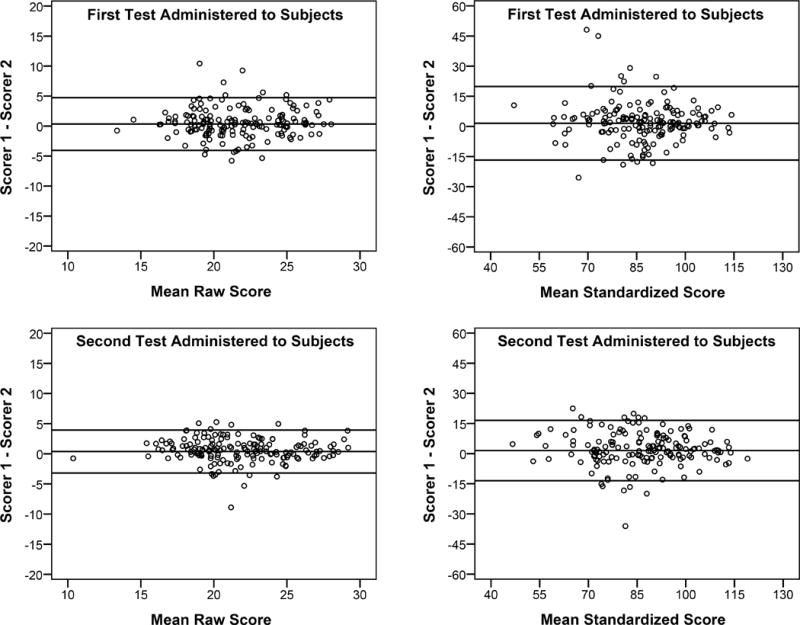
Bland-Altman (difference vs. mean) plot of VMI inter-rater agreement for the first tests administered to subjects (top) and the second test administered to subjects (bottom). Data are plotted both in terms of raw scores (left) and standardized scores (right). Reference lines are mean and 95% limits of agreement (mean +/− 1.96(SD)).
Analysis of scorer agreement by individual test form indicated that scorers agreed over 90% of the time on 15 forms (form #7–17, 19, 27, 28, and 30), scorers agreed 79% to 89% of the time on 8 forms (forms 20–26 and 29), and on one form (#18), scorers agreed only 58% of the time. Additional analysis indicated that when there was disagreement on form #18, one scorer consistently scored it as correct and the other scored it as incorrect, with the exception of one test.
Test-Retest Reliability
The average number of days between test and retest (inter-test interval) was 63.38 days (SD 33.98, range12–133). The lower portions of Tables 2 and 3 and Figure 2 summarize test-retest reliability results. For the VMI, separate analyses were conducted for the results from each of the two scorers. The differences between test and retest scores for the VMI and VMIp did not significantly differ from 0. Test-retest differences did not significantly vary across grade. Test-retest correlations for both the VMI and for the VMIp were statistically significant, positive, and moderate in strength (p < 0.001).
Figure 2.
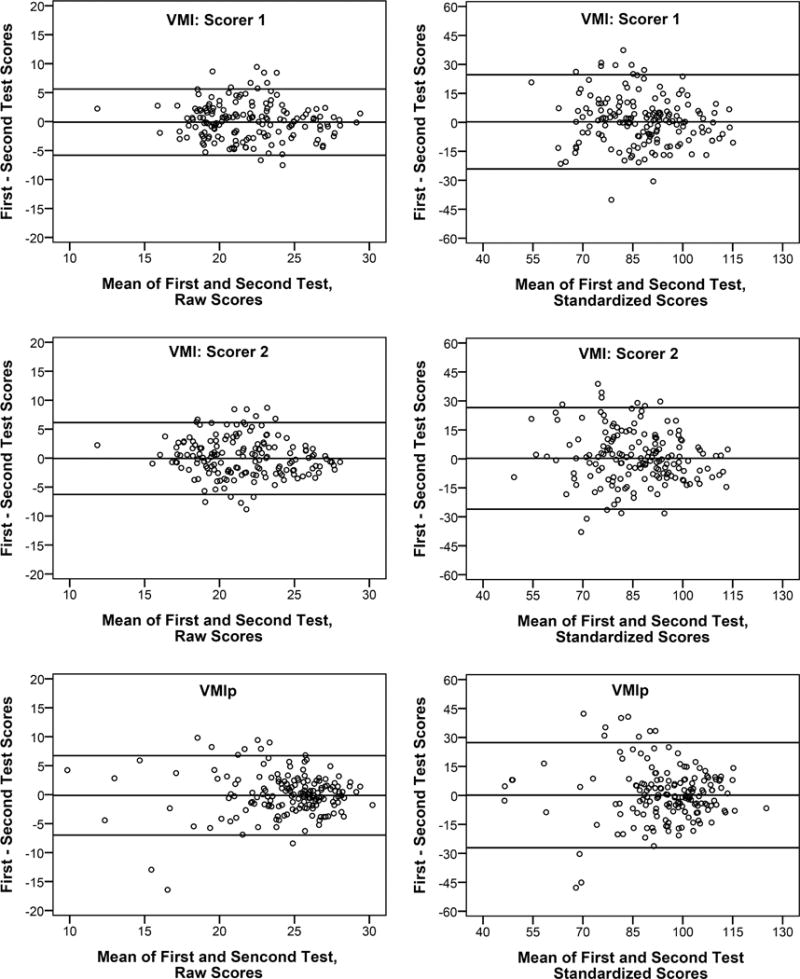
Bland-Altman (difference vs. mean) plot of test-retest agreement for VMI tests scored by scorer 1 (top), VMI tests scored by scorer 2 (middle), and VMIp tests (bottom). Data plotted are plotted both in terms of raw scores (left) and standardized scores (right). Reference lines are mean and 95% limits of agreement (mean +/− 1.96(SD)).
Due to the wide range in inter-test intervals, we conducted post hoc analyses to determine if length of inter-test interval influenced test-retest results. For subjects with large inter-test intervals, test-retest agreement could be influenced by development that occurs between tests. Therefore, to minimize the effects of development that may have occurred between tests, a post-hoc test-retest analysis was conducted including only the 25 students who had a retest within 4 weeks of their initial test. For standardized scores, these students had higher scores on the retest, but the difference between test and retest scores was not statistically significant for the VMI (mean difference of −3.24 (SD 11.55, p=0.173) for VMI scorer 1, mean difference of −1.92 (SD 10.98, p=0.391) for VMI scorer 2) or for the VMIp (mean difference of −1.60 (SD19.37, p=0.683)). Test-retest intraclass correlations were 0.62 (p < 0.001) and 0.65 (p= 0.001) for the VMI for scorers 1 and 2, and test-retest correlation was 0.13 (p=0.270) for the VMIp.
DISCUSSION
The present study reports inter-rater and test-retest reliability for the VMI and test-retest reliability for the VMIp in a sample of 163 students using the most recent version of the tests (6th Edition). This study makes two important contributions to the literature on the reliability of VMI and VMIp. First, although there have been previous reports on reliability, most of the studies have used correlation analysis to assess reliability.5,18–20 The Bland-Altman analyses used in the present study provide information on how well scores agree (Figures 1 and 2). The 95% LOA provide both clinicians and researchers with a range of differences in test and retest scores that would be expected for children of this grade range if no treatment or intervention was given between tests. These data are important and will allow for determination of what would be a “meaningful” change (beyond what would be expected upon simple retest) with intervention or treatment. Second, many of the previous studies of inter-rater reliability were conducted using previous versions of the VMI. The VMI has included the same 24 forms since its introduction, but there have been some changes to the scoring of the VMI over the years. The most notable change in terms of its potential impact on test reliability was implemented with the 3rd Edition (1989) when additional specificity was added to the scoring criteria.5 There have been few published studies on reliability since these changes were implemented.21
Inter-Rater Reliability
Research on early versions of the VMI indicated a wide range of reliability results and suggested that inter-rater reliability may be significantly influenced by the amount of scorer training and experience.16–21 Reports on recent versions of the VMI (4th, 5th, and 6th Editions) indicate consistently high Inter-rater reliabilities (>0.90).5,18–20 High reliabilities on the recent test versions may be the result of changes to scoring that has provided increased specificity to scoring criteria.
Our inter-rater reliabilities were strong but slightly lower than these previous reports. Correlations between the highly experienced scorer and the two trained scorers were very strong (0.90 and 0.83) and were equivalent to or better than correlation between scorers 1 and 2 (0.88 and 0.85). Strong agreement between the highly experience scorer and the two trained scorers supports the validity of the trained scorers’ assessments and suggest that scorer experience did not influence reliability results in our study.
The significance of the Wilcoxon Signed Rank tests comparing results from scorer 1 vs. scorer 2 suggest that there was some scorer bias, which is also evident in the finding that the correlation with the experienced scorer was slightly higher for scorer 1 than scorer 2. Our analysis of scorer agreement by individual test form yielded a high level of agreement (>90%) on 15 of the 24 forms. Most of these forms were the simplest forms (e.g., a square, cross, or a diagonal line, which almost all school-age students will get “correct”). On 8 forms, agreement was slightly lower (79% to 89%). These forms tended to be in the range at which students approach or exceeded their VMI performance limit. On one form (#18), raters agreed only 58% of the time. When there was disagreement on this form, one scorer consistently scored the form as correct and the other scored it as incorrect with only one exception. This indicates presence of a consistent bias in how one or both of the scorers were applying the criteria to this form. Despite this, we observed strong inter-rater agreement for the overall scores.
Although the inter-rater correlations were strong, inter-rater reliabilities were slightly lower than reports in the literature.5,18–20 The VMI manual provides objective criteria for scoring each form. However, it also instructs scorers that “it is better to gain a good developmental sense or gestalt for each form’s evolution by studying its developmental trends than it is to focus on the details of reproduction”.5 Our scorers based their scoring solely on the objective criteria, and therefore we expected reliabilities to be comparable to, or better than, results of previous studies that used both the objective scoring criteria and subjective scoring exceptions outlined in the VMI Manual.5 While such exceptions to the objective criteria may improve the validity of the results, they are likely to negatively influence reliability and, in some settings, they may not be possible to implement. For example, with group administration of the test or in instances where the tests are not scored by the individual administering the test, the scorer may not have specific information on the child’s behavior during testing.
Test-retest Reliability
The test-retest reliabilities obtained in the present study (0.58 and 0.54 for standardized scores) are lower than reliabilities reported in previous studies. Test-retest reliabilities were 0.88 for the VMI and 0.84 for the VMIp in a study of 142 public school students between 5 and 12 years of age, with an average inter-test interval of 14 days.5 Test-retest reliability of 0.73 was reported for VMI (5th Edition) tests completed twice with a 7 day inter-test interval by 23 5–17 year old students.19 Our lower test-retest reliabilities may be due in part to the fact that the previous studies had much shorter inter-test intervals than the present study. Using an early version of the VMI and scoring methods, one study examined 602 preschool children at the beginning of their preschool year and 7 months later, and found only moderate test-retest reliability (0.630).22 Our post hoc analyses did support this hypothesis, but only for the VMI: we observed better test-retest reliabilities for students with short (4 weeks or less) inter-test intervals.
Another possible reason for the moderate test-retest reliabilities that we observed may be related to subjective aspects of the scoring criteria that were not used by our scorers. Specifically, the manual notes that “it is common to encounter an older child who somewhat hastily copies the easier forms”, and comments that “an experienced examiner takes such behavior into account in scoring”. Our testers reported that some students rushed through the VMI and VMIp tests (particularly on the retest). The fact that our scorers based their scoring solely on objective criteria for both the VMI and VMIp, and did not take the child’s behavior during testing into account, may have contributed to the lower test-retest reliabilities we observed.
The only previous study in which LOAs were reported was a study by Kulp and Earley in which they administered the VMIp twice within one month to 136 2nd, 4th, and 6th grade children.14 The 95% LOA for raw scores were −3.7 to 4.0 for the overall sample, −4.74 to 5.96 for 2nd graders (n=49), and −2.7 to 2.4 for 4th and 6th graders (n=87). Analysis of VMIp data in the present study yielded wider 95% LOAs (−6.99 to 6.73 for the overall sample, −6.93 to 7.65 for 4th and 6th graders (n=69)). The wider the LOA, the less sensitive an instrument is for detecting change. Test-retest differences for the VMI or for the VMIp did not significantly vary across grade. However, sample sizes were small for some grades (e.g., n=14 for 7th grade), and it is possible that failure to observe an effect of grade may be due to low statistical power.
The present study has some limitations. First, participants were members of the Tohono O’odham Native American Tribe. Previous research has produced conflicting results with regard to racial, cultural, or ethnic differences in VMI scores.5,23–29 The extent to which these differences might impact reliability of scores, and therefore the extent to which our findings can be generalized to other populations, is not known. Second, our scorers limited their scoring to objective assessments of data. It is possible that use of subjective scoring exceptions outlined in the VMI Manual may have increased reliability. For example, it is possible that taking subjective scoring exceptions into account may have modified the test-retest reliability results if some students performed more poorly on the second test due to reduced motivation or cooperation associated with having to repeat the test. Third, the range of inter-test intervals was wide, and may have contributed to the relatively low test-retest reliability results.
In conclusion, the present study lends support to previous inter-rater reliability reports on the VMI and VMIp, suggesting that specificity in scoring instructions can yield high correlation in scoring results across testers. The present study provides an expected range of test-retest scores (95% LOA), which will be useful for determining if the VMI and VMIp have sufficient sensitivity for detecting change in visual perceptual functioning in both clinical and research settings. However, in contrast to previous reports, we observed only moderate test-retest correlations. Further research on test-retest reliability using Bland-Altman methods in other populations and age groups is warranted, particularly if the test is to be used to detect changes due to intervention or treatment.
Acknowledgments
The authors thank the Tohono O’odham Nation, the Baboquivari School District, the Bureau of Indian Affairs Office of Indian Education Programs (BIA OIEP), the San Xavier Mission School, and the parents and children who participated in the study. This study is overseen by an NIH/NEI Data Monitoring and Oversight Committee.
This study was supported by the National Eye Institute/National Institutes of Health (U10-EY13153) and Research to Prevent Blindness.
References
- 1.Atkinson J, Anker S, Nardini M, et al. Infant vision screening predicts failures on motor and cognitive tests up to school age. Strabismus. 2002;10:187–98. doi: 10.1076/stra.10.3.187.8125. [DOI] [PubMed] [Google Scholar]
- 2.Atkinson J, Nardini M, Anker S, et al. Refractive errors in infancy predict reduced performance on the Movement Assessment Battery for Children at 3½ and 5½ years. Dev Med Child Neurol. 2005;47:243–51. doi: 10.1017/s0012162205000472. [DOI] [PubMed] [Google Scholar]
- 3.Roch-Levecq AC, Brody BL, Thomas RG, et al. Ametropia, preschoolers’ cognitive abilities, and effects of spectacle correction. Arch Ophthalmol. 2008;126:252–8. doi: 10.1001/archophthalmol.2007.36. [DOI] [PubMed] [Google Scholar]
- 4.Webber AL, Wood JM, Gole GA, et al. The effect of amblyopia on fine motor skills in children. Invest Ophthalmol Vis Sci. 2008;49:594–603. doi: 10.1167/iovs.07-0869. [DOI] [PubMed] [Google Scholar]
- 5.Beery KE, Beery NA. Beery VMI Administration, Scoring, and Teaching Manual. 6th. San Antonio, TX: NCS Pearson Inc.; 2010. [Google Scholar]
- 6.Bland JM, Altman DG. Statistical methods for assessing agreement between two methods of clinical measurement. Lancet. 1986;327:307–10. [PubMed] [Google Scholar]
- 7.Pryzwansky WB. The use of the Developmental Test of Visual-Motor Integration as a group screening instrument. Psychol Schools. 1977;14:419–22. [Google Scholar]
- 8.Lepkin SR, Pryzwansky WB. Interrater reliability of the original and a revised scoring system for the developmental test of visual-motor integration. Psychol Schools. 1983;30:284–8. [Google Scholar]
- 9.Beery KE. Visual-Motor Integration Monograph. Chicago: Follett; 1967. [Google Scholar]
- 10.Ryckman DB, Rentfrow R, Fargo G, et al. Reliabilities of three tests of form-copying. Percept Motor Skill. 1972;34:917–8. [Google Scholar]
- 11.Snyder PP, Snyder RT, Massong SF. The Visual Motor Integration Test: high interjudge reliability, high potential for diagnostic error. Psychol Schools. 1981;18:55–59. [Google Scholar]
- 12.Friedman R, Fuerth JH, Forsythe AB. A brief screening battery for predicting school achievement at ages seven and nine years. Psychol Schools. 1980;17:340–6. [Google Scholar]
- 13.Kulp MT. Relationship between visual motor integration skill and academic performance in kindergarten through third grade. Optom Vis Sci. 1999;76:159–63. doi: 10.1097/00006324-199903000-00015. [DOI] [PubMed] [Google Scholar]
- 14.Kulp MT, Earley MJ. Repeatability of the VMI Supplemental Developmental Test of Visual Perception. Optom Vis Dev. 2008;39:76–81. [Google Scholar]
- 15.Kulp MT, Sortor JM. Clinical value of the Beery visual-motor integration supplemental tests of visual perception and motor coordination. Optom Vis Sci. 2003;80:312–5. doi: 10.1097/00006324-200304000-00009. [DOI] [PubMed] [Google Scholar]
- 16.Sortor JM, Kulp MT. Are the results of the Beery-Buktenica Developmental Test of Visual-Motor Integration and its subtests related to achievement test scores? Optom Vis Sci. 2003;80:758–63. doi: 10.1097/00006324-200311000-00013. [DOI] [PubMed] [Google Scholar]
- 17.White E, Armstrong BK, Saracci R. Principles of Exposure Measurement in Epidemiology: Collecting, Evaluating, and Improving Measures of Disease Risk Factors. 2nd. Oxford: Oxford University Press; 2008. [Google Scholar]
- 18.Preda C. Test of visual-motor integration: Construct validity in a comparison with the Beery-Buktenica Developmental Test of Visual-Motor Integration. Percept Motor Skill. 1997;84:1439–43. doi: 10.2466/pms.1997.84.3c.1439. [DOI] [PubMed] [Google Scholar]
- 19.Chinner A, Brown T, Stagnitti K. The reliability of two visual motor integration tests used with children. J Occup Ther Schools Early Intervent. 2011;4:129–40. doi: 10.3109/07380577.2010.511441. [DOI] [PubMed] [Google Scholar]
- 20.Volker MA, Lopata C, Vujnovic RK, et al. Comparison of the Bender Gestalt-II and VMI-V in Samples of typical children and children with high functioning autism spectrum disorders. J Psychoeduc Assess. 2010;28:187–200. [Google Scholar]
- 21.McCrimmon AW, Altomare AA, Matchullis RL, Kitlina K. Test Review: The Beery Developmental Test of Visual-Motor Integration (6th ed.) J Psychoeduc Assess. 2012;30:588–92. [Google Scholar]
- 22.Klein AE. The validity of the Beery Test of Visual-Motor Integration in predicting achievement in kindergarten, first, and second grades. Educ Psychol Meas. 1978;38:457–61. [Google Scholar]
- 23.Lim CY, Tan PC, Koh C, et al. Beery-Buktenica Developmental Test of Visual-Motor Integration (Beery-VMI): lessons from exploration of cultural variations in visual-motor integration performance of preschoolers. Child Care Hlth Dev. 2015;41:213–21. doi: 10.1111/cch.12190. [DOI] [PubMed] [Google Scholar]
- 24.Mao H, Li W, Lo J. Construct validity of Beery’s Developmental Test of Visual-Motor Integration for Taiwanese children. Occup Ther J Res. 1999;19:241–57. [Google Scholar]
- 25.Ng M, Chui M, Lin L, et al. Performance of the visual-motor integration of preschool children in Hong Kong. Hong Kong J Occup Th. 2015;25:7–14. [Google Scholar]
- 26.Cui Y, Zhu Y, Laukkanen H, et al. Evaluation of visual-motor integration skills in preschool and elementary school-aged Chinese children. J Behav Optom. 2012;23:123–8. [Google Scholar]
- 27.Martin R, Sewell T, Manni J. Effect of race and social class on preschool performance on the Developmental Test of Visual-Motor Integration. Psychol Schools. 1977;14:466–70. [Google Scholar]
- 28.Schooler DL, Anderson RL. Race differences on the Developmental Test of Visual Motor Integration, the Slosson Intelligence-Test, and the ABC Inventory. Psychol Schools. 1979;16:453–6. [Google Scholar]
- 29.Hopkins S, Sampson GP, Hendicott PL, et al. A visual profile of Queensland Indigenous children. Optom Vis Sci. 2016;93:251–8. doi: 10.1097/OPX.0000000000000797. [DOI] [PubMed] [Google Scholar]