

SUMMARY
Transcription factors play a key role in the development of diverse cancers, and therapeutically targeting them has remained a challenge. In prostate cancer, the gene encoding the transcription factor ERG is recurrently rearranged and plays a critical role in prostate oncogenesis. Here, we identified a series of peptides that interact specifically with the DNA binding domain of ERG. ERG inhibitory peptides and derived peptidomimetics (EIPs) bound ERG with high affinity and specificity, leading to proteolytic degradation of ERG protein. The EIPs attenuated ERG-mediated transcription, chromatin recruitment, protein-protein interactions, cell invasion and proliferation, and tumor growth. Thus, peptidomimetic targeting of transcription factor fusion products may provide a promising therapeutic strategy for prostate cancer as well as other malignancies.
Keywords: peptidomimetic inhibitor, ERG transcription factor, prostate cancer
INTRODUCTION
A majority of prostate cancers harbor recurrent rearrangements of genes encoding the ETS family of transcription factors (Kumar-Sinha et al., 2008; Tomlins et al., 2007; Tomlins et al., 2005). The most common of these rearrangements (~50% of prostate cancers), fuse the androgen-regulated TMPRSS2 promoter to the coding region of ERG (Kumar-Sinha et al., 2008; Tomlins et al., 2008). This rearrangement results in the pathogenic overexpression of an androgen-responsive TMPRSS2:ERG chimeric transcript that encodes a nearly full-length ERG transcription factor. The TMPRSS2:ERG fusion product was shown to drive a unique transcriptional program, induce DNA damage, and drive invasion and metastasis (Brenner et al., 2011; Hermans et al., 2008; Klezovitch et al., 2008; Sun et al., 2008; Tomlins et al., 2008; Wang et al., 2008). Genetically engineered mice expressing androgen-regulated ERG exhibit precursor-like lesions (Carver et al., 2009; King et al., 2009; Klezovitch et al., 2008; Zong et al., 2009), and when aged, develop bona fide invasive prostate cancer (Nguyen et al., 2015). Mice engineered with androgen-regulated ERG in which Pten is disrupted rapidly develop invasive prostate cancer (Carver et al., 2009; King et al., 2009). Importantly, siRNA-mediated knockdown of the TMPRSS2:ERG fusion product inhibited the growth of prostate cancer xenografts that endogenously harbored the fusion, underscoring its importance as a potential therapeutic target (Tomlins et al., 2008; Wang et al., 2008).
Initial therapy for advanced prostate cancer often includes androgen ablation that leads to a reduction in TMPRSS2:ERG expression in tumors harboring the rearrangement; however, androgen resistance develops by a variety of mechanisms, many of which restore androgen signaling and TMPRSS2:ERG expression (Attard et al., 2009). Although a variety of next-generation compounds targeting androgen biosynthesis (de Bono et al., 2011) or androgen receptor (AR) activity (Tran et al., 2009) have shown efficacy in castration-resistant prostate cancer, the tumors invariably develop adaptive mechanisms. The TMPRSS2:ERG gene fusion product is an attractive therapeutic target as it is an oncogenic “driver” in both hormone-naive as well as castration-resistant prostate cancer (Brenner et al., 2011; Helgeson et al., 2008; Hermans et al., 2008; Klezovitch et al., 2008; Sun et al., 2008; Tomlins et al., 2007; Tomlins et al., 2008; Wang et al., 2008). The ERG gene fusion in prostate cancer is also an ideal model to study therapeutic approaches for targeting oncogenic transcription factors broadly. Unlike oncogenic kinases (e.g., BCR-ABL in chronic myeloid leukemia), transcription factors have thus far been considered “undruggable” (Darnell, 2002); thus, screening modalities to discover inhibitory small molecules or peptidomimetics against transcription factors warrant study.
RESULTS
Identification and characterization of ERG binding phage peptides
We initiated an iterative screening of a phage display random peptide library (complexity of 1.28 × 10⁹) to identify peptides that interact specifically with the wild-type ERG protein, but not a negative control protein, beta-glucuronidase (GUS) (Figure 1A). After four rounds of selection, we observed marked enrichment (Figure S1A), and a total of 64 individual phage clones were randomly selected for further screening. DNA sequence analysis revealed that, altogether, the 64 phage clones encoded 12 unique peptides (Figure 1B). To confirm the specificity of the phage clones, we coated ELISA plates with purified ERG or control GUS proteins and visualized the binding of phage with anti-M13 antibody. All 12 unique ERG-selected peptides bound specifically to ERG, while the random peptides did not (Figure 1B). Sequence alignment categorized the 12 ERG binding peptides into three groups (highlighted by different colors), and the most frequent peptide sequences in each group were designated “EIPs” (ERG Inhibitory Peptides).
Figure 1. Identification and characterization of ERG-binding phage peptides.
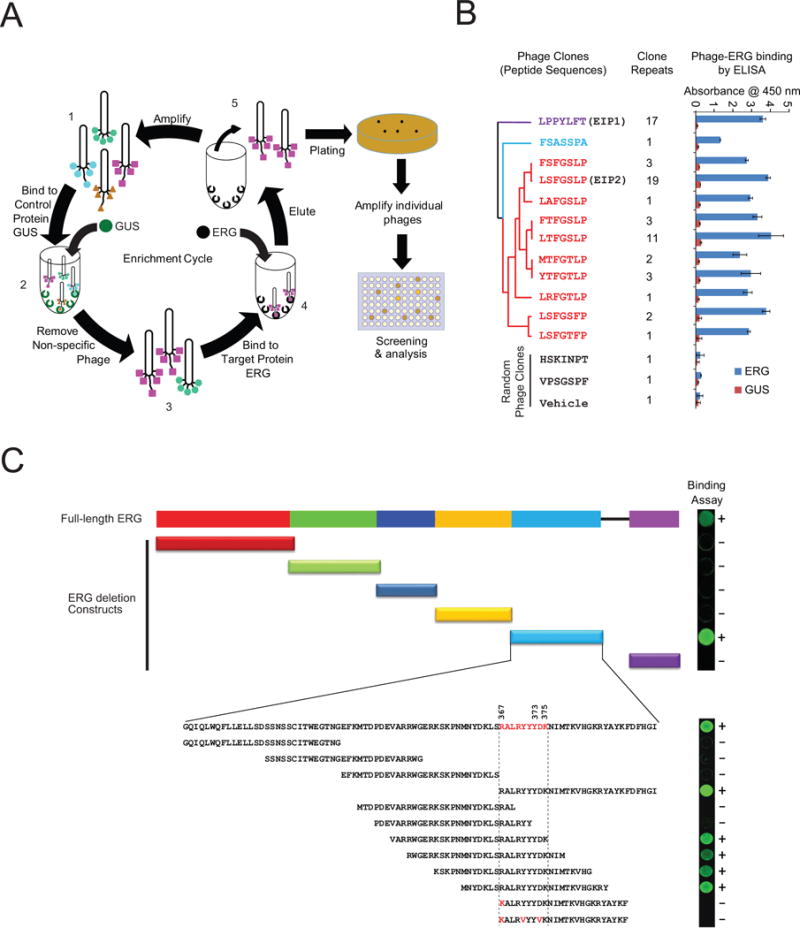
(A) Schematic representation of the phage display workflow to identify ERG-binding peptides. A random seven amino acid phage display library (1) was pre-adsorbed onto purified GUS control protein (2) to remove nonspecific peptides, pre-cleared phage peptides were then enriched for ERG-binding peptides by employing purified recombinant ERG protein as bait (3), bound phage clones were then eluted (4) and propagated (5). After 4 rounds of selection, enriched ERG-binding phage clones were individually cultured and amplified for further analysis. (B) The 12 unique phage peptides were classified into three groups, indicated by different colors, using Clustal Omega (http://www.ebi.ac.uk/Tools/msa/clustalo/). Phage peptide LPPYLFT was designated as EIP1 and LSFGSLP as EIP2. A total of 17 clone repeats were enriched for EIP1 sequence and 19 clones for EIP2 sequence. The phage peptide-ERG interaction was further validated by ELISA. Phage clones randomly selected from the original phage library and phage vehicle (without DNA insert) were used as negative controls. For all experiments, mean ± SEM is shown. (C) Mapping of the phage peptide binding residues to the ERG ETS domain. The images (right) represent images from protein array analysis where positive interactions are indicated by “+” and negative by “−”. See also Figure S1.
The EIP1 (LPPYLFT) series was represented by 17 phage clones, and the amino acid sequence did not significantly match a known protein when aligned to the Swissprot database (BLAST). Interestingly, the EIP2 (LSFGSLP) series was represented by 46 phage clones (highlighted in red) (Figure 1B) and found to be homologous to the SR domain of DLC1 protein, which is encoded by a tumor suppressor gene often deleted in liver, prostate, lung, colorectal, and breast cancers (Liao and Lo, 2008) (Figure S1B).
We next sought to specifically map the interacting residues of ERG, a 479 amino acid protein with two conserved domains pointed (PNT) and the DNA binding (ETS) domains (Klambt, 1993) (Figure 1C). The PNT domain mediates hetero- or homo-dimerization (Carrere et al., 1998) and transcriptional repression (Fenrick et al., 1999). Other domains include the central alternative exons (CAE), central domain (CD), and C-terminal transactivator domain (CTD); however, their functions are less defined (Carrere et al., 1998; Verger et al., 2001). To characterize the peptide binding domain, a total of 6 ERG segments, namely the N-terminus (N-term), PNT, CAE, CD, ETS, and CTD, together with full-length ERG were cloned and expressed by in vitro transcription/translation as HaloTag fusion proteins; GUS was used as control (Figure S1C) and the interactions were detected by HaloLink Arrays (Figure S1D). Both phage clones EIP1 and EIP2 bound strongly to full length ERG as well as the ETS domain, but not to other domains or the control protein (Figure S1D), demonstrating that the ETS domain is the critical region for interaction with phage peptides.
In order to identify the minimal interactive residues in the ETS domain, a panel of 12 tiling fragments spanning the ETS domain (including two fragments with point mutations) were expressed and immobilized on HaloLink Arrays. This allowed us to specifically localize the interaction residues of the phage peptides to a 9 amino acid stretch (RALRYYYDK) (Figure 1C), corresponding to residues 367 to 375 within the ETS domain of ERG. Importantly, a single amino acid substitution of R367K completely abolished the peptide binding, indicating that R367 is a critical residue required for interaction (Figure S1E). Taken together, we postulate that mutations in amino acids 367 to 375 have a profound effect on ERG function.
Synthetic EIPs specifically bind to ERG and disrupt ERG protein-protein interactions in vitro
We next synthesized peptides encoding EIP1, EIP2, and their mutants/scrambled derivatives (Figure 2A) to study their binding specificities to ERG by biolayer interferometry (ForteBio), a label-free biosensor technology that enables the real-time measurement of protein-protein interactions, quantitation, affinity, and kinetics. We determined the binding kinetics of the synthetic peptides and calculated the dissociation constants (Kd) (Figure 2A); Kds for EIP1 and EIP2 were 0.6 μM and 1.8 μM, respectively, while the alanine substitutions (muEIP1 and muEIP2) and the scrambled peptide (Scr) could not be determined (N.D.) as they failed to bind to ERG protein (Figure 2B and 2C). We also determined the binding affinities for other peptides identified in Figure 1B. While most of the peptide sequences bound to ERG, both EIP1 and EIP2 displayed significantly higher affinities (Table S1).
Figure 2. Binding properties of synthetic peptides.
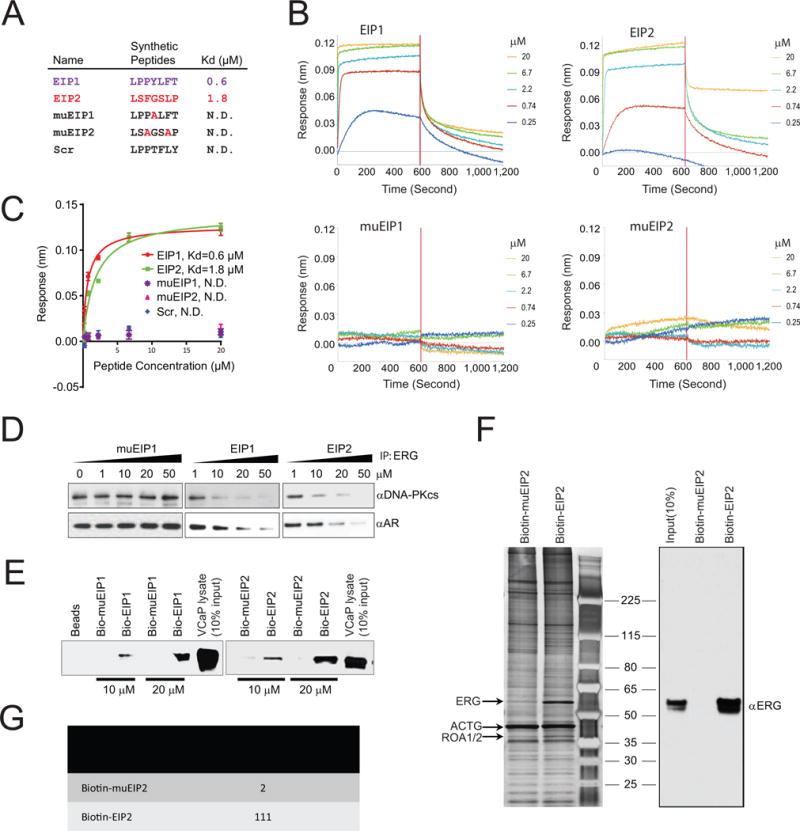
(A) The synthetic peptide sequences and corresponding binding affinity (Kd) as determined by OctetRED biolayer interferometry. Point mutations with alanine substitution and scrambled peptide were used as negative controls where Kd could not be determined (N.D.). (B) Real-time binding was measured by immobilization of biotinylated ERG protein to the streptavidin biosensors and subsequent interactions with varying concentrations of synthetic peptides as indicated. (C) The plots show the response versus peptide concentration curves derived from the raw binding data. Dissociation constants (Kd) represent the peptide concentration yielding half-maximal binding to ERG. For all experiments, mean ± SEM is shown. (D) Halo-tagged ERG protein was expressed by in vitro transcription/translation. Pull-downs followed by immunoblot analysis were performed on mixtures of either Halo-ERG and GST-AR or Halo-ERG and DNA-PKcs in the presence of varying concentrations of peptide, as indicated. (E) Biotin-EIP1/2 or biotin-muEIP was incubated with VCaP cell lysates. Eluates from the pull-downs were subjected to immunoblot analysis using an anti-ERG antibody. (F) Pull-down experiment was performed as in (E) followed by silver staining (left panel) and parallel immunoblot analysis (right panel). (G) Candidate ERG bands identified in (F) were subjected to mass spectrometric analysis. Spectral counts for the ERG peptide, NTGGAAFIFPNTSVYPEATQR, are shown for both biotinylated-EIP2 and muEIP2 pull-downs. All error bars represent ± SEM. See also Figure S2 and Table S1.
We previously demonstrated that the ERG ETS domain interacted with AR and DNA-PKcs proteins in a DNA-independent manner (Brenner et al., 2011; Yu et al., 2010); thus, we tested the ability of EIPs to disrupt the ERG:AR and ERG:DNA-PKcs interactions in a cell-free system. Halo-tagged ERG protein was translated in vitro and incubated with recombinant AR or purified DNA-PKcs in the presence of increasing concentrations of EIP1, EIP2, or muEIP1. HaloLink magnetic beads were then used to pull down ERG followed by immunoblot analysis of AR or DNA-PKcs. Direct ERG:AR and ERG:DNA-PKcs interactions were both disrupted by the ERG binding peptides in a dose-dependent fashion, but not by the control peptide (Figure 2D). To demonstrate EIP binding to endogenous ERG, we synthesized biotinylated EIPs or mutant peptides and incubated them with cell lysates from the TMPRSS2:ERG-positive prostate cancer cell line, VCaP. Pull-downs with streptavidin-linked agarose beads followed by immunoblot analysis showed that biotin-EIP pull-downs were enriched for the TMPRSS2:ERG gene fusion product in a concentration-dependent manner while the mutant pull-downs were not (Figure 2E). The pull-downs were subsequently resolved by SDS-PAGE followed by silver staining that revealed a strong band at a molecular weight of 53 kDa in the biotin-EIP2 lane compared to the biotin-muEIP2 lane (Figure 2F). Mass spectrometry analysis identified the 53 kDa band as ERG with 111 spectral counts for the ERG peptide NTGGAAFIFPNTSVYPEATQR in the biotin-EIP2 pull-downs and only 2 spectral counts in the mutant EIP2 (muEIP2) pull-downs (Figure 2G).
Previously, we demonstrated that the single point mutation Y373A in the ERG ETS domain abrogated the ERG:AR and ERG:DNA-PKcs interactions (Brenner et al., 2011). Here, we investigated the importance of the Y373A mutation in the ERG:EIP interaction. Immunoprecipitation analyses showed that only wild-type ERG (WT_ERG) was pulled down by biotin-conjugated EIP1, but not the mutant version of ERG_Y373A (Figure S2A). In addition, we compared the kinetic binding curves (sensorgrams) of EIP1 on both WT_ERG and the Y373A mutant by OctetRED, and the binding affinities (measured by Kd) are significantly different for WT_ERG and ERG_Y373A (0.6 μM vs >100 μM) (Figure S2B), further confirming the importance of Y373 in ERG:EIPs interaction.
To assess whether EIPs disrupt ERG binding to DNA, we performed an electrophoretic mobility shift assay (EMSA) using VCaP cell extracts and a validated consensus ETS binding sequence (EBS)(Flajollet et al., 2011). While the ERG protein impeded EBS mobility (Figure S2C), addition of EIP1, but not the control peptide, effectively disrupted the ERG:EBS DNA interaction in a dose-dependent manner (Figure S2D). Taken together, our data clearly demonstrate that, in a cellular context, the effects of EIPs on disruption of ERG function occur by blocking ERG:DNA and/or critical ERG:protein interactions.
Cell permeable EIPs co-localize with ERG protein and block ERG-mediated cell invasion
We next determined whether the synthetic peptides could inhibit ERG-mediated oncogenic phenotypes in a panel of prostate cell lines. We synthesized cell-permeable peptides by conjugating the EIPs with the cationic HIV-TAT motif RKKRRQRRR to facilitate uptake into the cells (Wadia and Dowdy, 2005) (Figure 3A). Importantly, conjugating the TAT sequence to EIPs did not compromise the binding affinities to ERG; Kd values were 0.68 μM and 1.11 μM for TAT-EIP1 and TAT-EIP2, respectively (Figure 3B), and not calculable for the controls (Figure S3A). To further confirm binding specificity, we designed a series of alanine substitution peptides based on the parental TAT-EIP1 sequence and measured the Kd value for each peptide using OctetRED (Figure S3B). Our data showed >100-fold increase in Kd for either P2→A or Y→A substitution, while L5→A displayed non-specific binding (Figure S3C).
Figure 3. Cell-permeable EIPs block ERG-mediated cell invasion.
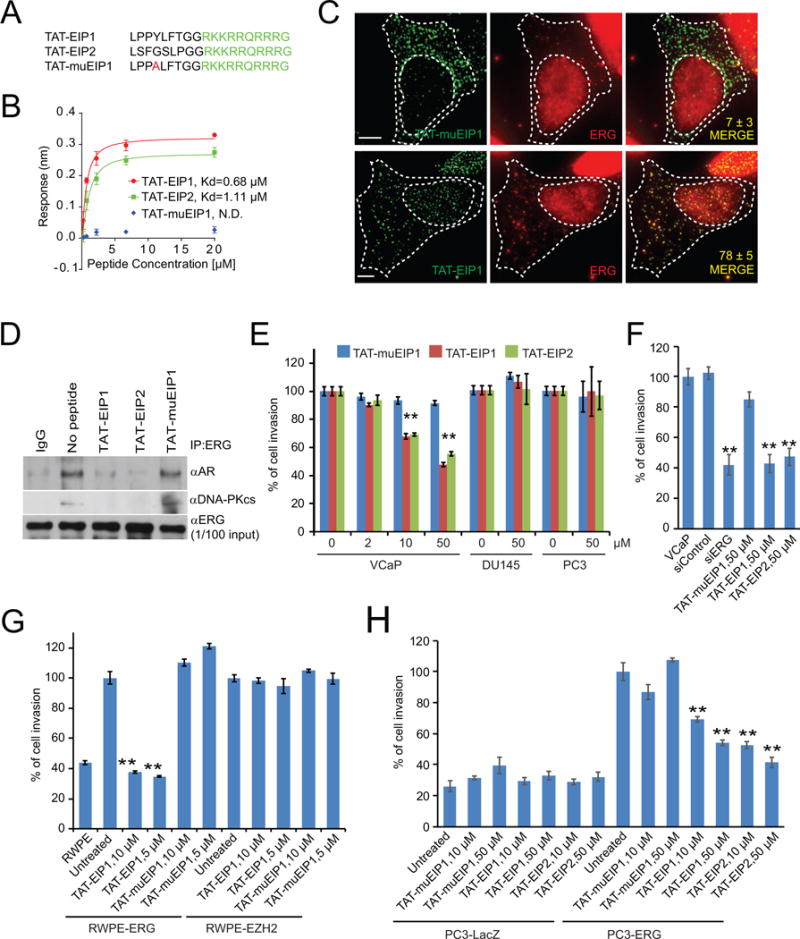
(A) Sequences of TAT (shown in green) conjugated peptides. (B) Kinetic binding data for TAT-EIPs and ERG. (C) Representative pseudocolored images of VCaP cells treated with FITC-labeled (green, left) control peptide muEIP1 (top panels) or EIP1 (bottom panels) and stained for ERG (red, middle). Overlay of red and green channels are represented in the “Merge” panel. Values in each “Merge” image depict the extent of green-red colocalization in the nucleus, wherein a value of ‘0’ represents no colocalization and value of ‘100’ represents complete colocalization. The colocalization numbers are represented by mean ±SEM. Scale bar, 5 μm (n >20 cells). (D) IP-immunoblot analysis of VCaP cells treated with either TAT-EIPs or -muEIP1, or untreated. Cell lysates (1/100 IP input) were used as positive controls. (E–H) Boyden chamber transwell invasion assays of VCaP, DU145 and PC3 (E), VCaP (F), RWPE-ERG and –EZH2 (G), PC3-LacZ and –ERG (H) were performed in chambers pre-coated with Matrigel. Cells were pretreated as indicated for 48 hours and allowed to incubate for an additional 48 hours prior to fixation, imaging, and quantification of cell invasion. The data shown are the mean of three independent experiments. All error bars represent ± SEM. **p< 0.05. See also Figure S3.
Because TAT also functions as a nuclear localization signal (Efthymiadis et al., 1998), it is well suited for the delivery of transcription factor inhibitors. Immunofluorescence confocal microscopy showed that FITC-labeled TAT-EIP1 clearly entered VCaP cells, while EIP1 without the TAT motif did not penetrate the cell membrane (Figure S3D). To further examine the ERG:EIP interaction in situ, we performed an immunofluorescence co-localization assay in VCaP cells using the FITC-labeled peptides and an ERG antibody. We first stained a PC3 cell line stably overexpressing ERG protein with the ERG antibody and found that ERG displayed strong nuclear and weak cytoplasmic signals (Figure S3E), similar to the cellular localization pattern described in the Human Protein Atlas (HPA) project (www.proteinatlas.org); parental PC3 cells lacking ERG did not display any significant signal. In VCaP cells, we found that EIPs extensively co-localized with ERG in both cellular compartments, whereas the control peptide, muEIP, was predominantly cytoplasmic and did not overlap with ERG signal (Figure 3C). The extent of green-red co-localization in the nucleus was significantly different, with 78±5 percent for EIP1 and 7±3 percent for the control peptide. In concordance with the cell-free system (Figure 2D), IP-Western blot analysis showed that TAT-EIP1/2 significantly blocked the ERG:AR and ERG:DNA-PKcs interactions in VCaP cells, whereas the mutant peptide had no effect (Figure 3D).
Next, we tested whether TAT-EIPs could attenuate tumor cell invasion in modified Boyden chamber assays. Addition of TAT-EIP1/2 significantly inhibited VCaP cell invasion comparable to the levels achieved by ERG-siRNA (Figure 3E–F) while they had no effect on ETS gene fusion-negative prostate cancer cell lines, DU145 and PC3 (Figure 3E). We previously developed two RWPE-1 cell lines stably overexpressing either ERG or EZH2 that are highly invasive compared to parental RWPE-1 or RWPE1-LacZ cells (Figure S3F–G) (Cao et al., 2008; Tomlins et al., 2008). Addition of TAT-EIP1/2 significantly attenuated invasion of RWPE1-ERG, but not RWPE1-EZH2, cells; control peptides had no effect on either cell line (Figure 3G). Likewise, TAT-EIP1/2 inhibited PC3 cell invasion driven by overexpression of ERG, but not the PC3-LacZ control cells (Figure 3H, Figure S3H–I). Together, our data demonstrate that TAT-EIPs are able to specifically block ERG-induced cell invasion.
Retroinverso EIPs (RI-EIPs) specifically bind to and destabilize ERG
To test the EIPs in in vivo models, we designed a retroinverso version of the peptides. A retroinverso peptide is made up of D-amino acids in a reversed sequence and has a side-chain topology similar to that of its parent molecule but with inverted amide peptide bonds. In contrast to L-amino acids, retroinverso peptides were shown to enhance the biological activity in xenograft models as these peptides retain similar structural configuration of their parent molecules but are resistant to cleavage by serum or cellular proteases (Cerchietti et al., 2009; Snyder et al., 2004). We tested whether retroinverso peptidomimetics (RI-EIPs) (Figure 4A) are structurally stable and retain specific ERG inhibitory properties of the parental L-amino acid peptides. A kinetic binding assay by biolayer interferometry revealed that RI-EIPs have similar binding affinities as TAT-EIPs with 0.94 μM and 1.28 μM for RI-EIP1 and RI-EIP2, respectively; Kds were not calculable for the control peptides (Figure 4B; Figure S4A).
Figure 4. Retroinverso EIPs specifically bind to and destabilize ERG.

(A) Sequences of the retroinverso peptidomimetics; except glycine, all amino acids are D-isomer. TAT sequences are shown in green. (B) The kinetic binding curve for RI-EIPs as measured by OctetRED, as in Figure 2C. The data shown are the mean of three independent experiments. (C, D) Confluence rates of VCaP (C) or DU145 (D) cells treated as indicated were measured by IncuCyte. (E) Comparison of cell morphology of VCaP and DU145, untreated or treated with 50 μM of indicated peptide for four days. (F) Evaluation of RI-EIPs target engagement in VCaP cells after the treatment of RI-EIP1 for three hours was analyzed over temperature shift from 42°C to the indicated temperatures. The presence of the target ERG protein in the soluble fraction of the cell lysates was detected by Western blot analysis. (G) Isothermal dose-response fingerprint at 50°C in VCaP cells shows levels of soluble ERG protein at varying concentrations of RI-EIPs. (H, I) Immunoblot analysis of ERG, AR, and GAPDH from VCaP cells treated with RI-EIP1 or RI-muEIP1 with 20 μM at indicated time points (H) and for 48 hr at indicated concentrations (I). (J) Immunoblot analysis of ERG and GAPDH from VCaP cells treated with or without RI-EIP1. Where indicated, 50 μg/ml cycloheximide (CHX) was added, and cells were harvested at the indicated time points. (K) ERG protein abundance in (J) was quantified by ImageJ and plotted as indicated. (L) Immunoblot analysis of ERG, AR, and GAPDH from VCaP cells treated with 20 μM RI-EIP1 or RI-muEIP1 for 48 hours with and without proteasome inhibitor carfilzomib (100 nM). (M) The degradation analysis of 3020 proteins as mean ratio from three replicates of each protein, represented by a black spot (n = 3). The y axis represents p value (−log10 transformed) derived from t test across three biological replicates for each protein compared with the biological replicates of negative control proteins. The relative fold change is shown on the × axis as the log10 ratio RI-EIP1/RI-muEIP1. Proteins with a p<0.01 and a fold change <−1.5 are overlaid by the blue box. The top most degraded proteins are labeled by arrows. All error bars represent ± SEM. See also Figure S4.
We then evaluated the effect of RI-EIPs on cell invasion. Similar to TAT-EIPs, the peptidomimetics also blocked ERG-driven cell invasion in RWPE-1 cells (Figure S4B) and inhibited cell invasion in VCaP (Figure S4C). To determine the effect of RI-EIPs on cell proliferation, we measured VCaP cell viability by CellTiter-Glo assay at different time points in the presence of various doses of the peptidomimetics. Starting at day five, both RI-EIP1 and RI-EIP2 demonstrated an inhibitory effect on cell proliferation at a dosage of 10 μM and above, while RI-muEIP1 had no effect (Figure S4D). Further, the RI-EIPs significantly decreased the confluence rate of VCaP cells (ERG fusion positive) but not DU145 cells (ERG fusion negative), as measured by IncuCyte in a dose-dependent fashion (Figure 4C–E, Figure S4E). Importantly, the confluence rate of VCaP cells cultured in charcoal-stripped media (without androgen) was also remarkably inhibited by RI-EIPs treatment in a dose-dependent fashion as compared to the control peptide (Figure S4F).
We next determined whether RI-EIPs inhibit ERG-associated protein-protein interactions and found that treatment of VCaP cells with RI-EIPs disrupted both ERG:AR and ERG:DNA-PKcs interactions (Figure S4G–H). The cellular thermal shift assay (CETSA) has been used to monitor drug target specificity as well as dose-dependent target engagement in cells and tissues (Martinez Molina et al., 2013). We applied this technique to evaluate the target binding specificity of RI-EIPs. We first tested olaparib, a PARP-1 inhibitor that, as expected, induced the thermal shift of PARP-1 target protein in VCaP cells (Figure S4I). Likewise, treatment of VCaP cells with both RI-EIPs significantly increased the levels of soluble ERG protein even at 50°C (Figure 4F, Figure S4J), while most ERG protein precipitated at 48°C in both untreated and RI-muEIP1 treated VCaP cells (Figure S4K), clearly demonstrating the direct binding of RI-EIPs and ERG protein. Importantly, the RI-EIP1-induced solubility of ERG protein was increased in a dose-dependent fashion as determined by the isothermal dose-response procedure (Martinez Molina et al., 2013) (Figure 4G). All CETSAs were performed after 3 hours of treatment with the peptidomimetics at the indicated doses and temperatures.
We further investigated the effects of RI-EIPs on ERG and AR proteins in cells at different time points. Surprisingly, the treatment of VCaP cells with both RI-EIP1 and RI-EIP2 significantly destabilized the ERG target protein starting at 24 hr post-treatment in a dose-dependent manner, while control RI-muEIPs had no effect (Figure 4H–I; Figure S4L–M). This was also the case for the native peptides, where TAT-EIPs degraded the ERG protein, but not the control peptide (Figure S4N). In the presence of cycloheximide (CHX), a protein synthesis inhibitor, RI-EIP1 significantly shortened the ERG protein half-life (Figure 4J–K), and degradation was seen as early as three hours. Interestingly, degradation of ERG protein was completely inhibited by carfilzomib (Figure 4L), a proteasome inhibitor, indicating involvement of proteasome-mediated proteolysis. We confirmed these findings in two isogenic cell models, RWPE1-ERG and PC3-ERG cells. Similar to VCaP cells, both RI-EIP1 and RI-EIP2 destabilized the ERG proteins even at 5 μM concentration (Figure S4O–P), consistent with earlier findings. To study the global effects of peptidomimetic treatment, we carried out unbiased proteomic analysis of VCaP cells by mass spectrometry after 48 hours of incubation with either RI-EIP1 or control peptides. Of 3020 proteins identified from mass spectrometry, ERG was one of the top-ranked candidates most significantly depleted upon peptidomimetic treatment (p < 0.01) (Figure 4M).
RI-EIPs specifically inhibit ERG binding to target loci and inhibit ERG transcriptional activity
In a cellular context, our data showed that EIPs blocked ERG binding to DNA (Figure S2F) as well as disrupted ERG:DNA-PKcs interaction (Figure 3D). We, therefore, performed chromatin immunoprecipitation (ChIP) assays in VCaP cells to assess whether peptide treatment could block endogenous ERG recruitment to chromatin. These experiments clearly demonstrated that RI-EIP1, but not a mutant peptide, inhibited ERG and DNA-PKcs enrichment at ERG-regulated genomic loci (Figure S5A), supporting the hypothesis that EIPs specifically block the recruitment of ERG and its co-factors, such as DNA-PKcs, to ERG-targeted genomic loci.
We then assessed the unbiased genome-wide recruitment of ERG by chromatin immunoprecipitation coupled with high-throughput sequencing (ChIP-seq) utilizing ERG antibody in VCaP cells (Asangani et al., 2014; Chen et al., 2013; Chng et al., 2012; Nguyen et al., 2015; Yu et al., 2010). The ERG proteins precipitated by antibodies were first confirmed to be at equal amounts by immunoblot (Figure S5B), thus excluding the effects of ERG protein degradation induced by EIPs. Over 97% of the most significant peaks (4th quartile) identified in RI-muEIP1-treated VCaP cells overlapped with untreated VCaP cells. Importantly, the average ChIP-seq signal for these 4th quartile peaks were markedly reduced in RI-EIP1-treated cells compared to mutant peptide (Figure 5A–B), indicating the inhibition of ERG binding at target loci upon RI-EIP treatment. Examples of gene tracks for ERG-associated genomic regions and the effects upon peptide treatments on ERG enrichment are shown in Figure 5C.
Figure 5. Retroinverso EIPs specifically inhibit ERG binding to target loci, disrupting ERG transcriptional activity.
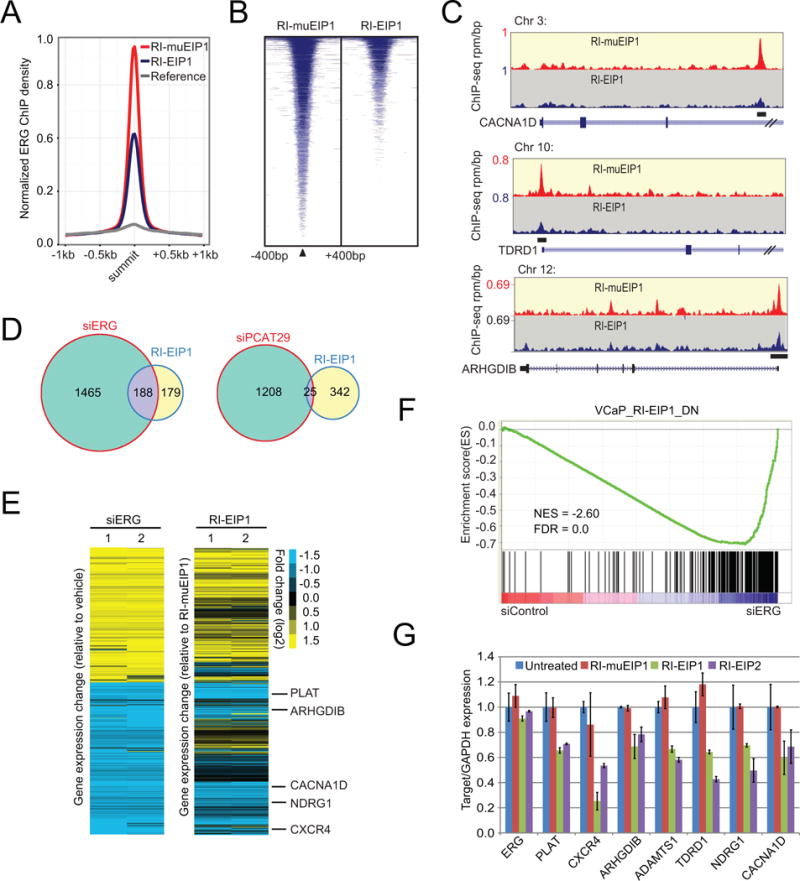
(A) ChIP-seq using the ERG antibody was performed in VCaP cells treated with 50 μM RI-EIP1 or RI-muEIP1 for 12 hours. Normalized ERG signal profiles for RI-EIP and RI-muEIP1 treated groups were calculated at the summit of the most significant ERG peaks (4th quartile) in the RI-muEIP1 sample. (B) Heatmap representation of ERG binding peaks in both RI-EIP1 and RI-muEIPs treatment groups. Genomic target regions are rank-ordered based on the level of ERG enrichment at each ERG binding sites between −400bp and +400bp flanking genomic region. (C) Representative ChIP-seq profile at ERG target gene loci. The y-axis denotes reads per million per base pair (rpm/bp); x-axis denotes the genomic position. (D) Venn diagram illustrating the overlap of disregulated genes (greater than 2-fold, FDR<0.01) between siERG- and RI-EIP1-treated VCaP cells and between siPCAT29- and RI-EIP1-treated VCaP cells. (E) Heatmap from microarray analysis of ERG knockdown by siERG or RI-EIP1 treatment in VCaP cells, comparing gene expression changes upon siERG knockdown and RI-EIP1 treatment. (F) Gene Set Enrichment Analysis (GSEA) of the down-regulated genes (VCAP_RI-EIP1_DN) by RI-EIP1 versus ERG knockdown in VCaP cells. NES, normalized enrichment score; FDR, false discovery rate. (G) The relative expression of several ERG target genes in VCaP upon RI-EIP1 treatment assessed by quantitative PCR. For all experiments, mean ± SEM is shown. See also Figure S5.
We next examined the changes in global gene expression profiles upon siERG or RI-EIPs treatment by microarray analysis on VCaP cells. We evaluated alterations in the ERG-regulated genes by siERG upon RI-EIP1 or RI-muEIP1 treatment (selection criteria greater than 2-fold, FDR<0.01). ERG protein was first assessed to be at equal amounts after the peptide treatment (Figure S5C). There was significant overlap of the dysregulated genes between siERG- and RI-EIP1/2-treated VCaP cells, as well as between RI-EIP1 and RI-EIP2-treated VCaP cells (p<0.001) (Figure 5D; Figure S5D–E). Previously, we identified a series of prostate cancer-specific long noncoding RNAs (PCATs) (Prensner et al., 2011); one lncRNA, PCAT29, is an androgen-regulated lncRNA that functions as a tumor suppressor in prostate cancer (Malik et al., 2014). To assess specificity of results with RI-EIP1 treatment, we knocked down PCAT29 by siRNA. This also resulted in significant alteration of global gene expression, but very few regulated genes were shared between siPCAT29- and RI-EIP1-treated VCaP cells (Figure 5D). A heat map view demonstrated substantial similarities in the gene expression profiles for both siERG- and RI-EIP1/2-treated cells, indicating RI-EIP1/2 treatment attenuates ERG-mediated transcriptional activities (Figure 5E; Figure S5F). Importantly, we performed a gene array analysis in PC3 cells (ERG negative line) and found no significant changes in gene expression after RI-EIP1 treatment by applying the same criteria (greater than 2-fold, FDR<0.01) (Figure S5G–H), clearly demonstrating that the significant genes suppressed by RI-EIPs in VCaP cells (an ERG positive line) are indeed relevant to the ERG-mediated pathway. Gene Set Enrichment Analysis (GSEA) of down-regulated genes in RI-EIP1-treated cells were also negatively enriched in siERG VCaP cells (FDR<0.01) (Figure 5F), suggesting that RI-EIP treatment has a direct effect on ERG-mediated transcription in VCaP cells.
To validate the microarray data, we selected several down-regulated genes that harbor multiple ETS binding sites in their promoter region (Figure 5C) and measured their expression following peptide treatment. Consistent with the microarray data, quantitative RT-PCR results showed target gene expression was reduced in peptide-treated cells relative to controls (Figure 5G). Collectively, these data suggest that the retroinverso peptidomimetics have similar effects as siERG knockdown in VCaP cells.
RI-EIPs have no effects on ERG-mediated angiogenesis
We first determined whether RI-EIP affects normal ERG function. Interestingly, pull-down experiments using whole cell lysates of VCaP, human endothelial cells (HUVEC), or mouse endothelial cells (MS1), all of which express high levels of ERG, revealed that the EIPs preferentially bound to pathogenic, over-expressed ERG fusion products in cancer cells over wild-type ERG expressed in human or murine endothelial cells (Figure 6A). Using cell lysates normalized for ERG levels (Figure S6A), pull-down experiments showed that biotinylated EIP1 bound more efficiently to VCaP ERG than HUVEC ERG (0.25 mg/ml vs 8 mg/ml) (Figure 6B). Furthermore, while CETSA demonstrated that RI-EIP1 binds to and increases the thermal shift of ERG fusion protein in VCaP cells (Figure 4F), there was no clear thermal shift in the soluble ERG protein in HUVEC cells (Figure S6B).
Figure 6. RI-EIPS have no effects on ERG-mediated angiogenesis.
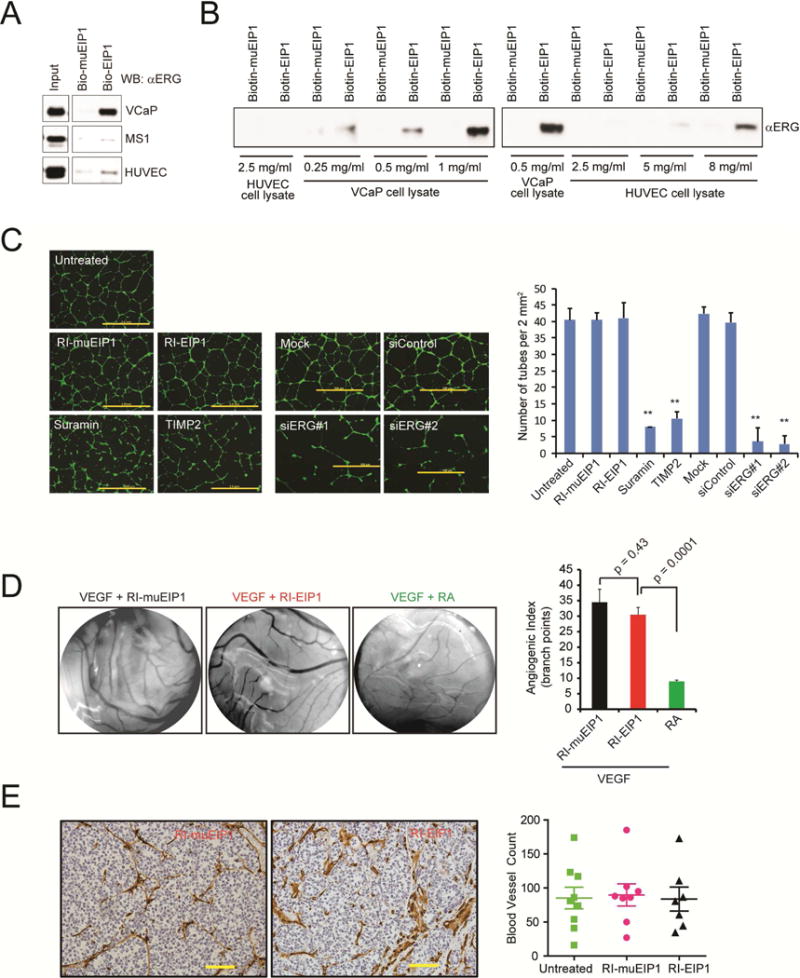
(A) Biotin-EIP1 or biotin-muEIP was incubated with the cell lysates and eluates from the pull-downs were subjected to immunoblot analysis using an anti-ERG antibody. (B) Pulldown assay as in (A) with varying amounts of cell lysates as indicated. (C) Representative microphotographs of a 3D culture of human umbilical vein endothelial cells (HUVEC) (scale bar, 2.0 m) in the presence of inhibitors or siRNA as indicated. The bar graphs present the number of tubes/area of cells analyzed by ImageJ software. The average lengths were calculated for each transductant from microphotographs captured in duplicate experiments performed. (D) Effect of RI-peptides or retinoic acid (RA, a known inhibitor of angiogenesis) on VEGF-induced angiogenesis assessed by chorioallantoic membrane assay. The bar graphs represent the angiogenic index by counting vessel branch points using ImageJ software in a double-blinded manner. Data represents the mean of 4 replicates. (E) A representative immunohistochemistry (IHC) image of mouse CD31, an endothelial cell marker in FFPE sections of VCaP xenograft tumors treated with RI-muEIP1 or RI-EIP1 for 24 consecutive days. Scale bar: 10 μm. The dot plots represent the quantitative data of IHC staining. Number of blood vessels was determined in a view area at 200× magnification. Error bars represent ± SEM. **p value < 0.05.
We next evaluated the effects of peptidomimetic treatment on ERG-regulated biological processes (Birdsey et al., 2008; McLaughlin et al., 2001), such as endothelial tube formation and angiogenesis. RI-EIP1 treatment at 10 μM did not have a significant effect on either HUVEC or MS1 cell tube formation compared to ERG knockdown in HUVEC cells (Figure 6C; Figure S6C–E). Further, RI-EIP1 treatment did not alter angiogenesis in vivo as assessed by chorioallantoic membrane (CAM) angiogenesis assays (Figure 6D) or by scoring the number of CD31+ vessels in FFPE sections of VCaP xenograft tumors (Figure 6E). Collectively, these data indicate that RI-EIPs preferentially target ERG fusion products and their downstream activities.
Retroinverso EIPs suppress tumor growth in vivo
To assess the basic pharmacokinetic and pharmacodynamic properties of RI-EIP1 in vivo, we first tested the permeability and stability of the peptidomimetic upon intraperitoneal (IP) administration in mice. VCaP xenografted mice were injected with a single dose of 25 mg/kg biotinylated RI-EIP1 and serum and tumors were collected at varying time intervals, as indicated. Results showed that serum peptide levels reached a peak at 30 minutes after IP injection (Figure S7A) and were still detectable in the serum up to 24 hr post-injection. Co-immunoprecipitation followed by immunoblot analysis demonstrated that a single 25 mg/kg dose of RI-EIP1 blocked the ERG:DNA-PKcs interaction at three and six hours post RI-EIP1 injection (Figure S7B).
Next, we tested RI-EIP1 in ERG-mediated invasion and metastasis in vivo using two established models. We implanted TMPRSS2:ERG-positive VCaP cells onto the upper chorioallantoic membrane (CAM) of a fertilized chicken embryo and analyzed the relative number of cells that invade and intravasate into the vasculature of the lower CAM after treatment with the RI-EIPs (Kim et al., 1998). RI-EIP1 blocked both ERG-mediated invasion and intravasation (Figure 7A–B). We harvested the lungs and measured the number of metastasized VCaP cells; as shown in Figure 7C, RI-EIP1 treatment significantly reduced lung metastases from VCaP tumors, demonstrating the efficacy and in vivo significance of RI-EIPs.
Figure 7. Retroinverso EIPs suppress tumor growth in vivo.
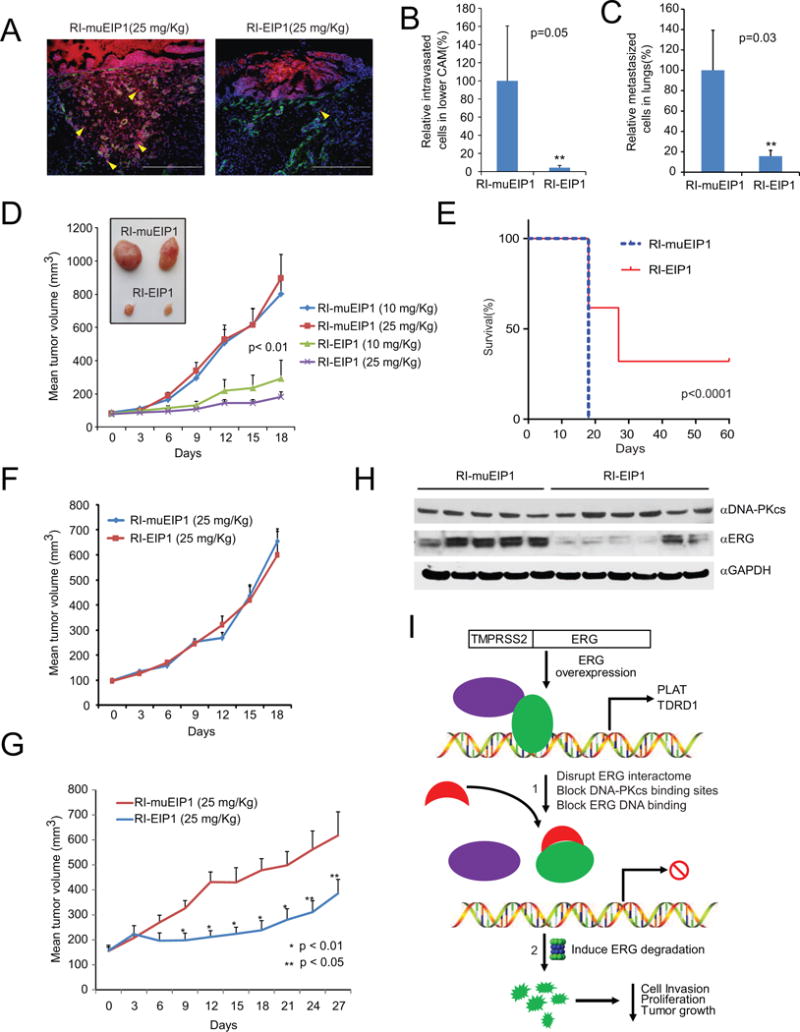
(A) Chicken chorioallantoic membrane (CAM) invasion assays were performed using VCaP cells that stably overexpress Cherry Red (red fluorescence emission). The xenografts were treated with a single dose of RI-EIP1 or RI-muEIP1 at 25 mg/kg. At 72 hours post-treatment, the upper CAM was harvested and the frozen sections were stained for chicken-specific type IV collagen (green fluorescence). Yellow arrowheads indicate invaded cells through the upper CAM. White dotted line indicates CAM basement membrane. Scale bar: 200 μm. (B, C) CAM intravasation (B) and lung metastasis (C) assays were performed on VCaP CAM xenografts. Total cell number was determined using a standard curve generated by varying amounts of VCaP cells as input. Y-axis shows the relative cell numbers normalized by RI-muEIP1-treated CAM group. **p<0.05. (D) VCaP-xenografted mice were treated with RI-EIP1 or RI-muEIP1 at indicated doses for 18 consecutive days. Average tumor volume (in mm3) was measured by Caliper every three days. Inset shows the representative VCaP tumors treated by RI-EIP1 or RI-muEIP1. (E) Kaplan–Meier survival data plotted as percent of animals surviving in each group using a predefined cutoff tumor volume of 1,500 mm3. (F) PC3-xenografts mice were treated with 25 mg/kg RI-EIP1 or RI-muEIP1, and average tumor volume was calculated as in (D). (G) An ETV1-positive human primary prostate cancer serial xenograft was treated as in (D). (H) Immunoblot analysis of ERG, DNA-PKcs, and GAPDH in VCaP xenograft tumors treated with 25 mg/kg RI-EIP1 or RI-muEIP1 24 hours after the final treatment in (D). (I) Schematic depicting the mechanisms of EIPs therapeutically targeting TMPRSS2:ERG fusion products in prostate cancer. 1. In cells, EIPs immediately bind to ERG upon addition of the peptides, inducing a conformational change in the ERG protein, consequently blocking its interaction with co-factors and attenuating DNA binding. 2. In this disrupted state, the ERG protein is targeted for proteolytic degradation, thereby inhibiting cell invasion, proliferation, and tumor growth in vivo. For all experiments, mean ± SEM is shown. See also Figure S6.
We implanted VCaP (ERG fusion-positive) or PC3 (ERG fusion-negative) cells in male athymic nude mice and studied the effect of RI-EIP1 on tumor growth. We first investigated the effects of EIPs on ERG protein degradation in the in vivo model at early time points. The VCaP-xenografted mice were treated with 25 mg/kg RI-EIP1 or RI-muEIP1 daily for five days. The tumors were then collected at day seven, and immunoblot analysis showed that RI-EIP1 was able to degrade ERG protein, while control peptide had no effect (Figure S7C). Mice with palpable tumors were randomized to receive either 25 mg/kg per day (n=10) or 10 mg/kg (n=10) of the retroinverso peptidomimetics. We observed a dose-dependent reduction of VCaP tumor growth in RI-EIP1-treated mice relative to those treated with mutant peptide at day 18 (Figure 7D). Among the high dosage group (25 mg/kg RI-EIP1), 10% (2/20) of the tumors had completely regressed with no palpable tumor at day 18 (Figure S7D). We continued to treat the group with RI-EIP1 over an extended period of time and found that 35% (7/20) of the tumors showed no signs of recurrence at day 30. These mice were then maintained for an additional 30 days without therapy and no recurrences were observed (Figure 7E). We performed additional VCaP xenograft studies using varying doses of RI-EIP1 (1 mg/kg, 5 mg/kg, and 25 mg/kg), and significant suppression of tumor growth was observed at 25 mg/kg dose relative to control (Figure S7E). RI-EIP2-treated VCaP xenografts also significantly delayed tumor growth at 20 mg/kg dose (Figure S7F), consistent with biochemical and in vitro studies. Importantly, the effect of RI-EIP1 was specific to ETS-positive xenografts as no difference in tumor size was observed for PC3 xenografts treated with RI-EIP1 compared to mutant peptidomimetic (Figure 7F). Peptidomimetics at doses up to 25 mg/kg did not significantly affect body weight (Figure S7G) or markers of liver toxicity, as measured by serum aspartate aminotransferase (AST) and alanine aminotransferase (ALT) levels (Figure S7H).
Given the magnitude of the effects of EIPs on the TMPRSS2:ERG-harboring tumors, we extended the study to ETV1-positive cancers. Sequence alignment showed high homology in the ETS domains of both ERG and ETV1, particularly in the EIP binding region (Figure S7I). In vitro assays demonstrated that the biotinylated EIP pulled down endogenous ETV1 from LNCaP cells (TMPRSS2:ETV1 rearranged prostate adenocarcinoma cells) in a dose-dependent manner (Figure S7J). Further, the RI-EIPs, but not mutant peptides, significantly decreased the confluence rate of LNCaP cell growth (Figure S7K) and attenuated LNCaP cell invasion in a dose-dependent fashion (Figure S7L). Treatment of LNCaP cells with RI-EIP1 or RI-EIP2 significantly destabilized ETV1 protein at 48 hours post-treatment in a dose dependent manner, while control RI-muEIPs had no effect (Figure S7M). We next tested RI-EIP1 in an ETV1-positive, primary human prostate cancer (MDA-PCa-2b-T, FISH confirmed (Tomlins et al., 2007)) propagated in serial xenografts. RI-EIP1 treatment significantly reduced tumor volume, demonstrating that EIPs have potential to broadly treat ETS fusion-positive tumors (Figure 7G).
We next performed IP-Western blot analysis using tumor lysates from VCaP cell xenografts harvested after 18 days treatment (Figure 7D) and found degradation of ERG protein in RI-EIP1-treated xenografts compared to those treated with mutant peptide (Figure 7H). Furthermore, qPCR analysis of 26 VCaP tumors demonstrated that RI-EIP1 treatment inhibited the expression of ERG target genes, such as TDRD1, ARHGDIB, NDRG1, and CACNA1D, but not TMPRSS2:ERG itself (Figure S7N), demonstrating that pharmacological doses can be achieved in vivo to disrupt ERG function.
DISCUSSION
The development of molecularly-targeted therapies has been one of the primary goals of medicine for many decades. While some strides have been made targeting kinases with small molecules, there are few examples of therapies that have had clinical success by specifically targeting transcription factors (Darnell, 2002; Yan and Higgins, 2013). While the pathogenesis of some diseases, such as CML, requires the activation of kinases like BCR-ABL1, many diseases arise following abnormal expression of transcription factor activity (Lee and Young, 2013). As such, the development of methodologies that enable the discovery of tools to generate clinically-relevant molecules that target transcription factors is of paramount importance.
Of the many diseases driven by dysregulation of transcription factors, prostate cancer is one of the most prevalent, with approximately 50% of cases containing somatic translocations or deletions that link the TMPRSS2 promoter and 5′-UTR to the coding region of an ETS transcription factor, most frequently ERG (Kumar-Sinha et al., 2008). The rearrangement, which results in encoding a nearly full-length ERG transcription factor, has been shown to drive a unique transcriptional program as well as drive invasion and metastasis (Tomlins et al., 2008). As such, the TMPRSS2:ERG gene fusion product is an important target in both hormone-naive as well as advanced, androgen-independent prostate cancer, and, as a prototypical oncogenic transcription factor, represents an excellent model for the study of therapeutic approaches to target transcription factors (Brenner et al., 2011; Tomlins et al., 2007; Tomlins et al., 2008).
While our current studies focus on ETS transcription factors that function as oncogenic “drivers” in prostate cancers and other malignancies (Jeon et al., 1995; Oikawa and Yamada, 2003; Shurtleff et al., 1995; Sorensen et al., 1994), many transcription factors, most notably MYC, have been implicated in cancer (Albihn et al., 2010; Vafa et al., 2002). However, direct targeting of these transcription factors has historically proven to be a formidable challenge (Koehler, 2010), and proteins in this class are often considered “undruggable”. Here, we present an approach to disrupt the oncogenic program of the transcription factor ERG using inhibitory peptidomimetics. Our successful development of transcription factor inhibitors, which preferentially target tumors addicted to ERG signaling, may suggest a tactic for treating these tumors.
The CETSA assay and biotinylated EIP pulldown experiments clearly show that the EIPs directly bind ERG within minutes/hours. In the presence of a protein synthesis inhibitor, cycloheximide (CHX), ERG protein starts to be degraded within three hours. At this stage, we observed disruption of protein-protein interactions as well as the attenuation of ERG:DNA binding in VCaP cells upon treatment with EIPs. At 24 hours, robust ERG protein degradation was observed (even in the absence of CHX), and after approximately 48 hours, phenotypic effects such as decreased cell invasion and proliferation were also observed (model integrating these findings is depicted in Figure 7I). Importantly, these effects translated to a decrease in tumor growth for both ERG- and ETV1-positive xenografts treated with RI-EIPs.
While EIPs appear to be specific, off-target effects cannot be ruled out as one of the limitations of this approach. We acknowledge that EIPs likely bind a subset of ETS transcription factors in addition to ERG. Importantly, we found no significantly altered genes in PC3 cells (ERG negative line) after RI- EIP treatment, demonstrating that the significant genes suppressed in VCaP (ERG positive line) by RI-EIPs are relevant to the ERG-mediated pathway.
There is emerging evidence that ERG protein stability is an important mediator of ERG oncogenic activity. The deubiquitinase USP9X was shown to bind and stabilize ERG, mediating prostate cancer progression (Wang et al., 2014). Two recent studies have shown that the Cullin 3-based ubiquitin ligase SPOP, which is mutated in ETS-negative cancers (Barbieri et al., 2012), binds to ERG and mediates proteosomal degradation of ERG (An et al., 2015; Gan et al., 2015). The majority of prostate cancers that harbor ERG gene fusions express a truncated version of the protein, which affects its ability to bind SPOP, thus evading protein degradation (An et al., 2015; Gan et al., 2015). In our study, EIPs preferentially bind the truncated “oncogenic” version of ERG found in prostate cancers (such as in VCaP cells) while inefficiently binding wild-type ERG found in HUVEC cells, which is presumably complexed with SPOP. Thus, while SPOP is ineffective at mediating proteosomal degradation of truncated oncogenic ERG, EIPs bind to oncogenic ERG and likely mediate their therapeutic effects through engaging the same proteosomal machinery.
The observation that EIP treatment destabilizes ERG may highlight an alternative approach to therapeutic modulation of transcription factors. One limitation of many small-molecule antagonists is that they disrupt the activity of single domains in target proteins. Continuous dosing of small molecule inhibitors eventually induces the emergence of drug resistance, leading to limited therapeutic durability. In contrast, protein degraders often have higher and longer pharmacological effects without requiring continuous high exposure (Crews, 2010; Lu et al., 2015; Winter et al., 2015). Such an approach can abolish the presence of an oncoprotein, which, in theory, can overcome resistance to target inhibitors.
While we have demonstrated that peptidomimetics targeting ERG and other transcription factors could have significant therapeutic potential, further studies are warranted, including structural modeling (Regan et al., 2013) and backbone chemical modifications such as hydrocarbon stapling (Walensky et al., 2004), to improve their clinical feasibility. Likewise, characterization of structure–activity relationship (SAR) would help identify EIP derivatives that bind ERG with even higher affinity in vitro. Such studies would aid in understanding its specificity toward the target protein, as well as improve its in vivo potency. In conclusion, our work provides impetus for the development of peptidomimetics for ERG depletion as a targeted therapy for prostate cancer. Furthermore, these results also endorse an overarching approach whereby a previously undruggable transcription factor can be targeted through partial ablation, a promising therapeutic strategy that can be explored for other oncogenic transcription factors.
KEY RESOURCES TABLE
CONTACT FOR REAGENT AND RESOURCE SHARING
Further information and requests for reagents may be directed to and will be fulfilled by the corresponding author Arul M. Chinnaiyan (arul@umich.edu).
EXPERIMENTAL MODEL AND SUBJECT DETAILS
Cell Lines
PC3 (ATCC) and DU145 (ATCC) prostate cancer cell lines were grown in RPMI 1640 (Invitrogen) and VCaP (ATCC) cells in DMEM with Glutamax (Invitrogen), both supplemented with 10% FBS (Invitrogen) and cultured in 5% CO2 incubator. The immortalized prostate cell line RWPE-1 (ATCC) was grown in Keratinocyte media with L-glutamine (Invitrogen) supplemented with 2.5 μg EGF (Invitrogen) and 25 mg Bovine Pituitary Extract (Invitrogen). All cultures were maintained with 50 units/ml of penicillin/streptomycin (Invitrogen). The genetic identity of cell lines was determined as previously described (Sherman et al., 2007). Virus and stable isogenic cell lines were derived as previously described (Brenner et al., 2011).
Chicken CAM assays
The CAM assays were performed as described previously (Brenner et al., 2011). Briefly, fertilized eggs were incubated in a rotary humidified incubator at 38°C for 10 days. First the CAM was released by applying mild pressure to the hole over the air sac and cutting a square 1 cm2 window encompassing a second hole near the allantoic vein. Then cultured VCaP cells that stably express Cherry Red and pretreated with peptidomimetics as indicated were detached by trypsinization and re-suspended in complete medium and 2 × 10⁶ cells were implanted adjacent to the mesenchyme in each egg. The windows were subsequently sealed and the eggs were returned to a stationary incubator. For invasion and intravasation experiments, implanted eggs were treated with 25mg/kg body weight of the peptidomimetics 6 hr after inoculation and both the upper and lower CAM were isolated after 72 hr. Invasive cells were processed and stained for chicken collagen IV as previously described (Brenner et al., 2011). For metastasis and tumor growth assays, eggs were treated with 25 mg/kg body weight of indicated peptide administered every other day. At day 8 embryos were sacrificed and extra-embryonic tumors were excised and weighed. The embryonic lungs were harvested and analyzed for the presence of tumor cells by quantitative human alu-specific PCR. Genomic DNA from lower CAM and lungs were prepared using Puregene DNA purification system (Qiagen). Quantification of human cells in the extracted DNA was carried out as described (van der Horst et al., 2004). Fluorogenic TaqMan qPCR probes were used as described above, and DNA copy numbers were quantified.
Chicken CAM angiogenesis assay
Angiogenesis assays were performed as described previously (Hood et al., 2003). Filter discs saturated with 1.5 mg peptides along with 5 mg/ml VEGF were placed on top of the 10-day old chicken embryo CAM. Retinoic acid (2 mg/ml), a known inhibitor of angiogenesis, was used as positive control. After 72 hours, filter discs and associated CAM tissues were harvested and quantified. Angiogenesis was assessed as the number of visible blood vessel branch points within the defined area of the filter discs.
Xenograft mouse models
Athymic Nude-Foxn1nu male mice were procured from Harlan Laboratories, Inc. (Indianapolis, IN). VCaP (2 × 10⁶ cells) or PC3 (5 × 10⁵ cells) were resuspended in 100 μl of saline with 50% Matrigel (BD Biosciences, Becton Drive, NJ) and implanted subcutaneously into the flank regions on both sides of the mice. Mice were anesthetized using a cocktail of xylazine (80–120 mg/kg, IP) and ketamine (10 mg/kg, IP) for chemical restraint before tumor cells implantation. For short term assays, all tumors were staged for three weeks before starting peptidomimetic treatment. After week 3 (VCaP cells) or 12 days (PC3 cells), mice (10 per treatment group) were treated with peptidomimetics (25 mg/kg or 10 mg/kg as indicated, IP) daily five times a week. Tumor growth was recorded every three days using digital calipers and tumor volumes were calculated using the formula (π/6) (L × W2), where L = length of tumor and W = width. Body weight was monitored weekly over the course of the study. At the end of the xenograft studies, mice were anaesthetized and blood was collected by cardiac puncture and tumors were preserved for further biochemical and immunofluorescence analysis. Supernatant containing serum was separated by incubating blood on ice for 45 min, followed by centrifugation at 8000 rpm for 10 min at 4°C.
Survival was calculated using a cutoff tumor volume of 1,500 mm3 as a surrogate for mortality according to the approved animal protocol. Survival analysis was carried out using the GraphPad Prism 4.0 software (GraphPad Software, San Diego, CA). Statistical significance for Kaplan–Meier analysis was determined by the log-rank (Mantel–Cox) test.
All procedures involving mice were approved by the University Committee on Use and Care of Animals (UCUCA) at the University of Michigan and conform to their relevant regulatory standards.
METHOD DETAILS
Protein Expression by Baculovirus and Purification
Baculovirus that express either ERG or GUS protein was constructed using the Bac-to-Bac Baculovirus Expression System (Invitrogen). Briefly, cDNAs encoding full-length ERG and GUS were cloned into pDEST10 vector (Invitrogen) and transferred to FastBac vector (Invitrogen), which was used to make recombinant virus. Virus was then amplified following the manufacturer’s protocol and used to infect SF9 cells. After 3 day post-infection, SF9 cells were harvested and lysed (50mM Tris [pH 7.9], 150mM NaCl, 1mM MgCl2, 0.5mM EDTA, 1mM DTT, 0.1% NP40) in the presence of protease inhibitors (Roche). Cell lysates were homogenized by three rounds of sonication (30 s each) on ice and supernatant was recovered by centrifuging at 11,000 rpm for 10 min. Recombinant His-tagged ERG and GUS proteins were purified using Ni2+-NTA agarose (Invitrogen) following the manufacturer’s protocol and the eluates were dialyzed against lysis buffer overnight at 4°C, and stored at −80°C in 10% glycerol.
Enrichment of phage display random peptide library
The Ph.D.-7 Phage Display Peptide Library (New England Biolabs) was used in biopanning experiments. This library contained 109 unique 7-mer peptides linked to the N-terminus of a phage coat protein by a 4 amino acid spacer (GGGS). Using this library, ERG-binding phage clones were selected by panning over immunotubes (Maxisorb, Nunc) coated with recombinant protein at 10 μg/ml. First, nonspecific clones were removed by pre-absorbing phage clones from the phage library using a GUS protein-coated immunotube for 1 hour at 4 °C. ERG-binding phage clones were then enriched by panning the pre-cleared phage library over an ERG protein-coated immunotube for 2 hours at 4 °C, eluted with glycine buffer (pH 2.2) and neutralized with Tris buffer (pH 9.0). DNA from eluates and neutralized phage clones was then amplified and precipitated for subsequent rounds of selection. A total of 4 rounds of selection were performed.
Reverse Phage ELISA
After screening the phage display library, phage clones were serially diluted, spread on to Luria-Bertani (LB) agar plates and grown overnight at 37°C. A total of 59 single colonies were randomly chosen and propagated into 96-well plates. As controls, 4 random clones from the original, unenriched phage library and one empty phage clone were also selected. ELISA assays were performed to confirm the interaction between each phage clone and ERG. Briefly, ELISA plates (Max-Sorb™, NUNC) were incubated overnight at 4°C with either purified His-tagged ERG or GUS protein (10 μg/ml in carbonate buffer pH 9.6). Protein-coated ELISA plates were blocked (PBS with 5% BSA) for 1 hour at RT prior to incubation with expressed phage supernatant (diluted 1:10 in PBS with 1% BSA) for 2 hours at RT. The plates were then washed three times (PBS–0.1% Tween-20) and bound phage was detected with horseradish peroxidase-conjugated anti-M13 antibody (GE Healthcare) using the TMB substrate system (Sigma). Reactions were quenched using 250 mM HCl and absorbance was recorded on a SpectraMAX plate reader (OD 450 nm). DNA from phage clones was sequenced using the 96-gIII sequencing primer according to the manufacture’s protocol.
Peptide synthesis
Synthetic peptides (including biotin or FITC conjugated peptides) were custom-synthesized and HPLC-purified by AnaSpec (San Jose, CA). Peptides were stored lyophilized at −20°C until reconstituted with sterile water immediately before use for both in vitro and in vivo experiments. HPLC-MS was used to confirm 95% or higher purity for each peptide.
In vitro transcription/translation system
In vitro Halo fusion protein expression was achieved by cloning desired expression cassettes downstream of Halo loci (approximately 35 kDa). Briefly, ERG and ERG sub-domains were cloned into pFN19A vector (Promega) following the manufacturer’s instructions. Point mutations were then created in the Halo-ETS pFN19A expression vector using the Quikchange XL site directed mutagenesis kit (Stratagene). After cloning, Halo fusion proteins were expressed using the TNT® SP6 High-Yield Wheat Germ kit (Promega) following the manufacturer’s protocol. For each reaction, protein expression was confirmed by incubating the cell-free reactions with biotin-linked Halo ligand and performing Western blot analysis using an HRP-streptavidin.
HaloLink Protein Array
Identification of the peptide binding site on ERG was achieved by creating a custom protein array of full length ERG and ERG subdomains that were used to capture ERG-binding phage clones. First, full length or individual domains of Halo-ERG fusions were synthesized and expression was confirmed by Western blot as described above. Expressed proteins were covalently immobilized on HaloLink Slides (Promega) in a humidity chamber for 1 hour at RT. Protein coated slides were then washed using PBS-I (1X PBS, 0.05% IGEPAL CA-630) to reduce non-specific binding interactions and incubated with ERG-interacting phage clones (diluted in PBS-B: 1X PBS, 10 mg/ml BSA) in a humidity chamber for 1 hour at RT. After washing, slides were incubated with Cy3 labeled rabbit anti-M13 (GE Healthcare). In all cases, protein quantities were confirmed using an anti-HaloTag antibody. For peptide inhibition assays, the protein array was pre-incubated with the synthetic peptides for 1 hour prior to incubating with phage clones for an additional 1hr at RT. The signal was detected using an Axon scanner and images were quantified using GenePix Pro 6 software (Molecular Devices).
ERG:Peptide Binding Assays
The interaction coefficients between ERG and synthetic peptides or peptidomimetics were determined by biolayer interferometry technology using the Octet Red system (ForteBio). Purified ERG and GUS proteins were biotinylated by EZ-Link NHS-PEG4 Biotinylation Kit (Thermo Scientific) following the manufacturer’s protocol and any unincorporated biotin was removed from the reactions with Zeba 2ml desalt columns (Thermo). Biotinylated proteins (500 μg/ml) were then incubated with super streptavidin biosensors in binding buffer (20mM HEPES pH 7.4, 150mM NaCl), blocked with 10 μg/ml biocytin and washed three times in binding buffer. Peptides were serially diluted in binding buffer, mixed with the protein-coupled biosensors and peptidomimetic:protein association/dissociation was monitored for 10 min at 25 °C. Nonspecific binding from the signal obtained from peptidomimetic:GUS interactions was subtracted from that of peptidomimetic:ERG interactions and baseline signal drift was controlled by monitoring immobilized ERG without peptide. Octet Red analysis software was used to analyze the data.
Electrophoretic mobility shift assay (EMSA)
To determine the inhibitory activity of the peptide against the ERG:DNA interaction, we performed electrophoretic mobility shift assays (EMSAs). Double stranded ERG ETS binding sequence (5′ GATCTTCGAAACGGAAGTTCGAG 3′) was end-labeled using Biotin 3′ End DNA Labeling Kit (Pierce). For each binding reaction, VCaP cell extract was incubated with 1μg poly d (I–C), 2 μl of EMSA binding buffer (1.5% glycerol, 75 mM KCl, 0.375 mM DTT, 12.5 mM NaCl, 0.375 mM phenylmethylsulfonyl fluoride [PMSF]) and 5μM biotin-labeled EBS in the presence or absence of the peptides as indicated for 30 min at room temperature. The reaction mixtures were loaded onto 6% TBE gels (Invitrogen) and electrophoresed at 120 V for 2 hr at 4°C in 0.5% Tris-Borate-EDTA (TBE). Probes were transferred to nylon membrane (Biodyne B, Pall) in a semidry blotting device at 300 mA for 30 min. The membrane was baked for 30 min at 85°C in a dry oven. Biotinylated oligonucleotides were detected by probing with streptavidin-conjugated horseradish peroxidase and visualized by enhanced chemiluminescence (Pierce).
Pull-down assays
Approximately 1 mg of soluble VCaP cell lysate prepared in RIPA buffer (Invitrogen) was incubated with varying amounts of biotinylated peptides for 2 hours at 4°C. HaloLink agarose beads (20 μl) were added to the peptide-lysate mixture and incubated for an additional 4 hours. Beads were then pelleted by centrifugation, washed three times in PBS-T and loaded into an SDS-PAGE gel followed by Western blot analysis. Total VCaP cell lysate was loaded for positive control.
In vitro peptide competitive pull-down assay
Halo-ERG fusion protein was expressed using in vitro transcription/translation system as described above. After confirming protein expression, the Halo-ERG fusion protein was incubated with either 100 ng of GST-AR protein (Millipore) or 224 U (2 μl) of purified DNA-PKcs (Promega). Protein mixtures were incubated with or without the peptides in PBS-T (0.1% Tween) at 4°C overnight. Simultaneously, HaloLink beads (Promega) were blocked in 5% BSA at 4°C overnight. The next day 10 μl of HaloLink beads were mixed with the protein-peptide mixture, incubated at RT for 1 hour, washed with 4× in PBS-T and eluted into SDS sample buffer. Proteins were resolved on SDS gel electrophoresis followed by Western blot analysis with either anti-GST mAb (Sigma) or anti-DNA-PKcs (Santa Cruz, H-163) as described below. HaloLink beads without incubation with fusion proteins were used as negative controls.
Western blot analysis
VCaP cells were seeded in 6-well plates at 0.5×10⁶ cells/ml and after allowing cells to attach, cells were harvested and homogenized in NP40 lysis buffer (Sigma) containing a complete protease inhibitor cocktail (Roche). Ten micrograms of each protein extract was boiled in SDS sample buffer, size fractionated by SDS-PAGE, and transferred onto a PVDF membrane (GE Healthcare). After blocking in 5% nonfat dry milk, membranes were incubated with the following primary antibodies: anti-DNA-PKcs rabbit polyclonal (1:500, Santa Cruz, H-163), anti-ERG1/2/3 rabbit polyclonal (1:1000, Santa Cruz, C-17) or anti-AR monoclonal (1:1000, Millipore). Following three washes in TBS-T, the blots were incubated with horseradish peroxidase-conjugated secondary antibody and the signals visualized by enhanced chemiluminescence system according to manufacturer’s instructions (GE Healthcare).
Mass spectrometry
The samples were treated with SDS loading buffer supplied with 10 mM DTT for 5 min at 85°C. The proteins were alkylated by adding iodoacetamide to the final concentration of 15 mM. The samples were subjected to SDS-PAGE and the whole lanes were cut out and digested with trypsin in-gel for 2 hours. The resulting peptides were extracted, dried and resuspended in 0.1% formic acid with 5% acetonitrile prior to loading onto a trap EASY-column (Thermo Scientific) coupled to an in-house made nano HPLC column (20 cm × 75 um) packed with LUNA C18 media. Analysis was performed on Velos Pro mass spectrometer (Thermo Scientific) operated in data-dependent mode using 90-min gradients in EASY-LC system (Proxeon) with 95% water, 5% acetonitrile (ACN), 0.1% formic acid (FA) (solvent A), and 95% ACN, 5% water, 0.1% FA (solvent B) at a flow rate of 220nl/min. The acquisition cycle consisted of a survey MS scan in the normal mode followed by twelve data-dependent MS/MS scans acquired in the rapid mode. Dynamic exclusion was used with the following parameters: exclusion size 500, repeat count 1, repeat duration 10s, exclusion time 45s. Target value was set at 104 for tandem MS scan. The precursor isolation window was set at 2m/z. The complete analysis comprised two independent biological replicates.
Immunofluorescence staining
VCaP cells were seeded in a 4-well chamber slide for 24 hours prior to the addition of FITC-labeled peptide to a final concentration of 10 μM. After 2 hours incubation, cells were washed two times in PBS, and fixed for 15 min in 100% methanol. After washing an additional three times in PBS, cells were mounted using Vectashield with DAPI (Vector laboratories). Images were captured using 100× oil objective lens on an Olympus Confocal microscope at the University of Michigan microscopy imaging lab.
Co-localization staining
VCaP cells were seeded in a 8-well chamber slide for 24 hours prior to the addition FITC-labeled peptide to a final concentration of 1μM. After 6 hours incubation, cells were fixed in 4% paraformaldehyde, permeablized with PBS containing 0.1% triton-×100, blocked in PBS containing 2% normal goat serum and stained with (1:200 dilution) of primary antibody and (1:400 dilution) of secondary antibody diluted in blocking solution. The following primary and secondary antibodies were used: mouse-anti-ERG (Biocare) and goat-anti-mouse-Cy5 (Jackson Immuno-Research) respectively. Cells were then mounted in solution containing PBS, 2 mM trolox, 50 M protocatechiuc acid (PCA) and 50nM protocatechuate dehydrogenase (PCD) and imaging was performed as described (Pitchiaya et al., 2012). Emission from individual fluorophores was detected sequentially. Image processing was performed in Imaris and colocalization analysis was done in Imaris (Bitplane). Colocalization was calculated as the percentage of FITC spots that colocalized with ERG spots in the nucleus.
Chromatin Immunoprecipitation
VCaP cells were grown in complete medium and treated with peptidomimetics 12 hours prior to harvesting cells. ChIP assays were carried out as previously described (Brenner et al., 2011; Yu et al., 2010) using antibodies against ERG (Santa Cruz, #sc-354), DNA-PKcs (BD Biosciences, #610805), rabbit IgG (Santa Cruz, #sc-2027) or mouse IgG (Santa Cruz, #sc-2025). Briefly, chromatin collected from formaldehyde crosslinked and lysed cells was sonicated to an average length of 600 bp. Supernatants containing chromatin fragments were pre-cleared using protein A/G beads (Upstate) and incubated with 3–5 μg of ERG antibody or IgG overnight prior to the addition of 50μl of protein A/G beads for 1 hour. Antibody-bead precipitates were then washed six times and antibody/protein/DNA complexes were eluted with 150 l IP elution buffer (50mM NaHCO3, 1% SDS). To reverse the crosslinks, the complexes were incubated in elution buffer containing 10 μg RNase A and 0.3 M NaCl at 67°C for 4–5 hours. DNA/protein complexes were then precipitated with ethanol, air-dried, and dissolved in 100 μl of TE. Protein was then digested by incubation with proteinase K at 45°C for 1 hour and DNA was purified using a QIAGEN PCR column according to the manufacturer’s protocol. QPCR was performed using appropriate primers as previously described (Brenner et al., 2011).
Quantitative Real-Time PCR Assays
Total RNA was isolated from VCaP cells and tumors using Qiazol following the manufacturer’s protocol (Qiagen). Quantitative PCR (QPCR) was performed using SYBR Green dye on an Applied Biosystems 7300 Real Time PCR system (Applied Biosystems) as described (Tomlins et al., 2005). Briefly, 2 μg of total RNA was reverse transcribed into cDNA using SuperScript III (Invitrogen) in the presence of random primers (Invitrogen). All reactions were performed in triplicate with SYBR Green Master Mix (Applied Biosystems) and 25 ng of forward and reverse primer according to the manufacturer’s recommended thermocycling conditions, and then subjected to melt curve analysis. Threshold levels for each experiment were set during the exponential phase of the QPCR reaction using Sequence Detection Software version 1.2.2 (Applied Biosystems). The relative quantity of the target gene was calculated for each sample using the ΔΔCt method by the comparing mean Ct of the gene to the average Ct of the housekeeping gene, β-Actin (Livak and Schmittgen, 2001). All oligonucleotide primers were synthesized by Integrated DNA Technologies (Coralville, IA). The primer sequences for the transcript analyzed were previously described (Brenner et al., 2011).
Immunoprecipitation
Cell pellets or tumors treated with or without the peptidomimetics were lysed in cell lysis buffer (20mM MOPS, pH 7.0, 2mM EGTA, 5mM EDTA, 30 mM sodium fluoride, 60mM β-glycerophosphate, 20mM sodium pyrophosphate, 1mM sodium orthovanadate, 1% Triton X-100, 1mM DTT, protease inhibitor cocktail (Roche)). Cell lysates (0.5–1.0 mg) were pre-cleaned with protein A/G agarose beads (Santa Cruz) by incubation for 1 hour with shaking at 4°C followed by centrifugation at 2000 rpm for 3 min. Lysates were then incubated with 2 μg ERG antibody (Santa Cruz, C-17) at 4°C for 4 hours with shaking prior to addition of 20 μl protein A/G agarose beads and incubated at 4°C overnight. After washing 4 times with lysis buffer, beads were precipitated and resuspended in 25 μl of 2× loading buffer and boiled at 80°C for 10 min. Samples were then analyzed by SDS-PAGE and Western blot analysis as described above.
Basement Membrane Matrix Invasion Assays
For invasion assays, the cell lines were treated with the peptidomimetics or negative controls for 24 hours prior to harvesting and then seeded onto the basement membrane matrix (Chemicon, Temecula, CA) in the chamber insert with 8.0 μm pores of a 24-well culture plate in serum free media. Complete media was added to the lower chamber as a chemoattractant. After 48 hours incubation at 37°C in 5% CO2, the non-invading cells and EC matrix were gently removed with a cotton swab. Invasive cells, located on the lower side of the membranes, were stained with crystal violet, air dried and photographed. To quantify the relative number of invaded cells, colorimetric assays were performed by treating the inserts with 150 μl of 10% acetic acid (v/v) and measuring absorbance of each sample in a spectrophotometer at 560 nm (GE Healthcare).
Chromatin immunoprecipitation (ChIP) and ChIP-seq
ChIP assays for ERG were performed using HighCell ChIP kit (Diagenode) according to manufacturer’s protocol. For ERG ChIP-seq studies, VCaP cells were treated with 50 μM RI-EIP1 or RI-muEIP1 for 12 hours and then cross-linked with 1% formaldehyde for 10 min. Cross-linking was terminated by the addition of 1/10 volume 1.25 M glycine for 5 min at room temperature followed by cell lysis and sonication (Bioruptor, Diagenode), resulting in an average chromatin fragment size of 200bp. Chromatin equivalent to 5×10⁶ cells were used for ChIP assays using various antibodies. ChIP DNA was isolated (IPure Kit, Diagenode) from samples by incubation with the antibody at 4°C overnight followed by wash and reversal of cross-linking. The ChIP-seq sample preparation for sequencing was performed according to the manufacturer’s instructions (Illumina). ChIP-enriched DNA samples (1–10 ng) were converted to blunt-ended fragments using T4 DNA polymerase, E.coli DNA polymerase I large fragment (Klenow polymerase) and T4 polynuleotide kinase (New England BioLabs, NEB). A single A-base was added to fragment ends by Klenow fragment (3′ to 5′ exon minus; NEB) followed by ligation of Illumina adaptors (Quick ligase, NEB). The adaptor-modified DNA fragments were amplified by PCR using the Illumina Barcode primers and Phusion DNA polymerase (NEB). PCR products were size-selected using 3% NuSieve agarose gels (Lonza) followed by gel extraction using QIAEX II reagents (QIAGEN). Libraries were quantified with the Bioanalyzer 2100 (Agilent) and sequenced on the Illumina HiSeq 2000 Sequencer (100 nucleotide read length).
Serum kinetics of peptide concentration
Following IP injection of peptidomimetics, serum biotinylated peptide levels in mice was measured using the Quant-Tag Biotin kit (Vector) following the manufacturer instructions. Samples with known concentration of biotin were used to generate a standard curve to calculate the concentration of biotin in the serum samples.
QUANTIFICATION AND STATISTICAL ANALYSIS
Mass spectrometry data analysis
The resulting spectrum files were transformed into MGF format by MSConvert software and interrogated by MASCOT 2.4 search engine using human UniProt database version 15 concatenated with reverse sequences for estimation of false discovery rate (FDR) and with a list of common contaminants. The search parameters were as follows: full tryptic search, 2 allowed missed cleavages, peptide charges +2 and +3 only, MS tolerance 1 Da, MS/MS tolerance 0.5 Da. Permanent post-translational modifications was: cysteine carbamidomethylation. Variable post-translational modifications were: protein N-terminal acetylation, Met oxidation and N-terminal Glutamine to pyro-Glutamate conversion. The remaining analysis was performed as described (Poliakov et al., 2011). To summarize, the minimal ion score threshold was chosen such that a peptide false discovery rate (FDR) below 1% was achieved. The peptide FDR was calculated as 2 × (decoy_hits)/(target + decoy hits). Spectral counts for all detected proteins were assembled using an in-house written Python script. The adjustment of spectral counts was done by the same script as described (Poliakov et al., 2011).
Gene Expression Array Analysis
VCaP cells were treated with 50 μM peptides for 12 hours, and total RNA extracted using RNeasy Mini Kit (Qiagen) for gene expression array analysis. Expression profiling was performed using the Agilent Whole Human Genome Oligo Microarray (SantaClara, CA) according to the manufacturer’s protocol. All samples were run in biological quadruplets along with controls. The microarray data were preprocessed and normalized using the R package limma as described (Smyth, 2004). Over- and under-expressed gene sets were generated by filtering to include only 2-fold average over- or under-expression (FDR<0.01) in all hybridizations. Fisher’s exact test was applied to compare the significance of overlaps among the up- or down-regulated genes in siERG and peptide-treated VCaP cells. Gene Set Enrichment Analysis (GSEA) for those gene signatures was performed using the JAVA program (http://www.broadinstitute.org/gsea) as described (Subramanian et al., 2005).
Computational Analysis of ChIP-seq data
Short reads were aligned to the HG19 reference using Bowtie2 (Subramanian et al., 2005) with all default settings. Duplicate fragments (based on the coordinates of both reads) and fragments with only one mapped read were removed using samtools (Li et al., 2009). ERG peaks were called using PeakRanger (Feng et al., 2011) with default settings and a 1% FDR cut-off using chromatin input as control. To calculate read densities, ERG peaks (from both samples), merged using the reduce function from GenomicRanges (Lawrence et al., 2013), were first converted to the GFF format, then fragments overlapping these peak regions were counted using featureCounts (Liao et al., 2013) and the density was calculated by dividing the number of reads by the size of the reduced peak in kilobase pairs (kbp) and normalized by sequencing depth (per 1 million reads). Peaks were binned according to their significance in the control sample and the differences in read densities, separately for each bin, were assessed using a two-tailed t-test. Median signal profiles were calculated by: 1) calculating genome-wide ChIP signals using bedtools coverage (Quinlan and Hall, 2010); 2) converting the BedGraph files into BigWig files using bedGraphToBigWig (Kent et al., 2010); 3) extracting profiles within +/− 1kb around a summit with a resolution (window) of 100bp using bx-python (https://bitbucket.org/james_taylor/bx-python/);4) calculating for each peak a mean density within each window and; 5) calculating a median signal at each window across the 25% most-significant peaks.
Statistical Analysis
Statistical analysis was performed using GraphPad Prism 6 software. For individual comparisons, nonparametric Mann-Whitney test was used and p<0.05 were considered significant. On all plots and graphs, the standard error of the mean is shown.
DATA AND SOFTWARE AVAILABILITY
Both the microarray data and the ChIP-seq data are deposited at Gene Expression Omnibus under accession number GSE58975.
Supplementary Material
SIGNIFICANCE.
Recurrent TMPRSS2:ERG gene fusions are a driving molecular lesion in approximately 50% of prostate cancers, suggesting that targeting ERG activity may have therapeutic relevance. Unlike the BCR:ABL gene fusion in leukemia, which encodes a kinase, direct targeting of transcription factors has proven to be a formidable challenge. In this study, we identified ERG inhibitory peptidomimetics (EIPs) that bind to and degrade the ERG protein, preferentially targeting tumors addicted to ERG signaling. Taken together, this study demonstrates the therapeutic potential of peptidomimetics in targeting transcription factors, which could have significant implications for diverse cancers.
HIGHLIGHTS.
ERG inhibitory peptides (EIPs) interact specifically with DNA binding domain of ERG
EIPs block ERG-mediated transcription and recruitment to target gene loci
Binding of EIPs leads to proteolytic degradation of ERG protein
Retroinverso-EIPs suppress tumor growth, intravasation, and metastasis in vivo
Wang et al. identify peptides that interact with the DNA binding domain of ERG, thereby attenuating protein-protein interactions and chromatin recruitment of ERG and inducing ERG degradation. These peptides reduce proliferation, invasion, and tumor growth of prostate cancer cells with the TMPRSS2:ERG gene fusion.
Acknowledgments
We thank S. M. Dhanasekaran and N. Palanisamy for helpful discussions; L. Priya Kunju, Y. Chen, C. Cheng, J. R. Prensner, R.J. Lonigro, Y. Li for their technical support; and J. Athanikar, S. Ellison and K. Giles for manuscript preparation. A.M.C. is an American Cancer Society Research Professor. This work was supported in part by a Prostate Cancer Foundation Challenge Award (X.W., S.W., and A.M.C.), the National Institutes of Health R01CA132874 (A.M.C.), Prostate SPORE P50CA69568 (A.M.C.), the Early Detection Research Network UO1 CA113913 (A.M.C.), the Department of Defense PC051081 (A.M.C.), PC094725 (Q.C.), and the AACR-Bayer Prostate Cancer Research Fellowship 16-40-44-PITC (S.P.). I.A.A is supported by PCF Young Investigator Award. S.V. is supported by NIH/NCI R01CA157845 and R01CA154980. The University of Michigan holds a patent on ETS gene fusions as a diagnostic for prostate cancer which has been licensed to Hologic, where A.M.C. is named as a co-inventor. The University has also filed a patent on the peptidomimetic inhibitors of ERG described in this study in which A.M.C. and X.W. are named as inventors and the patent has been licensed by OncoFusion Therapeutics Inc. A.M.C. and S.W. are co-founders of OncoFusion, own stock and serve as consultant for OncoFusion.
Footnotes
Publisher's Disclaimer: This is a PDF file of an unedited manuscript that has been accepted for publication. As a service to our customers we are providing this early version of the manuscript. The manuscript will undergo copyediting, typesetting, and review of the resulting proof before it is published in its final citable form. Please note that during the production process errors may be discovered which could affect the content, and all legal disclaimers that apply to the journal pertain.
Author Contributions
X.W. and A.M.C. designed the overall project and directed the experimental studies. B.A., J.C.T., and K.M.J. designed and executed the xenograft experiments. I.A.A. carried out and analyzed CAM assays. X.W., Y.Q., I.J.A., R.W., C.X.W., S.V., S.P., and B.V.S.K.C. performed in vitro cell line studies. X.C. and X.J. performed gene expression studies. A.P. performed proteomic study. M.C. and H.J. performed bioinformatics analysis. W.Y. reviewed the pathologic slides. S.W. designed the mutant peptides. X.W., Y.Q., B.A., I.A.A., and A.M.C. interpreted the data. X.W. and A.M.C. wrote the paper.
References
- Albihn A, Johnsen JI, Henriksson MA. MYC in oncogenesis and as a target for cancer therapies. Adv Cancer Res. 2010;107:163–224. doi: 10.1016/S0065-230X(10)07006-5. [DOI] [PubMed] [Google Scholar]
- An J, Ren S, Murphy SJ, Dalangood S, Chang C, Pang X, Cui Y, Wang L, Pan Y, Zhang X, et al. Truncated ERG Oncoproteins from TMPRSS2-ERG Fusions Are Resistant to SPOP-Mediated Proteasome Degradation. Molecular cell. 2015;59:904–916. doi: 10.1016/j.molcel.2015.07.025. [DOI] [PubMed] [Google Scholar]
- Asangani IA, Dommeti VL, Wang X, Malik R, Cieslik M, Yang R, Escara-Wilke J, Wilder-Romans K, Dhanireddy S, Engelke C, et al. Therapeutic targeting of BET bromodomain proteins in castration-resistant prostate cancer. Nature. 2014;510:278–282. doi: 10.1038/nature13229. [DOI] [PMC free article] [PubMed] [Google Scholar]
- Attard G, Swennenhuis JF, Olmos D, Reid AH, Vickers E, A’Hern R, Levink R, Coumans F, Moreira J, Riisnaes R, et al. Characterization of ERG, AR and PTEN gene status in circulating tumor cells from patients with castration-resistant prostate cancer. Cancer Res. 2009;69:2912–2918. doi: 10.1158/0008-5472.CAN-08-3667. [DOI] [PubMed] [Google Scholar]
- Barbieri CE, Baca SC, Lawrence MS, Demichelis F, Blattner M, Theurillat JP, White TA, Stojanov P, Van Allen E, Stransky N, et al. Exome sequencing identifies recurrent SPOP, FOXA1 and MED12 mutations in prostate cancer. Nature genetics. 2012;44:685–689. doi: 10.1038/ng.2279. [DOI] [PMC free article] [PubMed] [Google Scholar]
- Birdsey GM, Dryden NH, Amsellem V, Gebhardt F, Sahnan K, Haskard DO, Dejana E, Mason JC, Randi AM. Transcription factor Erg regulates angiogenesis and endothelial apoptosis through VE-cadherin. Blood. 2008;111:3498–3506. doi: 10.1182/blood-2007-08-105346. [DOI] [PMC free article] [PubMed] [Google Scholar]
- Brenner JC, Ateeq B, Li Y, Yocum AK, Cao Q, Asangani IA, Patel S, Wang X, Liang H, Yu J, et al. Mechanistic Rationale for Inhibition of Poly(ADP-Ribose) Polymerase in ETS Gene Fusion-Positive Prostate Cancer. Cancer Cell. 2011;19:664–678. doi: 10.1016/j.ccr.2011.04.010. [DOI] [PMC free article] [PubMed] [Google Scholar]
- Cao Q, Yu J, Dhanasekaran SM, Kim JH, Mani RS, Tomlins SA, Mehra R, Laxman B, Cao X, Kleer CG, et al. Repression of E-cadherin by the polycomb group protein EZH2 in cancer. Oncogene. 2008;27:7274–7284. doi: 10.1038/onc.2008.333. [DOI] [PMC free article] [PubMed] [Google Scholar]
- Carrere S, Verger A, Flourens A, Stehelin D, Duterque-Coquillaud M. Erg proteins, transcription factors of the Ets family, form homo, heterodimers and ternary complexes via two distinct domains. Oncogene. 1998;16:3261–3268. doi: 10.1038/sj.onc.1201868. [DOI] [PubMed] [Google Scholar]
- Carver BS, Tran J, Gopalan A, Chen Z, Shaikh S, Carracedo A, Alimonti A, Nardella C, Varmeh S, Scardino PT, et al. Aberrant ERG expression cooperates with loss of PTEN to promote cancer progression in the prostate. Nat Genet. 2009;41:619–624. doi: 10.1038/ng.370. [DOI] [PMC free article] [PubMed] [Google Scholar]
- Cerchietti LC, Yang SN, Shaknovich R, Hatzi K, Polo JM, Chadburn A, Dowdy SF, Melnick A. A peptomimetic inhibitor of BCL6 with potent antilymphoma effects in vitro and in vivo. Blood. 2009;113:3397–3405. doi: 10.1182/blood-2008-07-168773. [DOI] [PMC free article] [PubMed] [Google Scholar]
- Chen Y, Chi P, Rockowitz S, Iaquinta PJ, Shamu T, Shukla S, Gao D, Sirota I, Carver BS, Wongvipat J, et al. ETS factors reprogram the androgen receptor cistrome and prime prostate tumorigenesis in response to PTEN loss. Nature medicine. 2013;19:1023–1029. doi: 10.1038/nm.3216. [DOI] [PMC free article] [PubMed] [Google Scholar]
- Chng KR, Chang CW, Tan SK, Yang C, Hong SZ, Sng NY, Cheung E. A transcriptional repressor co-regulatory network governing androgen response in prostate cancers. The EMBO journal. 2012;31:2810–2823. doi: 10.1038/emboj.2012.112. [DOI] [PMC free article] [PubMed] [Google Scholar]
- Crews CM. Targeting the undruggable proteome: the small molecules of my dreams. Chemistry & biology. 2010;17:551–555. doi: 10.1016/j.chembiol.2010.05.011. [DOI] [PMC free article] [PubMed] [Google Scholar]
- Darnell JE., Jr Transcription factors as targets for cancer therapy. Nat Rev Cancer. 2002;2:740–749. doi: 10.1038/nrc906. [DOI] [PubMed] [Google Scholar]
- de Bono JS, Logothetis CJ, Molina A, Fizazi K, North S, Chu L, Chi KN, Jones RJ, Goodman OB, Jr, Saad F, et al. Abiraterone and increased survival in metastatic prostate cancer. N Engl J Med. 2011;364:1995–2005. doi: 10.1056/NEJMoa1014618. [DOI] [PMC free article] [PubMed] [Google Scholar]
- Efthymiadis A, Briggs LJ, Jans DA. The HIV-1 Tat nuclear localization sequence confers novel nuclear import properties. J Biol Chem. 1998;273:1623–1628. doi: 10.1074/jbc.273.3.1623. [DOI] [PubMed] [Google Scholar]
- Feng X, Grossman R, Stein L. PeakRanger: a cloud-enabled peak caller for ChIP-seq data. BMC Bioinformatics. 2011;12:139. doi: 10.1186/1471-2105-12-139. [DOI] [PMC free article] [PubMed] [Google Scholar]
- Fenrick R, Amann JM, Lutterbach B, Wang L, Westendorf JJ, Downing JR, Hiebert SW. Both TEL and AML-1 contribute repression domains to the t(12;21) fusion protein. Mol Cell Biol. 1999;19:6566–6574. doi: 10.1128/mcb.19.10.6566. [DOI] [PMC free article] [PubMed] [Google Scholar]
- Flajollet S, Tian TV, Flourens A, Tomavo N, Villers A, Bonnelye E, Aubert S, Leroy X, Duterque-Coquillaud M. Abnormal expression of the ERG transcription factor in prostate cancer cells activates osteopontin. Molecular cancer research : MCR. 2011;9:914–924. doi: 10.1158/1541-7786.MCR-10-0537. [DOI] [PubMed] [Google Scholar]
- Gan W, Dai X, Lunardi A, Li Z, Inuzuka H, Liu P, Varmeh S, Zhang J, Cheng L, Sun Y, et al. SPOP Promotes Ubiquitination and Degradation of the ERG Oncoprotein to Suppress Prostate Cancer Progression. Molecular cell. 2015;59:917–930. doi: 10.1016/j.molcel.2015.07.026. [DOI] [PMC free article] [PubMed] [Google Scholar]
- Helgeson BE, Tomlins SA, Shah N, Laxman B, Cao Q, Prensner JR, Cao X, Singla N, Montie JE, Varambally S, et al. Characterization of TMPRSS2:ETV5 and SLC45A3:ETV5 gene fusions in prostate cancer. Cancer Res. 2008;68:73–80. doi: 10.1158/0008-5472.CAN-07-5352. [DOI] [PubMed] [Google Scholar]
- Hermans KG, van der Korput HA, van Marion R, van de Wijngaart DJ, Ziel-van der Made A, Dits NF, Boormans JL, van der Kwast TH, van Dekken H, Bangma CH, et al. Truncated ETV1, fused to novel tissue-specific genes, and full-length ETV1 in prostate cancer. Cancer Res. 2008;68:7541–7549. doi: 10.1158/0008-5472.CAN-07-5930. [DOI] [PubMed] [Google Scholar]
- Hood JD, Frausto R, Kiosses WB, Schwartz MA, Cheresh DA. Differential alphav integrin-mediated Ras-ERK signaling during two pathways of angiogenesis. J Cell Biol. 2003;162:933–943. doi: 10.1083/jcb.200304105. [DOI] [PMC free article] [PubMed] [Google Scholar]
- Jeon IS, Davis JN, Braun BS, Sublett JE, Roussel MF, Denny CT, Shapiro DN. A variant Ewing’s sarcoma translocation (7;22) fuses the EWS gene to the ETS gene ETV1. Oncogene. 1995;10:1229–1234. [PubMed] [Google Scholar]
- Kent WJ, Zweig AS, Barber G, Hinrichs AS, Karolchik D. BigWig and BigBed: enabling browsing of large distributed datasets. Bioinformatics. 2010;26:2204–2207. doi: 10.1093/bioinformatics/btq351. [DOI] [PMC free article] [PubMed] [Google Scholar]
- Kim J, Yu W, Kovalski K, Ossowski L. Requirement for specific proteases in cancer cell intravasation as revealed by a novel semiquantitative PCR-based assay. Cell. 1998;94:353–362. doi: 10.1016/s0092-8674(00)81478-6. [DOI] [PubMed] [Google Scholar]
- King JC, Xu J, Wongvipat J, Hieronymus H, Carver BS, Leung DH, Taylor BS, Sander C, Cardiff RD, Couto SS, et al. Cooperativity of TMPRSS2-ERG with PI3-kinase pathway activation in prostate oncogenesis. Nat Genet. 2009;41:524–526. doi: 10.1038/ng.371. [DOI] [PMC free article] [PubMed] [Google Scholar]
- Klambt C. The Drosophila gene pointed encodes two ETS-like proteins which are involved in the development of the midline glial cells. Development. 1993;117:163–176. doi: 10.1242/dev.117.1.163. [DOI] [PubMed] [Google Scholar]
- Klezovitch O, Risk M, Coleman I, Lucas JM, Null M, True LD, Nelson PS, Vasioukhin V. A causal role for ERG in neoplastic transformation of prostate epithelium. Proc Natl Acad Sci U S A. 2008;105:2105–2110. doi: 10.1073/pnas.0711711105. [DOI] [PMC free article] [PubMed] [Google Scholar]
- Koehler AN. A complex task? Direct modulation of transcription factors with small molecules. Curr Opin Chem Biol. 2010;14:331–340. doi: 10.1016/j.cbpa.2010.03.022. [DOI] [PMC free article] [PubMed] [Google Scholar]
- Kumar-Sinha C, Tomlins SA, Chinnaiyan AM. Recurrent gene fusions in prostate cancer. Nat Rev Cancer. 2008;8:497–511. doi: 10.1038/nrc2402. [DOI] [PMC free article] [PubMed] [Google Scholar]
- Lawrence M, Huber W, Pages H, Aboyoun P, Carlson M, Gentleman R, Morgan MT, Carey VJ. Software for computing and annotating genomic ranges. PLoS Comput Biol. 2013;9:e1003118. doi: 10.1371/journal.pcbi.1003118. [DOI] [PMC free article] [PubMed] [Google Scholar]
- Lee TI, Young RA. Transcriptional regulation and its misregulation in disease. Cell. 2013;152:1237–1251. doi: 10.1016/j.cell.2013.02.014. [DOI] [PMC free article] [PubMed] [Google Scholar]
- Li H, Handsaker B, Wysoker A, Fennell T, Ruan J, Homer N, Marth G, Abecasis G, Durbin R. The Sequence Alignment/Map format and SAMtools. Bioinformatics. 2009;25:2078–2079. doi: 10.1093/bioinformatics/btp352. [DOI] [PMC free article] [PubMed] [Google Scholar]
- Liao Y, Smyth GK, Shi W. featureCounts: an efficient general purpose program for assigning sequence reads to genomic features. Bioinformatics. 2013 doi: 10.1093/bioinformatics/btt656. [DOI] [PubMed] [Google Scholar]
- Liao YC, Lo SH. Deleted in liver cancer-1 (DLC-1): a tumor suppressor not just for liver. The international journal of biochemistry & cell biology. 2008;40:843–847. doi: 10.1016/j.biocel.2007.04.008. [DOI] [PMC free article] [PubMed] [Google Scholar]
- Livak KJ, Schmittgen TD. Analysis of relative gene expression data using real-time quantitative PCR and the 2(−Delta Delta C(T)) Method. Methods. 2001;25:402–408. doi: 10.1006/meth.2001.1262. [DOI] [PubMed] [Google Scholar]
- Lu J, Qian Y, Altieri M, Dong H, Wang J, Raina K, Hines J, Winkler JD, Crew AP, Coleman K, Crews CM. Hijacking the E3 Ubiquitin Ligase Cereblon to Efficiently Target BRD4. Chemistry & biology. 2015;22:755–763. doi: 10.1016/j.chembiol.2015.05.009. [DOI] [PMC free article] [PubMed] [Google Scholar]
- Malik R, Patel L, Prensner JR, Shi Y, Iyer MK, Subramaniyan S, Carley A, Niknafs YS, Sahu A, Han S, et al. The lncRNA PCAT29 inhibits oncogenic phenotypes in prostate cancer. Molecular cancer research : MCR. 2014;12:1081–1087. doi: 10.1158/1541-7786.MCR-14-0257. [DOI] [PMC free article] [PubMed] [Google Scholar]
- Martinez Molina D, Jafari R, Ignatushchenko M, Seki T, Larsson EA, Dan C, Sreekumar L, Cao Y, Nordlund P. Monitoring drug target engagement in cells and tissues using the cellular thermal shift assay. Science. 2013;341:84–87. doi: 10.1126/science.1233606. [DOI] [PubMed] [Google Scholar]
- McLaughlin F, Ludbrook VJ, Cox J, von Carlowitz I, Brown S, Randi AM. Combined genomic and antisense analysis reveals that the transcription factor Erg is implicated in endothelial cell differentiation. Blood. 2001;98:3332–3339. doi: 10.1182/blood.v98.12.3332. [DOI] [PubMed] [Google Scholar]
- Nguyen LT, Tretiakova MS, Silvis MR, Lucas J, Klezovitch O, Coleman I, Bolouri H, Kutyavin VI, Morrissey C, True LD, et al. ERG Activates the YAP1 Transcriptional Program and Induces the Development of Age-Related Prostate Tumors. Cancer cell. 2015;27:797–808. doi: 10.1016/j.ccell.2015.05.005. [DOI] [PMC free article] [PubMed] [Google Scholar]
- Oikawa T, Yamada T. Molecular biology of the Ets family of transcription factors. Gene. 2003;303:11–34. doi: 10.1016/s0378-1119(02)01156-3. [DOI] [PubMed] [Google Scholar]
- Pitchiaya S, Androsavich JR, Walter NG. Intracellular single molecule microscopy reveals two kinetically distinct pathways for microRNA assembly. EMBO Rep. 2012;13:709–715. doi: 10.1038/embor.2012.85. [DOI] [PMC free article] [PubMed] [Google Scholar]
- Poliakov A, Russell CW, Ponnala L, Hoops HJ, Sun Q, Douglas AE, van Wijk KJ. Large-scale label-free quantitative proteomics of the pea aphid-Buchnera symbiosis. Molecular & cellular proteomics : MCP. 2011;10:M110 007039. doi: 10.1074/mcp.M110.007039. [DOI] [PMC free article] [PubMed] [Google Scholar]
- Prensner JR, Iyer MK, Balbin OA, Dhanasekaran SM, Cao Q, Brenner JC, Laxman B, Asangani IA, Grasso CS, Kominsky HD, et al. Transcriptome sequencing across a prostate cancer cohort identifies PCAT-1, an unannotated lincRNA implicated in disease progression. Nature biotechnology. 2011;29:742–749. doi: 10.1038/nbt.1914. [DOI] [PMC free article] [PubMed] [Google Scholar]
- Quinlan AR, Hall IM. BEDTools: a flexible suite of utilities for comparing genomic features. Bioinformatics. 2010;26:841–842. doi: 10.1093/bioinformatics/btq033. [DOI] [PMC free article] [PubMed] [Google Scholar]
- Regan MC, Horanyi PS, Pryor EE, Jr, Sarver JL, Cafiso DS, Bushweller JH. Structural and dynamic studies of the transcription factor ERG reveal DNA binding is allosterically autoinhibited. Proc Natl Acad Sci U S A. 2013;110:13374–13379. doi: 10.1073/pnas.1301726110. [DOI] [PMC free article] [PubMed] [Google Scholar]
- Sherman BT, Huang da W, Tan Q, Guo Y, Bour S, Liu D, Stephens R, Baseler MW, Lane HC, Lempicki RA. DAVID Knowledgebase: a gene-centered database integrating heterogeneous gene annotation resources to facilitate high-throughput gene functional analysis. BMC Bioinformatics. 2007;8:426. doi: 10.1186/1471-2105-8-426. [DOI] [PMC free article] [PubMed] [Google Scholar]
- Shurtleff SA, Buijs A, Behm FG, Rubnitz JE, Raimondi SC, Hancock ML, Chan GC, Pui CH, Grosveld G, Downing JR. TEL/AML1 fusion resulting from a cryptic t(12;21) is the most common genetic lesion in pediatric ALL and defines a subgroup of patients with an excellent prognosis. Leukemia. 1995;9:1985–1989. [PubMed] [Google Scholar]
- Smyth GK. Linear models and empirical bayes methods for assessing differential expression in microarray experiments. Stat Appl Genet Mol Biol. 2004;3 doi: 10.2202/1544-6115.1027. Article3. [DOI] [PubMed] [Google Scholar]
- Snyder EL, Meade BR, Saenz CC, Dowdy SF. Treatment of terminal peritoneal carcinomatosis by a transducible p53-activating peptide. PLoS Biol. 2004;2:E36. doi: 10.1371/journal.pbio.0020036. [DOI] [PMC free article] [PubMed] [Google Scholar]
- Sorensen PH, Lessnick SL, Lopez-Terrada D, Liu XF, Triche TJ, Denny CT. A second Ewing’s sarcoma translocation, t(21;22), fuses the EWS gene to another ETS-family transcription factor. ERG Nat Genet. 1994;6:146–151. doi: 10.1038/ng0294-146. [DOI] [PubMed] [Google Scholar]
- Subramanian A, Tamayo P, Mootha VK, Mukherjee S, Ebert BL, Gillette MA, Paulovich A, Pomeroy SL, Golub TR, Lander ES, Mesirov JP. Gene set enrichment analysis: a knowledge-based approach for interpreting genome-wide expression profiles. Proc Natl Acad Sci U S A. 2005;102:15545–15550. doi: 10.1073/pnas.0506580102. [DOI] [PMC free article] [PubMed] [Google Scholar]
- Sun C, Dobi A, Mohamed A, Li H, Thangapazham RL, Furusato B, Shaheduzzaman S, Tan SH, Vaidyanathan G, Whitman E, et al. TMPRSS2-ERG fusion, a common genomic alteration in prostate cancer activates C-MYC and abrogates prostate epithelial differentiation. Oncogene. 2008;27:5348–5353. doi: 10.1038/onc.2008.183. [DOI] [PMC free article] [PubMed] [Google Scholar]
- Tomlins SA, Laxman B, Dhanasekaran SM, Helgeson BE, Cao X, Morris DS, Menon A, Jing X, Cao Q, Han B, et al. Distinct classes of chromosomal rearrangements create oncogenic ETS gene fusions in prostate cancer. Nature. 2007;448:595–599. doi: 10.1038/nature06024. [DOI] [PubMed] [Google Scholar]
- Tomlins SA, Laxman B, Varambally S, Cao X, Yu J, Helgeson BE, Cao Q, Prensner JR, Rubin MA, Shah RB, et al. Role of the TMPRSS2-ERG gene fusion in prostate cancer. Neoplasia. 2008;10:177–188. doi: 10.1593/neo.07822. [DOI] [PMC free article] [PubMed] [Google Scholar]
- Tomlins SA, Rhodes DR, Perner S, Dhanasekaran SM, Mehra R, Sun XW, Varambally S, Cao X, Tchinda J, Kuefer R, et al. Recurrent fusion of TMPRSS2 and ETS transcription factor genes in prostate cancer. Science. 2005;310:644–648. doi: 10.1126/science.1117679. [DOI] [PubMed] [Google Scholar]
- Tran C, Ouk S, Clegg NJ, Chen Y, Watson PA, Arora V, Wongvipat J, Smith-Jones PM, Yoo D, Kwon A, et al. Development of a second-generation antiandrogen for treatment of advanced prostate cancer. Science. 2009;324:787–790. doi: 10.1126/science.1168175. [DOI] [PMC free article] [PubMed] [Google Scholar]
- Vafa O, Wade M, Kern S, Beeche M, Pandita TK, Hampton GM, Wahl GM. c-Myc can induce DNA damage, increase reactive oxygen species, and mitigate p53 function: a mechanism for oncogene-induced genetic instability. Mol Cell. 2002;9:1031–1044. doi: 10.1016/s1097-2765(02)00520-8. [DOI] [PubMed] [Google Scholar]
- van der Horst EH, Leupold JH, Schubbert R, Ullrich A, Allgayer H. TaqMan-based quantification of invasive cells in the chick embryo metastasis assay. Biotechniques. 2004;37:940–942. 944, 946. doi: 10.2144/04376ST02. [DOI] [PubMed] [Google Scholar]
- Verger A, Buisine E, Carrere S, Wintjens R, Flourens A, Coll J, Stehelin D, Duterque-Coquillaud M. Identification of amino acid residues in the ETS transcription factor Erg that mediate Erg-Jun/Fos-DNA ternary complex formation. J Biol Chem. 2001;276:17181–17189. doi: 10.1074/jbc.M010208200. [DOI] [PubMed] [Google Scholar]
- Wadia JS, Dowdy SF. Transmembrane delivery of protein and peptide drugs by TAT-mediated transduction in the treatment of cancer. Adv Drug Deliv Rev. 2005;57:579–596. doi: 10.1016/j.addr.2004.10.005. [DOI] [PubMed] [Google Scholar]
- Walensky LD, Kung AL, Escher I, Malia TJ, Barbuto S, Wright RD, Wagner G, Verdine GL, Korsmeyer SJ. Activation of apoptosis in vivo by a hydrocarbon-stapled BH3 helix. Science. 2004;305:1466–1470. doi: 10.1126/science.1099191. [DOI] [PMC free article] [PubMed] [Google Scholar]
- Wang J, Cai Y, Yu W, Ren C, Spencer DM, Ittmann M. Pleiotropic biological activities of alternatively spliced TMPRSS2/ERG fusion gene transcripts. Cancer Res. 2008;68:8516–8524. doi: 10.1158/0008-5472.CAN-08-1147. [DOI] [PMC free article] [PubMed] [Google Scholar]
- Wang S, Kollipara RK, Srivastava N, Li R, Ravindranathan P, Hernandez E, Freeman E, Humphries CG, Kapur P, Lotan Y, et al. Ablation of the oncogenic transcription factor ERG by deubiquitinase inhibition in prostate cancer. Proceedings of the National Academy of Sciences of the United States of America. 2014;111:4251–4256. doi: 10.1073/pnas.1322198111. [DOI] [PMC free article] [PubMed] [Google Scholar]
- Winter GE, Buckley DL, Paulk J, Roberts JM, Souza A, Dhe-Paganon S, Bradner JE. DRUG DEVELOPMENT. Phthalimide conjugation as a strategy for in vivo target protein degradation. Science. 2015;348:1376–1381. doi: 10.1126/science.aab1433. [DOI] [PMC free article] [PubMed] [Google Scholar]
- Yan C, Higgins PJ. Drugging the undruggable: transcription therapy for cancer. Biochim Biophys Acta. 2013;1835:76–85. doi: 10.1016/j.bbcan.2012.11.002. [DOI] [PMC free article] [PubMed] [Google Scholar]
- Yu J, Yu J, Mani RS, Cao Q, Brenner CJ, Cao X, Wang X, Wu L, Li J, Hu M, et al. An integrated network of androgen receptor, polycomb, and TMPRSS2-ERG gene fusions in prostate cancer progression. Cancer cell. 2010;17:443–454. doi: 10.1016/j.ccr.2010.03.018. [DOI] [PMC free article] [PubMed] [Google Scholar]
- Zong Y, Xin L, Goldstein AS, Lawson DA, Teitell MA, Witte ON. ETS family transcription factors collaborate with alternative signaling pathways to induce carcinoma from adult murine prostate cells. Proc Natl Acad Sci U S A. 2009;106:12465–12470. doi: 10.1073/pnas.0905931106. [DOI] [PMC free article] [PubMed] [Google Scholar]
Associated Data
This section collects any data citations, data availability statements, or supplementary materials included in this article.