Abstract
The aim was to investigate effect of chitosan on markers of obesity and cardiometabolic risk in rats fed normal chow (NC) or high-fat/high-cholesterol diet (HF/HCD). Forty male rats were fed NC or HF/HCD for 3 months, then divided into 4 groups: group A fed NC, group B: NC + chitosan, group C: HF/HCD, and group D: HF/HCD + chitosan. Food intake and weight were recorded, and serum glucose, lipid profile, insulin, leptin, gamma glutamyl transferase (GGT), and tumor necrosis factor α were measured at beginning and after 12 weeks. Atherogenic index (AI), low-density lipoprotein cholesterol:high-density lipoprotein cholesterol (LDL-C:HDL-C), and homeostatic model assessment of insulin resistance (HOMA-IR) were calculated. At the end of study, food intake was significantly increased in group B; mean values of triglycerides, total cholesterol, LDL-C, LDL-C:HDL-C, and AI were decreased in group B and group D; mean leptin was increased in group A and decreased in group B; and mean values of insulin, HOMA-IR, and GGT were increased in group C. The results from this study suggest that chitosan improved lipid profile, insulin sensitivity, and oxidative stress caused by HF/HCD.
Keywords: Chitosan, obesity, cardiometabolic risk, lipid profile, insulin sensitivity
Introduction
Obesity has recently been considered a disease requiring treatment as a consequence of its association with increased risk of several serious diseases and disorders of chronic nature.1 Indeed, obesity is reported to increase the risk of premature mortality and to affect the quality of life, increasing the cost of health care greatly.2 Unfortunately, the prevalence of obesity is increasing globally3 and in Saudi Arabia in particular.4 Unfortunately, however, there are only limited treatment options.
Several natural products were reported to be helpful in the management of obesity such as decaffeinated green coffee bean extract and lingonberry.5–7 Chitosan, a natural polysaccharide composed of copolymers of glucosamine and N-acetylglucosamine and formed by partial deacetylation of chitin found in the hard shells of several crustaceans,8 has been proposed as such a product.9,10 Chitosan is generally regarded as safe,11 showing good biocompatibility, biodegradability, and absorption properties.12 Numerous supplementation studies reported a lowering effect on lipid absorption,13 lipid storage9 or weight gain,10,14 and plasma lipid levels15–18 in rodents fed high-fat or high-cholesterol diets. However, not all studies reported similar findings. One study, for example, reported that feeding rats a high-fat diet (plus chitosan oligosaccharide) for 3 weeks caused a decrease in triglycerides (TGs) by 29% to 31% and an increase in high-density lipoprotein cholesterol (HDL-C) levels by 8% to 11% but without any impact on low-density lipoprotein cholesterol (LDL-C).18 In another rat study (lasting 12 weeks), chitosan was reported to significantly reduce total cholesterol, and LDL-C levels in both the plasma and the liver, but without affecting TG and HDL-C concentrations.19 Furthermore, food intake during supplementation was not monitored in most studies. Moreover, some studies reported increased weight gain in broiler chicken,20,21 ducks,22 and in pigs.23 Therefore, there is still no clear consensus on the overall effects of chitosan.
In addition to the above, in vitro studies indicated that chitosan activates macrophages in rats,24,25 and in peritoneal macrophages of broiler chicken,26 increasing secretion of interleukin (IL)-1, IL-2, and tumor necrosis factor α (TNF-α), thus enhancing the immune function. However, other studies reported that high-molecular-weight water-soluble chitosan inhibited secretion of pro-inflammatory cytokines (TNF-α and IL-8) from mast (HMC-1) cells stimulated by calcium.27 Furthermore, another study using mice splenocytes reported that chitosan upregulates the inflammation reaction by IL-1 and IL-6 and downregulates that by TNF-α in lipopolysaccharide-associated immunity.28 Thus, as in the case of its effect on lipid profile, there still appears to be some discrepancy regarding the effect of chitosan on immune response and inflammatory cytokine production. Furthermore, no study examined the effects of chitosan when added to high-fat/high-cholesterol diet (a common characteristic of human diet), or to normal diet in rodents, on resulting lipid profile, or on inflammatory response or oxidative stress, both known to be increased in obesity and lead to increased insulin resistance and cardiometabolic risk.29–31 Tumor necrosis factor α, in particular, from adipose tissue is a prominent feature of obesity, which contributes significantly to the associated insulin resistance.32 Therefore, the aim was to investigate the effect of adding chitosan to diet of Wistar rats (normal chow, as well as high-fat/high-cholesterol diet) on weight gain, glucose homeostasis, insulin resistance, lipid profile, leptin level (as a marker of obesity), inflammatory response (reflected on expression levels of TNF-α), and oxidative stress estimated by measuring the level of a recently added marker,33 namely, gamma glutamyl transferase (GGT), while allowing them to eat without restriction.
Materials and Methods
Animals and diet
Forty male Wistar rats, 3 weeks old, with an average initial body weight of 31 to 42 g were purchased from Animal Unit at King Fahd Medical Research Center (KFMRC). The animals were housed in polycarbonate cages at 22 ± 2°C on a 12-hour light-dark cycle at the Animal Unit. Diet for the study was prepared and weighed in the “Food and Nutrition Research Unit” at the same center.
Study design
The study consisted of 2 phases as follows:
First phase
Half of the animals (n = 20) were fed high-fat/high-cholesterol diet (fat content: 30%-40% of energy, made from mixing butter with sheep’s tail fat 60%:40% weight for weight) to induce obesity, for 3 months with measurement of weight every week. The remaining rats (n = 20) were fed normal chow (fat content being 11% of total energy).
Second phase
Rats were divided into 4 groups (A-D) with 10 rats in each group and treated as follows: group A: fed standard chow diet, group B: fed standard chow diet with the addition of 1% weight:weight (w/w) chitosan (FGC-1-deacetylation degree = 96.1%, supplied by G.T.C. Bio Corporation, Shandong Province, China), group C: fed high-fat/high-cholesterol formulated diet, and group D: fed high-fat/high-cholesterol formulated diet with the addition of 1% w/w chitosan. Feeding regimen was performed for 12 weeks, with water and food being allowed “ad libitum.” Food intake was calculated on a daily basis, and weight was recorded at the start of the experiment, then at weekly intervals. Ethical approval was obtained from the “Committee of Ethics in Animal Research” at KFMRC. Fasting blood samples from all groups were collected at the beginning and at end of phase 2. Blood samples were drawn from retro-orbital plexus of anesthetized rats, collected in plain tubes (Teleknox Electronic AG, Shanghai, China), and placed on ice immediately to delay glycolysis. Blood was allowed to stand for a 0.5 to 1 hour at room temperature followed by centrifugation at 2000 rpm for 15 minutes (EBA 20; Hettich, Tuttlingen, Germany) to separate serum. Obtained serum was divided into several aliquots, stored at −80°C until the time of analysis. In addition to the above, a second fasting blood sample (2 mL) was collected from all rats in sodium heparin tubes (Teleknox Electronic AG) containing 2 mL of TRIzol reagent (Life Technologies, Camarillo, CA, USA) for RNA extraction so that volume of TRIzol to blood is 1:1. All heparin tubes containing TRIzol reagent were also stored at −80°C until time of RNA extraction.
Biochemical and endocrine measurements
Glucose, total cholesterol, TG, and HDL-C were measured using ARCHITECT c4000 Clinical Chemistry Analyzer (Abbott, Chicago, Illinois, USA) using Bio-Rad assay kits (Bio-Rad, Hercules, CA, USA) and LDL-C was calculated using the Friedewald equation.34 The LDL-C:HDL-C ratio and the atherogenic index (AI)35 were calculated. Insulin, leptin, and GGT levels were measured using rat-specific enzyme-linked immunosorbent assay kits (CUSABIO Company, Wuhan, China). Homeostatic model assessment of insulin resistance (HOMA-IR) was calculated by the equation as follows: Fasting insulin (mIU/L) × Fasting glucose (mmol/L)/22.5.36
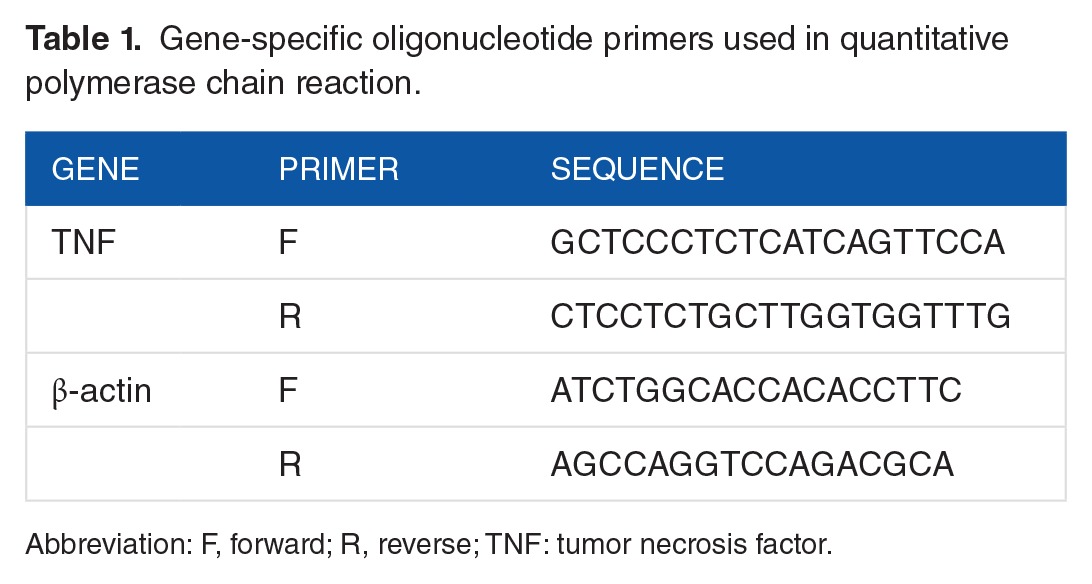
For the estimation of the expression of TNF-α, total RNA was isolated from whole blood by TRIzol (Life Technologies) according to the manufacturer’s instructions. Following checking the quality and quantity of extracted RNAs by NanoDrop 2000c from Thermo Scientific (Thermo Fisher Scientific Inc., Waltham, MA, USA), quantitative polymerase chain reaction (PCR) analysis was conducted using iTaq Universal SYBR Green One-Step Kit (Bio-Rad). Primers for TNF-α and β-actin as housekeeping gene were all obtained from Primerdesign, Chandler’s Ford, UK (Table 1). The PCR reactions were performed using the StepOnePlus Real-Time PCR System from Applied Biosystems, Foster City, CA, USA. Reaction was set as follows: 30 minutes/50°C for reverse transcription, 15 minutes/95°C PCR initial activation step, 40 cycles of denaturation for 20 seconds/95°C, and annealing step for 60 seconds/60°C. Measurement of gene expression levels was performed using delta cycle threshold (ΔCT) mean calculated according to the endogenous control β-actin.
Table 1.
Gene-specific oligonucleotide primers used in quantitative polymerase chain reaction.
Statistical analysis
Statistical analyses were performed using SPSS version 22 (Chicago, IL, USA). The 2−ΔΔct method (relative quantification [RQ]) was used to quantify gene expression. The variability degree of the results was expressed as mean ± standard deviation of mean values (mean ± SD). The significance of the differences between mean values of the same group before and after supplementation was determined using paired Student t test. The significance of the differences between mean values of corresponding groups (A and B and C and D) at zero time and at end of study period was determined using unpaired Student t test. The difference was regarded as significant when P value was <.05.
Results
Changes in weight and food intake
At the end of first phase, animals fed high-fat/high-cholesterol diet were significantly heavier than those on standard chow, with mean weight (±SD) of 454.0 ± 44.9 g, compared with 403.4 ± 45.8 g (P = .001). Two animals died from the fed high-fat/high-cholesterol diet group at the end of this phase, leaving a total of 38 rats to complete the study so that after dividing animals into 4 groups, groups C and D had 9 animals each.
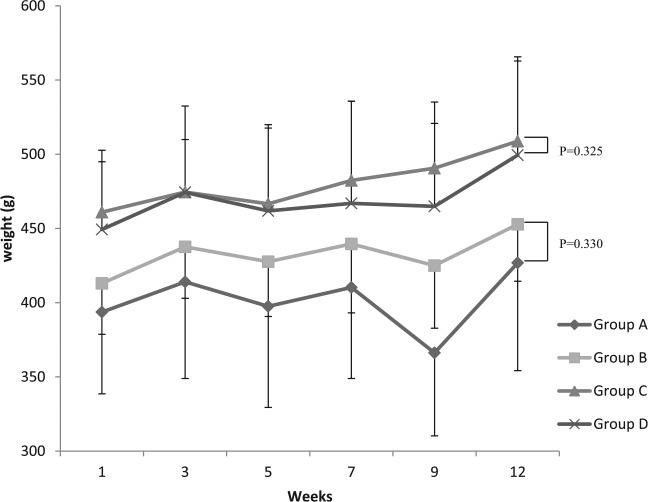
Weight changes during the second phase of the study are presented graphically in Figure 1. There was no significant difference in mean weight between groups A and B nor between groups C and D at the beginning or at the end of this phase (P > .325 in all cases).
Figure 1.
Weight changes of the 4 study groups (group A fed NC, group B: NC + chitosan, group C: HF/HCD, and group D: HF/HCD + chitosan) throughout the second phase. HF/HCD indicates high-fat/high-cholesterol diet; NC, normal chow.
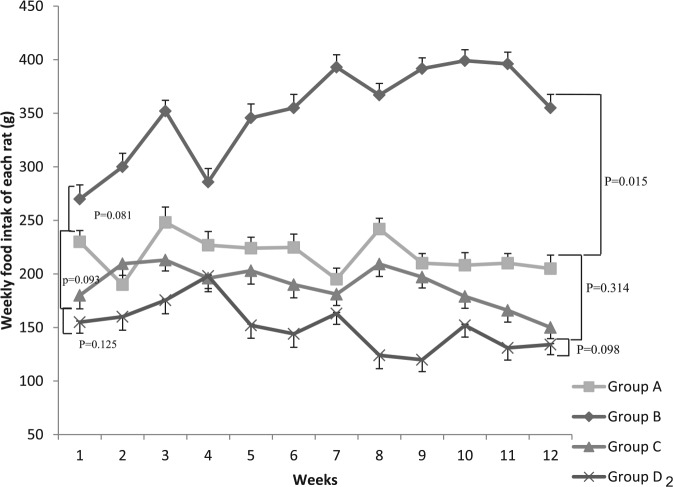
Food intake for all groups during the second phase is shown in (Figure 2). Intake of group on high-fat/high-cholesterol diet (group C) was less compared with that on standard diet (group A) at the beginning and end of the phase, but the difference did not reach statistical significance (P = .093 and .314, respectively).
Figure 2.
Food intake in all groups (group A fed NC, group B: NC + chitosan, group C: HF/HCD, and group D: HF/HCD + chitosan) during the second phase of experiments. HF/HCD indicates high-fat/high-cholesterol diet; NC, normal chow.
After adding chitosan to chow diet, the mean weight of food intake in group B increased remarkably and was significantly higher than that for group A (P = .015) at the end of the study. However, this was not noted for the 2 other groups (C and D) (P = .098).
Results of estimated biochemical and endocrine variables
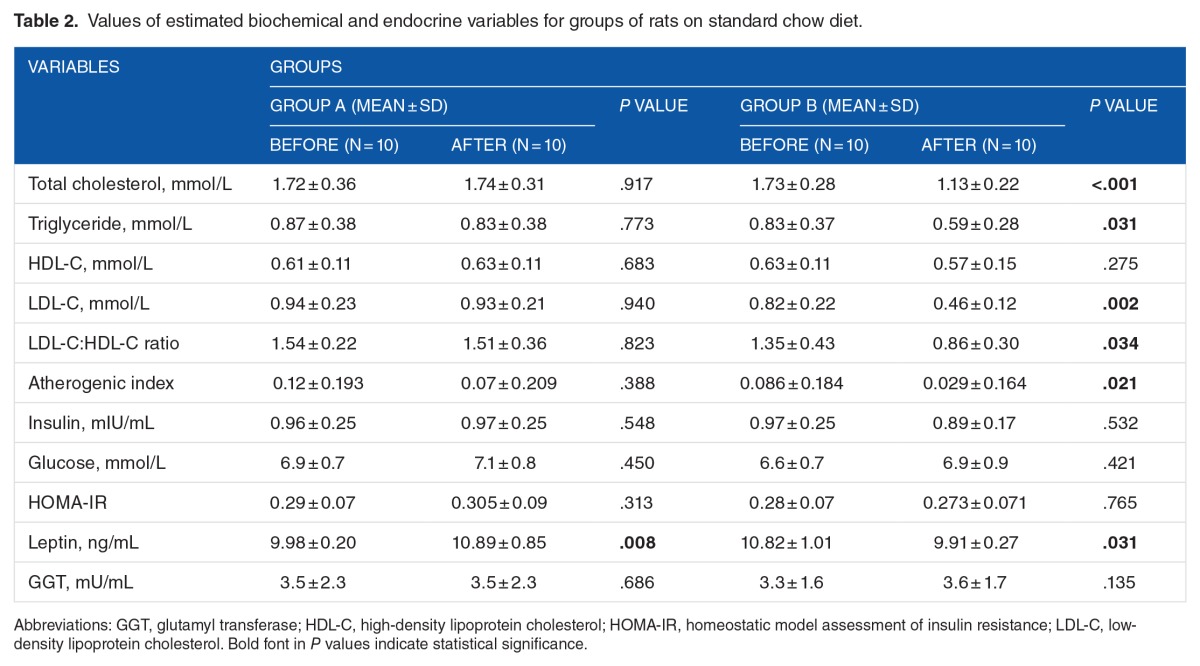
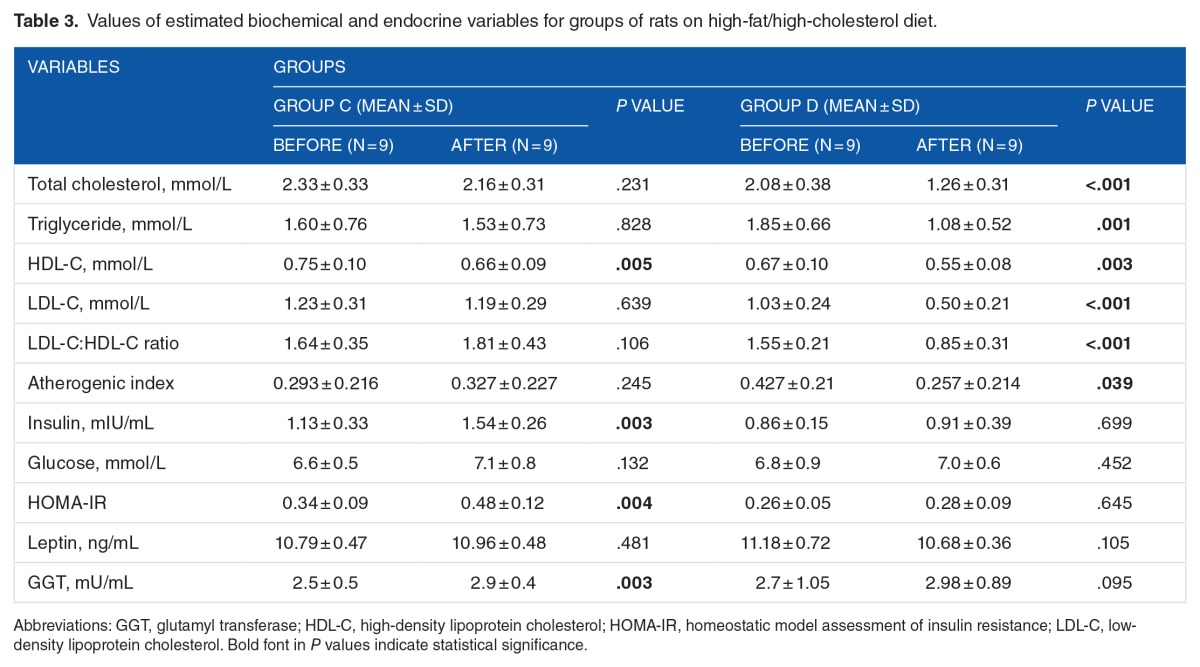
Results of estimated biochemical and endocrine variables are presented in Tables 2 and 3. At the beginning of this phase, there was no significant differences between the mean values of estimated parameters in corresponding groups (A and B and C and D), except that the mean of leptin in group B was significantly higher compared with group A (P = .008).
Table 2.
Values of estimated biochemical and endocrine variables for groups of rats on standard chow diet.
Table 3.
Values of estimated biochemical and endocrine variables for groups of rats on high-fat/high-cholesterol diet.
At the end of the study, mean levels of TG, LDL-C, and total cholesterol of group B (chitosan fed) showed significant decrease compared with the beginning of the study (P = .031, .002, and <.001, respectively), but there was no significant difference in the mean of HDL-C values (P = .275). However, there were significant decreases in the mean values of LDL-C:HDL-C ratio and of AI (P = .034 and .021, respectively). However, there were no significant differences in the mean values of GGT, glucose, insulin, and HOMA-IR at the end of supplementation phase (P = .135, .421, .532, and .765, respectively). Furthermore, there was a significant decrease in the mean of leptin values for group B compared with the starting mean (P = .031). No significant differences were noted in mean values of estimated parameters in group A (control group) (P > .313), except for the mean of leptin which showed a significant increase (P = .008)
Different results of supplementation with chitosan were obtained when the mean values of the investigated parameters of groups fed high-fat/high-cholesterol diet (C and D) were examined. At the end of the study, mean levels of TG, LDL-C, and total cholesterol of group D (chitosan fed) (P = .001, <.001, and <.001, respectively), but not group C (P = .828, .639, and .231, respectively), showed significant decrease compared with the beginning of the study. However, the mean values of HDL-C in both groups (C and D) were also significantly decreased (P = .005 and .003, respectively). In spite of this, the mean values of LDL-C:HDL-C ratio and of AI were both significantly decreased in group D only (P < .001 and .039, respectively). However, there were no significant differences in the mean values of glucose or leptin at the end of supplementation phase in both groups (P > .105). However, there were significant increases in the mean values of insulin, HOMA-IR, and GGT for group C compared with the starting mean values (P = .003, .004, and .003, respectively).
RQ of TNF-α gene expression
Relative quantification of TNF-α gene expression as mean ± SD is presented in Figure 3 for groups A and B and in Figure 4 for groups C and D. RNA concentration for samples ranged between 101.7 and 1203.3 ng/μL, and the ratio of 260/280 for RNA samples ranged between 1.87 and 2.09. There were no significant differences in the mean values of RQ of TNF-α expression in corresponding groups (A and B and C and D) (P = .928 and .27, respectively) due to the noted high standard deviation of mean.
Figure 3.
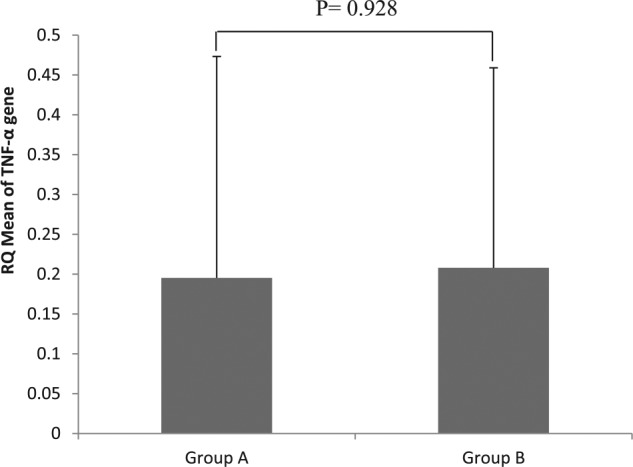
Relative quantification of TNF-α gene expression for rats on standard diet (group A fed NC, group B: NC + chitosan). NC indicates normal chow, RQ, relative quantification; TNF-α, tumor necrosis factor α.
Figure 4.
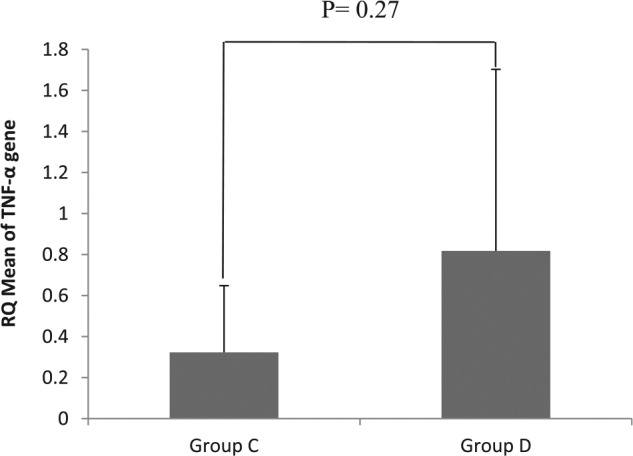
Relative quantification of tumor necrosis factor α gene expression for groups of rats on high-fat/high-cholesterol diet (HF/HCD) (group C: HF/HCD, and group D: HF/HCD + chitosan). NC indicates normal chow, RQ, relative quantification; TNF-α, tumor necrosis factor α.
Discussion
Studies have elucidated the role of adipose tissue in the development of insulin resistance, dyslipidemia, hypertension, and diabetes and hence increased cardiovascular risk.37,38 Obese individuals try to diminish the effect of dyslipdemic phenotype to decrease the risk of cardiovascular disease by taking drugs that lower high cholesterol, TG, and LDL-C. However, due to some harmful side effects of these drugs,39 interest in the use of natural products, including chitosan, is increasing.
In this animal study, we successfully established a model of diet-induced obesity by feeding high-fat diet during the first phase and succeeded in increasing weights of animals on designed diet considerably compared with those on standard diet.
Our study was not the first. Indeed, many studies were conducted to study various effects of adding chitosan to the diet of animals.9,10,14–18 However, results were inconclusive most likely due to differences in study design, type and quantity of chitosan used, as well as in length of supplementation study, and various other differences. For example, the dietary composition of used diets, which is known to affect various estimated parameters, was different.40 Another reason might be the difference in microbiota in intestine of used animals as diet affects the intestinal microbiota composition,41 and intestinal microbiota has been reported to have an effect on absorption of nutrients, angiogenesis, xenobiotic metabolism, as well as in mucosal barrier and immune function.42 Furthermore, the presence of chitosan in the diet was reported to shift the fermentation site toward the distal colon, thus affecting fecal bacterial enzyme activities, increasing the fecal short-chain fatty acid concentrations in rats, and increasing the harvesting of energy from fiber.43 In addition, dietary intake was not monitored in most studies.
Therefore, in the second phase of our study, some of the limitations of previous studies were avoided. The animals, which were obtained from the same animal house, hence were expected to have similar microbiota composition, were fed either regular diet with fat contributing 11% of energy or high-fat/high-cholesterol diet (30%-40% by weight, so much higher % of energy), with and without adding chitosan, while monitoring intake and allowing the rats to eat ad libitum, hence could study the effect of adding chitosan to different dietary regimens on food intake, and weight gain, as well as glucose homeostasis, insulin resistance, lipid profile, leptin level as a marker of increased fat storage, TNF-α as a marker of inflammatory response, and GGT as a marker of oxidative stress,33,44 while controlling for the effect of difference in microbiota. Therefore, any differences in the results of this study from previous findings might be mainly due to its study design.
It was shown that chitosan added to standard diet, but not high-fat/high-cholesterol diet, succeeded in preventing weight gain in spite of a higher food intake in group B (Figures 1 and 2). Thus, results were in contrast to those from a study reporting that low-molecular-weight chitosan oligosaccharide supplement decreased weight gain in rats on high-fat diet without an effect on appetite when a low or medium dose was given and a decrease in intake with high dose.14 However, in the mentioned study, chitosan was given by gavage once daily, which could have caused stress to the animals and influenced their food intake. In contrast, another study reported no effect on weight gain nor food intake in rats fed cholesterol-enriched diet.37 The study lasted for 4 weeks only, which might not have been long enough to detect effect on weight gain. Both studies14,37 used Sprague Dawley rats, whereas Wistar rats were used in this study, which could have contributed to difference in results. The higher food intake in this study could be attributed to the noted decrease in leptin in group B at the end of the study compared with the beginning, with the opposite trend noted for group A following supplementation (Table 1) because decreased leptin level was shown in previous studies to increase appetite.45,46 In partial agreement with results of this study, a study reported that treatment with chitosan of rats fed high-fat diet caused a significant reduction in serum leptin compared with the control group.47 However, this was not found in the high-fat/high-cholesterol fed groups, further indicating the effect of dietary composition on obtained results, and along with the lack of effect of supplement on weight gain noted in this group, indicating the ineffectiveness of chitosan as an obesity treatment when diets are high in fat and cholesterol, and dietary intake is not restricted. Indeed, several human studies indicated that when polyglucosamine or chitosan with different doses was administered concomitantly with a calorie-restricted diet, significantly more weight loss than with caloric restriction alone was achieved.48–52 However, a Cochrane systematic review53 concluded that even though there is evidence that chitosan is more effective in the short-term treatment of obesity and overweight compared with placebo, the effect on body weight is minimal and unlikely to be of clinical significance.
Beneficial effects of chitosan on plasma lipids were reported in various animal14–18,47,54–56 and human studies.48–53 However, results were inconsistent, with some reporting a decrease in TGs,14,18,52 others an increase in HDL-C,18,52,57 a decrease in total,15,16,55,57–60 and/or LDL-C.15,16,52,57–59 Some of these studies were very short, lasting 2 to 6 weeks only18,50,54,57,58,60; hence, changes in lipid fractions were minimal. This study lasted for 12 weeks, thus allowing adequate time period to detect changes in plasma lipids. It was found that chitosan significantly reduced mean values of total cholesterol and LDL-C, TGs, LDL-C:HDL-C ratio, and AI in both studied groups (B and D) (P < .05 in all cases). However, chitosan significantly decreased the mean values of HDL-C of the high-fat/high-cholesterol fed group (group D), but not the group fed normal chow (group B). Therefore, the effect on lipid profile appeared to be dependent on composition of diet and could partially explain inconsistencies in results reported in previous animal studies14–18,47,54–56 employing different dietary regimens.
The reported results are in partial agreement with the results of previous studies in rats fed high-cholesterol diet15,16 that reported significant decrease in total cholesterol and LDL levels, with no effect on HDL-C, but they did not calculate the LDL-C:HDL-C ratio or the AI as we did. However, in agreement with present findings, another study on broiler chicken reported that feeding of chitosan containing diets generally reduced the plasma total cholesterol and HDL-C.55 Furthermore, in another study on rats fed high-fat diet (plus chitosan oligosaccharide) for 3 weeks, chitosan was shown to lower TGs and to raise HDL-C levels, but without any impact on LDL-C,18 which is in partial agreement with present results. Similar effects on TG levels were reported in a study on obese rats.14
Despite not finding a change in the mean HDL-C in the group fed standard diet plus chitosan, decreased LDL-C:HDL-C ratio was noted. This was previously reported in a human study on moderately overweight subjects.48 Furthermore, present findings of reduced mean AI by chitosan supplementation in groups B and D are in agreement with previous study,54 which was conducted on rats fed high-cholesterol diet for 4 weeks.
It has been proposed in various animal studies that the improvement in lipid profile accomplished by chitosan supplementation is related to its fat-binding characteristics.13,17,56 If this is indeed the true mechanism of action of chitosan, then a possible side effect of long-term use will be deficiency of fat-soluble vitamins and essential fatty acids. However, this was not investigated in any studies so far.
No change was noted on glucose homeostasis in the group fed standard diet plus chitosan, with the mean values of fasting glucose, insulin, and HOMA-IR showing no significant differences compared with mean values before supplement. However, there was significant increase in the mean values of insulin and HOMA-IR in the group fed high-fat/high-cholesterol diet (group C) at the end of the study, which was not noted in the chitosan-supplemented group (group D) (Table 3). This is in contrast to a report of a significant reduction in serum insulin with chitosan supplement compared with the control group47 and a further indication to the effect of dietary composition on obtained results. Furthermore, the same study47 reported a significant reduction in serum TNF-α and GGT which is in contrast with present findings as neither TNF-α nor for GGT was decreased by the addition of chitosan to standard or to high-fat/high-cholesterol diet. In fact, there was a significant increase in GGT in group C (Table 3). The difference in present results could be due to the longer period of the study (21 compared with 12 weeks in this study), as well as difference in diet, as the study by Zhou et al47 was conducted on rats fed high-fructose diet leading to diet-induced hepatic steatohepatitis.
In conclusion, it can be suggested from the results in this study, as well as other studies mentioned above, that adding chitosan to diet carries some health benefits and in particular on lipid metabolism and insulin sensitivity. Thus, this cheap and apparently safe natural product could be a solution to the epidemic of obesity-induced dyslipidemia and insulin resistance and hence help to prevent its disastrous effects on health. Furthermore, present results indicate that chitosan does not modulate appetite directly but it might be useful in controlling weight under dietary restriction. However, more well-designed and controlled clinical trials are needed to investigate most effective dose and long-term possible side effects, if any.
Acknowledgments
The authors would like to thank Dr Huda Ahmed and Mr Tamer Shakir from Animal Unit at King Fahd Medical Research Center for help and specially thank to Dr Ashraf Dallol for technical support. They also would like to thank Mr Mohmmad Zaki Elassouli, Mr Ahmed Makki, and Mr Fares Mohammad Alshahrani, Mr Hyatham Khalil, and Mrs Naglaa Flemban. They especially thank KAKI’s Chair for Genetic Studies in Cardiovascular Disease and Diabetes for their technical assistance in the genetic studies. The animals were kindly provided free of charge by the Director of King Fahd Medical Research Center Dr Ghazi Damanhouri.
Footnotes
PEER REVIEW: Seven peer reviewers contributed to the peer review report. Reviewers’ reports totaled 1824 words, excluding any confidential comments to the academic editor.
FUNDING: The author(s) received no financial support for the research, authorship, and/or publication of this article.
DECLARATION OF CONFLICTING INTERESTS: The author(s) declared no potential conflicts of interest with respect to the research, authorship, and/or publication of this article.
Author Contributions
SMB and LA conceived and designed the experiments and wrote the first draft of the manuscript. LA, GA, AB, and SMB analyzed the data; agree with manuscript results and conclusions; jointly developed the structure and arguments for the paper; and made critical revisions and approved final version. GA and AB contributed to the writing of the manuscript. All authors reviewed and approved the final manuscript.
REFERENCES
- 1.Mokdad AH, Ford ES, Bowman BA, et al. Prevalence of obesity, diabetes, and obesity-related health risk factors, 2001. JAMA. 2003;289:76–79. doi: 10.1001/jama.289.1.76. [DOI] [PubMed] [Google Scholar]
- 2.Fontaine KR, Redden DT, Wang C, Westfall AO, Allison DB. Years of life lost due to obesity. JAMA. 2003;289:187–193. doi: 10.1001/jama.289.2.187. [DOI] [PubMed] [Google Scholar]
- 3.World Health Organization . Office of Health Communications and Public Relations: Obesity and Overweight. Geneva, Switzerland: World Health Organization; 2015. [Google Scholar]
- 4.Al-Quwaidhi AJ, Pearce MS, Critchley JA, Sobngwi E, O’Flaherty M. Trends and future projections of the prevalence of adult obesity in Saudi Arabia, 1992–2022. East Mediterr Health J. 2014;20:589–595. [PubMed] [Google Scholar]
- 5.Song SJ, Choi S, Park T. Decaffeinated green coffee bean extract attenuates diet-induced obesity and insulin resistance in mice. Evid Based Complement Alternat Med. 2014;2014:718379. doi: 10.1155/2014/718379. [DOI] [PMC free article] [PubMed] [Google Scholar]
- 6.Eid HM, Ouchfoun M, Brault A, et al. Lingonberry (Vaccinium vitis-idaea L.) exhibits antidiabetic activities in a mouse model of diet-induced obesity. Evid Based Complement Alternat Med. 2014;2014:645812. doi: 10.1155/2014/645812. [DOI] [PMC free article] [PubMed] [Google Scholar]
- 7.Santos AP, Rogero MM, Bastos DH. Edible plants, their secondary metabolites and antiobesogenic potential. Recent Pat Food Nutr Agric. 2010;2:195–212. [PubMed] [Google Scholar]
- 8.Chandy T, Sharma CP. Chitosan—as a biomaterial. Biomater Artif Cells Artif Organs. 1990;18:1–24. doi: 10.3109/10731199009117286. [DOI] [PubMed] [Google Scholar]
- 9.Han LK, Kimura Y, Okuda H. Reduction in fat storage during chitin-chitosan treatment in mice fed a high-fat diet. Int J Obes Relat Metab Disord. 1999;23:174–179. doi: 10.1038/sj.ijo.0800806. [DOI] [PubMed] [Google Scholar]
- 10.Sumiyoshi M, Kimura Y. Low molecular weight chitosan inhibits obesity induced by feeding a high-fat diet long-term in mice. J Pharm Pharmacol. 2006;58:201–207. doi: 10.1211/jpp.58.2.0007. [DOI] [PubMed] [Google Scholar]
- 11.Baldrick P. The safety of chitosan as a pharmaceutical excipient. Regul Toxicol Pharmacol. 2010;56:290–299. doi: 10.1016/j.yrtph.2009.09.015. [DOI] [PubMed] [Google Scholar]
- 12.Kean T, Thanou M. Biodegradation, biodistribution and toxicity of chitosan. Adv Drug Deliv Rev. 2010;62:3–11. doi: 10.1016/j.addr.2009.09.004. [DOI] [PubMed] [Google Scholar]
- 13.Deuchi K, Kanauchi O, Imasato Y, Kobayashi E. Effect of the viscosity or deacetylation degree of chitosan on fecal fat excreted from rats fed on a high-fat diet. Biosci Biotechnol Biochem. 1995;59:781–785. doi: 10.1271/bbb.59.781. [DOI] [PubMed] [Google Scholar]
- 14.Huang L, Chen J, Cao P, et al. Anti-obese effect of glucosamine and chitosan oligosaccharide in high-fat diet-induced obese rats. Mar Drugs. 2015;13:2732–2756. doi: 10.3390/md13052732. [DOI] [PMC free article] [PubMed] [Google Scholar]
- 15.Chiang MT, Yao HT, Chen HC. Effect of dietary chitosans with different viscosity on plasma lipids and lipid peroxidation in rats fed on a diet enriched with cholesterol. Biosci Biotechnol Biochem. 2000;64:965–971. doi: 10.1271/bbb.64.965. [DOI] [PubMed] [Google Scholar]
- 16.Yao HT, Chiang MT. Plasma lipoprotein cholesterol in rats fed a diet enriched in chitosan and cholesterol. J Nutr Sci Vitaminol. 2002;48:379–383. doi: 10.3177/jnsv.48.379. [DOI] [PubMed] [Google Scholar]
- 17.Zhang J, Liu J, Li L, Xia W. Dietary chitosan improves hypercholesterolemia in rats fed high-fat diets. Nutr Res. 2008;28:383–390. doi: 10.1016/j.nutres.2007.12.013. [DOI] [PubMed] [Google Scholar]
- 18.Wang D, Han J, Yu Y, et al. Chitosan oligosaccharide decreases very-low-density lipoprotein triglyceride and increases high-density lipoprotein cholesterol in high-fat-diet-fed rats. Exp Biol Med (Maywood) 2011;236:1064–1069. doi: 10.1258/ebm.2011.011032. [DOI] [PubMed] [Google Scholar]
- 19.Xu G, Huang X, Qiu L, Wu J, Hu Y. Mechanism study of chitosan on lipid metabolism in hyperlipidemic rats. Asia Pac J Clin Nutrn. 2007;16:313–317. [PubMed] [Google Scholar]
- 20.Khambualai O, Yamauchi K, Tangtaweewipat S, Cheva-Isarakul B. Growth performance and intestinal histology in broiler chickens fed with dietary chitosan. Br Poult Sci. 2009;50:592–597. doi: 10.1080/00071660903247182. [DOI] [PubMed] [Google Scholar]
- 21.Shi BL, Li DF, Piao XS, Yan SM. Effects of chitosan on growth performance and energy and protein utilisation in broiler chickens. Br Poult Sci. 2005;46:516–519. doi: 10.1080/00071660500190785. [DOI] [PubMed] [Google Scholar]
- 22.Yuan SB, Chen H. Effects of dietary supplementation of chitosan on growth performance and immune index in ducks. Afr J Biotechnol. 2012;11:3490–3495. [Google Scholar]
- 23.Xu Y, Shi B, Yan S, Li T, Guo Y, Li J. Effects of chitosan on body weight gain, growth hormone and intestinal morphology in weaned pigs. Asian-Australas J Anim Sci. 2013;26:1484–1489. doi: 10.5713/ajas.2013.13085. [DOI] [PMC free article] [PubMed] [Google Scholar]
- 24.Lim BO, Yamada K, Nonaka M, Kuramoto Y, Hung P, Sugano M. Dietary fibers modulate indices of intestinal immune function in rats. J Nutr. 1997;127:663–667. doi: 10.1093/jn/127.5.663. [DOI] [PubMed] [Google Scholar]
- 25.Peluso G, Petillo O, Ranieri M, et al. Chitosan-mediated stimulation of macrophage function. Biomaterials. 1994;15:1215–1220. doi: 10.1016/0142-9612(94)90272-0. [DOI] [PubMed] [Google Scholar]
- 26.Li H, Shi B, Yan S, Zhao T, Li J, Guo X. Effects of chitosan on the secretion of cytokines and expression of inducible nitric oxide synthase mRNA in peritoneal macrophages of broiler chicken. Braz Arch Biol Technol. 2014;57:466–471. [Google Scholar]
- 27.Kim MS, You HJ, You MK, Kim NS, Shim BS, Kim HM. Inhibitory effect of water-soluble chitosan on TNF-alpha and IL-8 secretion from HMC-1 cells. Immunopharmacol Immunotoxicol. 2004;26:401–409. doi: 10.1081/iph-200026887. [DOI] [PubMed] [Google Scholar]
- 28.Chung YS, Choi M, Park I, Park K-Y, Kim KH. Effects of chitosan on the production of TNF-Ձ, IL-1Ղ, and IL-6 in mice. Cancer Prev Res. 2010;15:204–210. [Google Scholar]
- 29.Hotamisligil GS. Inflammation and metabolic disorders. Nature. 2006;444:860–867. doi: 10.1038/nature05485. [DOI] [PubMed] [Google Scholar]
- 30.Wellen KE, Hotamisligil GS. Inflammation, stress, and diabetes. J Clin Invest. 2005;115:1111–1119. doi: 10.1172/JCI25102. [DOI] [PMC free article] [PubMed] [Google Scholar]
- 31.Furukawa S, Fujita T, Shimabukuro M, et al. Increased oxidative stress in obesity and its impact on metabolic syndrome. J Clin Invest. 2004;114:1752–1761. doi: 10.1172/JCI21625. [DOI] [PMC free article] [PubMed] [Google Scholar]
- 32.Dandona P, Aljada A, Bandyopadhyay A. Inflammation: the link between insulin resistance, obesity and diabetes. Trends Immunol. 2004;25:4–7. doi: 10.1016/j.it.2003.10.013. [DOI] [PubMed] [Google Scholar]
- 33.Lee D, Blomhoff R, Jacobs D., Jr Review is serum gamma glutamyltransferase a marker of oxidative stress? Free Radic Res. 2004;38:535–539. doi: 10.1080/10715760410001694026. [DOI] [PubMed] [Google Scholar]
- 34.Friedewald WT, Levy RI, Fredrickson DS. Estimation of the concentration of low-density lipoprotein cholesterol in plasma, without use of the preparative ultracentrifuge. Clin Chem. 1972;18:499–502. [PubMed] [Google Scholar]
- 35.Dobiasova M, Frohlich J. The plasma parameter log (TG/HDL-C) as an atherogenic index: correlation with lipoprotein particle size and esterification rate in apoB-lipoprotein-depleted plasma (FER(HDL)) Clin Biochem. 2001;34:583–588. doi: 10.1016/s0009-9120(01)00263-6. [DOI] [PubMed] [Google Scholar]
- 36.Matthews DR, Hosker JP, Rudenski AS, Naylor BA, Treacher DF, Turner RC. Homeostasis model assessment: insulin resistance and beta-cell function from fasting plasma glucose and insulin concentrations in man. Diabetologia. 1985;28:412–419. doi: 10.1007/BF00280883. [DOI] [PubMed] [Google Scholar]
- 37.Bastard JP, Maachi M, Lagathu C, et al. Recent advances in the relationship between obesity, inflammation, and insulin resistance. Eur Cytokine Netw. 2006;17:4–12. [PubMed] [Google Scholar]
- 38.Palomo I, Alarcon M, Moore-Carrasco R, Argiles JM. Hemostasis alterations in metabolic syndrome (review) Int J Mol Med. 2006;18:969–974. [PubMed] [Google Scholar]
- 39.Bray GA. A concise review on the therapeutics of obesity. Nutrition. 2000;16:953–960. doi: 10.1016/s0899-9007(00)00424-x. [DOI] [PubMed] [Google Scholar]
- 40.Sadowska J. Evaluation of the effect of diet composition and B-group vitamins supplementation on selected calcium metabolism parameters in female rats. Acta Sci Pol Technol Aliment. 2011;10:101–107. [PubMed] [Google Scholar]
- 41.Hildebrandt MA, Hoffmann C, Sherrill-Mix SA, et al. High-fat diet determines the composition of the murine gut microbiome independently of obesity. Gastroenterology. 2009;137:1716.e1–1724.e1. doi: 10.1053/j.gastro.2009.08.042. [DOI] [PMC free article] [PubMed] [Google Scholar]
- 42.Hooper LV, Wong MH, Thelin A, Hansson L, Falk PG, Gordon JI. Molecular analysis of commensal host-microbial relationships in the intestine. Science. 2001;291:881–884. doi: 10.1126/science.291.5505.881. [DOI] [PubMed] [Google Scholar]
- 43.Yao HT, Chiang MT. Chitosan shifts the fermentation site toward the distal colon and increases the fecal short-chain fatty acids concentrations in rats. Int J Vitam Nutr Res. 2006;76:57–64. doi: 10.1024/0300-9831.76.2.57. [DOI] [PubMed] [Google Scholar]
- 44.Bradley RD, Fitzpatrick AL, Jacobs DR, Jr, Lee DH, Swords Jenny N, Herrington D. Associations between γ-glutamyltransferase (GGT) and biomarkers of atherosclerosis: the Multi-ethnic Study of Atherosclerosis (MESA) Atherosclerosis. 2014;233:387–393. doi: 10.1016/j.atherosclerosis.2014.01.010. [DOI] [PMC free article] [PubMed] [Google Scholar]
- 45.Leibel RL. The role of leptin in the control of body weight. Nutr Rev. 2002;60:S15–S19. doi: 10.1301/002966402320634788. discussion S68–S84, 85–87. [DOI] [PubMed] [Google Scholar]
- 46.O’Rahilly S. Leptin: defining its role in humans by the clinical study of genetic disorders. Nutr Rev. 2002;60:S30–S34. doi: 10.1301/002966402320634904. discussion S68–S84, 85–87. [DOI] [PubMed] [Google Scholar]
- 47.Zhou GD, Li MR, Zhang J, et al. Chitosan ameliorates the severity of steatohepatitis induced by high fat diet in rats. Scand J Gastroenterol. 2008;43:1371–1377. doi: 10.1080/00365520802240230. [DOI] [PubMed] [Google Scholar]
- 48.Cornelli U, Belcaro G, Cesarone MR, Cornelli M. Use of polyglucosamine and physical activity to reduce body weight and dyslipidemia in moderately overweight subjects. Minerva Cardioangiol. 2008;56:71–78. [PubMed] [Google Scholar]
- 49.Mhurchu CN, Poppitt SD, McGill AT, et al. The effect of the dietary supplement, chitosan, on body weight: a randomised controlled trial in 250 overweight and obese adults. Int J Obes Relat Metab Disord. 2004;28:1149–1156. doi: 10.1038/sj.ijo.0802693. [DOI] [PubMed] [Google Scholar]
- 50.Pittler MH, Abbot NC, Harkness EF, Ernst E. Randomized, double-blind trial of chitosan for body weight reduction. Eur J Clin Nutr. 1999;53:379–381. doi: 10.1038/sj.ejcn.1600733. [DOI] [PubMed] [Google Scholar]
- 51.Willers J, Plötz SC, Hahn A. The combination of a high-protein formula diet and polyglucosamine decreases body weight and parameters of glucose and lipid metabolism in overweight and obese men and women. Eur J Food Res Rev. 2012;2:29–45. [Google Scholar]
- 52.Zahorska-Markiewicz B, Krotkiewski M, Olszanecka-Glinianowicz M, Zurakowski A. Effect of chitosan in complex management of obesity. Pol Merkur Lekarski. 2002;13:129–132. [PubMed] [Google Scholar]
- 53.Ni Mhurchu C, Dunshea-Mooij CA, Bennett D, Rodgers A. Chitosan for overweight or obesity. Cochrane Database Syst Rev. 2005;3:CD003892. doi: 10.1002/14651858.CD003892.pub2. [DOI] [PubMed] [Google Scholar]
- 54.Moon MS, Lee MS, Kim CT, Kim Y. Dietary chitosan enhances hepatic CYP7A1 activity and reduces plasma and liver cholesterol concentrations in diet-induced hypercholesterolemia in rats. Nutr Res Pract. 2007;1:175–179. doi: 10.4162/nrp.2007.1.3.175. [DOI] [PMC free article] [PubMed] [Google Scholar]
- 55.Razdan A, Pettersson D. Effect of chitin and chitosan on nutrient digestibility and plasma lipid concentrations in broiler chickens. Br J Nutr. 1994;72:277–288. doi: 10.1079/bjn19940029. [DOI] [PubMed] [Google Scholar]
- 56.Simunek J, Bartonova H. Effect of dietary chitin and chitosan on cholesterolemia of rats. Acta Vet Brno. 2005;74:491–499. [Google Scholar]
- 57.Veneroni G, Veneroni F, Contos S, et al. Effect of a new chitosan on hyperlipidaemia and overweight in obese patients. In: Muzzarelli RAA, editor. Chitin Enzymology. Vol. 2. Ancona, Italy: Atec Edizioni; 1996. pp. 63–67. [Google Scholar]
- 58.Choi CR, Kim EK, Kim YS, et al. Chitooligosaccharides decreases plasma lipid levels in healthy men. Int J Food Sci Nutr. 2012;63:103–106. doi: 10.3109/09637486.2011.602051. [DOI] [PubMed] [Google Scholar]
- 59.Jaffer S, Sampalis JS. Efficacy and safety of chitosan HEP-40 in the management of hypercholesterolemia: a randomized, multicenter, placebo-controlled trial. Altern Med Rev. 2007;12:265–273. [PubMed] [Google Scholar]
- 60.Maezaki Y, Tsuji K, Nakagawa Y, et al. Hypocholesterolemic effect of chitosan in adult males. Biosci Biotech Biochem. 1993;57:1439–1444. [Google Scholar]


