

Abstract
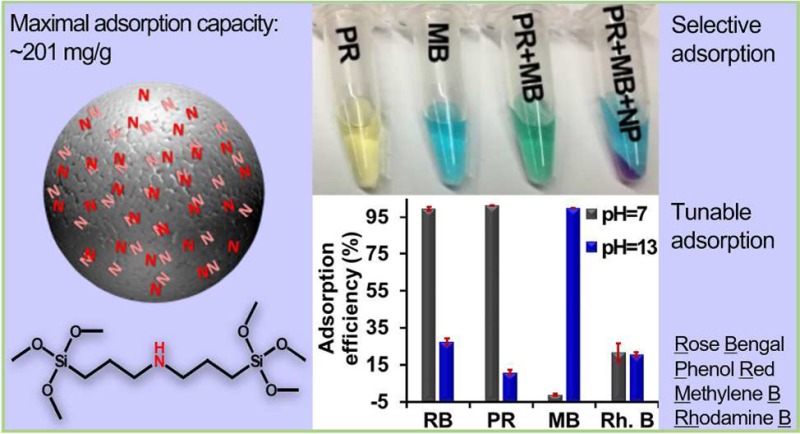
Nanomaterials are promising tools in water remediation because of their large surface area and unique properties compared to bulky materials. We synthesized an organosilica nanoparticle (OSNP) and tuned its composition for anionic dye removal. The adsorption mechanisms are electrostatic attraction and hydrogen bonding between the amine on OSNP and the dye, and the surface charge of the OSNP can be tuned to adsorb either anionic or cationic dyes. Using phenol red as a model dye, we studied the effect of the amine group, pH, ionic strength, time, dye concentration, and nanomaterial mass on the adsorption. The theoretical maximum adsorption capacity was calculated to be 175.44 mg/g (0.47 mmol/g), which is higher than 67 out of 77 reported adsorbents. The experimental maximum adsorption capacity is around 201 mg/g (0.53 mmol/g). Furthermore, the nanoparticles are highly reusable and show stable dye removal and recovery efficiency over at least 10 cycles. In summary, the novel adsorbent system derived from the intrinsic amine group within the frame of OSNP are reusable and tunable for anionic or cationic dyes with high adsorption capacity and fast adsorption. These materials may also have utility in drug delivery or as a carrier for imaging agents.
Keywords: organosilica nanoparticles, phenol red, adsorbent, water remediation, nanomaterials
Introduction
Industrial effluents can contain organic molecules, inorganic compounds, and polymers that pollute water intended for human consumption.1 This has been linked to numerous health challenges2 including stomach cancer3 and environmental toxicity.4 Colorants are especially challenging to remove because they are designed to be chemically stable, unreactive, and resistant to fading.5 These colorants are used in many industrially important activities such as the manufacture of paper, textiles, and leather, as well as food processing, cosmetics, and plastics.6 Thus, significant efforts have been dedicated to remediation technologies that can remove colorants from water.
There are many structural varieties of colorants, including acidic, basic, disperse, azo, diazo, anthroquinone-based, and metal complex dyes.5 However, intensely colored, water-soluble anionic dyes are the most difficult to remove from wastewater because they are rarely affected by conventional treatment schema based on biological degradation in sewage treatment plants.7,8 Next generation systems include chemical methods such as oxidation, ozonation, or photochemical/electrochemical degradation. Of these, dye flocculation is more common,9 but the resulting aggregate is often difficult to separate from the solution.10 Biological treatments can be self-sustaining, but are also time-consuming, specific to the type of biotic degradation, and can result in toxic byproducts.11
Physical methods are often more cost efficient and are useful for chemically stable dyes. These methods include membrane separation, ozonation, and adsorption. Adsorption is particularly common because of its reliability and affordability.12 The most common adsorbent is activated carbon,13 but it is relatively expensive and is difficult to reuse. A variety of natural carbon sources have also been proposed including peat,14,15 wheat husk,16,17 wood,18,19 pine cones,20,21 etc., which are low cost but requires long retention times.5 More recently, mesoporous silica nanoparticles have been proposed as an adsorbent for dye removal.22−27
Mesoporous silica nanoparticles are made from surfactant templates and offer high surface areas.28,29 They can be routinely made on the gram scale and are commercially available. Although primarily described as drug delivery vehicles,30−32 transfection vectors,33 or imaging agents,34−36 inorganic nanoparticles also have promising utility in dye remediation due to their high surface area and facile/tunable adsorption–desorption characteristics via surface coating. Indeed, mesoporous silica nanoparticles have been modified with amine groups to remove anionic dyes22−25 or carboxylate groups to remove basic dye.26,27
However, these surface modification approaches do not take full advantages of the high surface area of mesoporous silica nanoparticles because the surface functionalization does not cover the entire nanoparticle surface.37 Moreover, these functionalized amine groups are unstable.38,39 These two limitations can be overcome by integrating amine groups directly into the nanoparticle frame,40 and amines are an efficient methyl orange binding site.41 In this Research Article, we designed and fabricated organosilica nanoparticles (OSNP) with intrinsic secondary amine groups and then tested their adsorption mechanism and capabilities.
The adsorption studies demonstrated that the neutral OSNP could adsorb either anionic or cationic dyes by tuning the surface charge of the material via pH. At neutral pH, the OSNP bound negatively charged dyes selectively from a mixture of positively and negatively charged dyes. Moreover, the OSNPs have a relatively high adsorption capacity within several minutes and could be reused at least 10 times without any decrease in adsorption capacity. We applied the Langmuir and Freundlich isotherm models and calculated the pseudo-first-order and pseudo-second-order adsorption kinetic constants. To the best of our knowledge, this is the first example of silica nanoparticles with intrinsic amine groups applied to dye remediation.
Experimental Section
Chemicals
Hexadecyltrimethylammonium bromide (CTAB, ≥99%), ammonium hydroxide (NH4OH), bis(triethoxysilyl) ethane (BTSE), bis(3-trimethoxysilyl-propyl)amine (TSPA, 90%), dimethylhexadecylamine (DMHA), rhodamine B, sodium chloride, decane, and hydrochloric acid were purchased from Sigma-Aldrich Inc. Phenol red was from Acros Organics. Methylene blue and rose bengal disodium were purchased from the Fisher Scientific. Ethanol was purchased from VWR. Methanol was provided by Alfa Aesar. Millipore water with a resistivity larger than 18.2 MΩ·cm was used unless specified otherwise.
OSNP Synthesis
The OSNP synthesis used organosilicate precursors. First, we mixed 0.4 mmol of CTAB, 0.085 mL of 26% ammonia solution, 0.6 mmol of decane, and 0.4 mmol of DMHA in 150 mL water. The mixture was sonicated in a water bath at 50 °C for 3 h, emulsified with an ultrasound probe for 30 min, and then stirred at 50 °C for 30 min. In a separate tube, the TSPA and BTSE were mixed in ethanol and then sonicated in a water bath for 30 min. The OSNP properties were tuned by adjusting the ratio of TSPA to BTSE. The TSPA percentages were 0%, 20%, 40%, 60%, 80%, and 100% with a 0.40 mL total volume of TSPA and BTSE. The silica mixture was then slowly added to the emulsified solution of CTAB. The final mixture was stirred for an additional 2 h at 50 °C followed by standing overnight at 50 °C. The mixture was then centrifuged, washed with 1% NaCl in methanol thrice, washed with ethanol thrice, and resuspended in water.
Characterization
The OSNP were imaged with a JEOL JEM-1200 EXII transmission electron microscope (TEM) operating at 120 kV. A JEM-2100F operating at 210 kV was also used for some samples. The hydrodynamic radius and zeta potential were measured with a Zetasizer from Malvern via dynamic light scattering (DLS). The N2 adsorption–desorption isotherms at 77 K were measured on a Micrometitics ASAP 2020 system. FT-IR spectrum was performed on a Spectrum Two spectrometer from PerkinElmer. The nitrogen in the OSNP was analyzed using a PerkinElmer CHN analyzer. Solid-state 29Si NMR spectra were recorded using a Bruker AMX-600 spectrometer. X-ray photoelectron spectroscopy (XPS) analysis was performed using a Kratos Axis Ultra DLD instrument with monochromatic Al (Ka) radiation. The data were analyzed using Casa-XPS software, and two different components were fit to the N 1s signals. The energy difference between these components was fixed at 1.8 eV.42 An inductively coupled plasma optical emission spectrometer (ICP-OES, Optima 3000DV, PerkinElmer) was used to quantify the loss of OSNP during desorption. The pH was measured with a Milwaukee MW 102 pH/Temp Meter. All absorbance measurements used a SpectraMax M5 spectrophotometer from Molecular Devices.
Adsorption Studies
Adsorption was done at pH 7 with 80% TSPA nanoparticles at room temperature unless otherwise specified. First, 5 mg of OSNP with different compositions, zeta potential, and surface areas were added separately to 1 mL of 0.5 mg/mL (1.33 mM) phenol red. Upon mixing, the tubes were vortexed, reacted overnight, and then the supernatants were collected after centrifugation.
To study the influence of pH on the adsorption capacity 100 μL samples at various pH 1 to 13 was added to 100 μL of 0.5 mg/mL (1.33 mM) phenol red with vortexing. These solutions were then added to 100 μL of Millipore water containing 2 mg of OSNP. This was allowed to stand for 10 min before supernatant collection.
Ionic strength was tuned with NaCl. NaCl solutions of different ionic strength were created and then mixed with 4 mg/mL (10.63 mM) phenol red at a ratio of 2:1. The mixtures were then added separately to 40 mg/mL OSNP solutions at a ratio of 3:1. The final mixtures were vortexed, allowed to stand for 30 min, and then the supernatant was collected.
To study the effect of dye concentration, phenol red at 0 to 5 mg/mL (13.29 mM) were prepared, and then 2 mg of OSNP were added to 200 μL of each solution. The mixtures were vortexed, reacted for 30 min, and then the supernatant was collected for absorbance spectroscopy.
We then studied the effect of adsorbent dosage. The 30 μL of OSNP aqueous solutions from 0 to 80 mg/mL were mixed with 240 μL of 0.1 mg/mL (0.27 mM) phenol red and 90 μL of 0.01 M HCl solution. These mixtures were vortexed and reacted for 30 min before supernatant collection for absorbance spectroscopy.
To test the reusability of OSNP on phenol red adsorption, 0.5 mg/mL (1.33 mM) phenol red was mixed with a pH 2 solution of OSNPs at a volume ratio 1:1. The OSNP were added to these phenol red solutions for 5 min. The supernatant was then collected via centrifugation. The particles were rinsed with water once to remove free dye and then treated with 300 μL of 0.0167 M NaOH for 5 min to detach the phenol red from the OSNP. We collected the supernatant and then washed the pellets with water. These procedures were repeated 10 times.
For the selective adsorption of anionic dye, phenol red (0.04 mM or 0.4 mM) and methylene blue (0.04 mM or 0.4 mM) were mixed at three molar ratios: 10:1, 1:1, and 1:10. Then OSNP (80% TSPA) were added and allowed to adsorb dyes for 5 min before collection of supernatants.
To understand the adsorption mechanisms, we compared the OSNP absorption of phenol red, rose bengal, methylene blue, and rhodamine B. The 1.4 mg of OSNP made of 80% TSPA were added to 0.1 mL of pH 7 or pH 13 solutions. Then, 0.1 mL of 0.2 mM of phenol red, rose Bengal, rhodamine B, and methylene blue were added to both solutions separately. The mixtures were vortexed, reacted for 5 min, and centrifuged.
Finally, we studied the adsorption kinetics and isotherms. The OSNP were added to phenol red solution at a ratio of 0.5 mg of OSNP: 0.1 mL of dye. The dye concentration varied from 0.015 mg/mL (0.04 mM) to 2 mg/mL (5.31 mM). The mixture was vortexed, allowed to react for 5, 10, 20, 40, 60 min or 2.5, 5, 10, 24, and 73 h. The supernatant was then collected by centrifugation. For the isotherm study, OSNP aqueous solutions at different concentrations were made; 100 μL of each solution was then mixed with 100 μL of 5 mg/mL (13.29 mM) phenol red. These mixtures were vortexed and allowed to react for 30 min before supernatant collection.
Adsorption Data Analysis
The absorbance spectra of phenol red vary with pH. Under basic conditions, there is a peak at 557 nm, while at pH < 7.5 the absorbance shifts to ∼425 nm. For consistency, we used the 557 nm peak and diluted the standards and the samples with 0.1 M NaOH prior to spectral analysis. The absorbance spectra were then read, and the absorbance at 557 nm was used to quantify the phenol red concentration. The adsorption capacity was calculated as the milligram or millimole of dye immobilized on the nanoparticles per gram of nanoparticles. A standard curve of phenol red was made for each day. The means, standard deviations, and standard errors were calculated with Microsoft Excel.
Results and Discussion
We prepared an inherently cationic mesoporous silica nanoparticle, which shows relative high and fast adsorption to phenol red. First we characterized the material’s physical properties and binding capabilities. We then performed several control experiments to understand the mechanism of binding. Finally, we quantified the binding via kinetic and isotherm studies.
Nanoparticle Synthesis and Characterization
Six organosilica samples were made with different volume fractions of TSPA, that is, the percentage of TSPA relative to BTSE and TSPA. This fraction was changed from 0% to 100%. The product made with 100% TSPA was macroscopic and is not a nanoparticle (Figure 1F). The other samples were less than 150 nm. The 0, 20, 40, 60, and 80% OSNP were 128, 101, 136, 106, and 59 nm, respectively (Figure 1A–E). This size change may be due to the amine in the TSPA (inset, Figure 2A)—these groups can catalyze the reaction between silanes to form siloxane bonds and accelerate the hydrolysis/polymerization.43 This fast hydrolysis and polymerization prevents the diffusion of precursors and makes it difficult to generate large particles.44 Typical yields were 47%, 36%, 37%, 74%, 93%, and 101% for the 0%, 20%, 40%, 60%, 80%, and 100% TSPA batches. The higher yield at higher TSPA concentrations might be because of the catalytic property of TSPA for the hydrolysis/polymerization.43
Figure 1.

Characterization of the organosilica products. The organosilica products were prepared with TSPA and BTSE at different ratios. Panels (A–F) are TEM images of OSNP with different initial quantities of TSPA (0, 0.08, 0.16, 0.24, 0.42, and 0.4 mmol, respectively, corresponding to 0%, 20%, 40%, 60%, 80%, and 100% (v/v) of TSPA over total silica sources). (G) The amount of nitrogen in the OSNP increases as the TSPA fraction increases. (H) Zeta-potential of OSNP made with different fraction of TSPA shows a more positive surface charge as more TSPA is incorporated into the nanoparticle. Error bars in panel H represent the standard deviations of 6 measurements. (I) N2 adsorption–desorption isotherms of OSNP made with different fractions of TSPA indicate the mesoporous structure of OSNP.
Figure 2.

Phenol red adsorption capacity of OSNPs. Capacity changes with (A) TSPA, (B) nitrogen content, (C) zeta potential, and (D) BET surface area. Of the four parameters, the adsorption capacity is only positively dependent on the TSPA and nitrogen content. Error bars represent the standard error for more than 3 measurements (RT, t = 16 h, 5 mg OSNP, 0.5 mg/mL or 1.33 mM phenol red). Samples with more positive zeta potential sequestered more phenol red, but no further increase in adsorption capacity when the zeta potential was over 20 mV. The adsorption capacity increased up to a surface area of 220 m2/g and then decreased with increasing surface area.
The condensation of OSNP made with 80% TSPA was examined with solid state NMR. The OSNP is composed of 54.4% T3 and 27.1% T2 species45 (Figure S1). Washing with a NaCl/methanol solution effectively removed the templates as confirmed by FT-IR spectroscopy: the absorbance peaks at 2925, 2857, and 1462 cm–1 disappeared after washing (Figure S2), which correspond to the asymmetric, symmetric stretching, and bending vibrations of the C–H bonds in decane and CTAB.46
The nanoparticle composition affects the amine content, zeta potential, and surface area of the products. The nitrogen content in the organosilica made of 100%, 80%, 60%, 40%, 20%, and 0% TSPA were 4.23, 3.60, 3.14, 2.40, 1.92, and 0.03 mmol/g. The result showed the amount of nitrogen was positively dependent on the TSPA added (Figure 1G). The zeta became more positive with increasing TSPA and plateaued between 20% and 60%—higher TSPA concentrations (80%) had slightly lower zeta value (Figure 1H). On the other hand, the surface area and pore volume increase as the TSPA fraction increases from 0% to 60% and then decrease at 80% TSPA (Figure 1I). The BET surface areas of 0%, 40%, 60%, and 80% TSPA OSNPs were 66, 140, 362, and 216 m2/g. Their BJH pore volumes were 0.18, 0.58, 0.74, and 0.64 cm3/g. All samples have a type IV isotherm with a hysteresis loop at P/Po > 0.5 indicating a mesoporous structure.
Optimization and Evaluation of Phenol Red Adsorption Capacity
The adsorption capacity is dependent on the TSPA fraction and the amine content. As show in Figure 1G–I, the OSNP composition changes the amine content, zeta potential, and surface area. However, the adsorption capacity only increased as the TSPA and nitrogen (amine) content increased (Figure 2). The TSPA-containing nanoparticles removed 7- to 18-fold more dye than TSPA-free control nanoparticles. The most efficient removal occurred at 80% TSPA fraction. However, there was no such trend between adsorption capacity and zeta potential (Figure 2C) or surface area (Figure 2D). More positive OSNP (over +20 mV) sequestered more phenol red from the solution, but further increase in zeta potential did not increase dye sequestration. The adsorption capacity increased with surface area and reached a maximum near 220 m2/g; it then decreased with increasing surface area.
Next, we studied the effect of pH, ionic strength, dye concentration, and adsorbent dosage on the adsorption capacity (Figure 3). Wastewater can have a variety of pH values. For example, the pH of tannery wastewater varies between 2.0 and 12.8 during different operations.47 Thus, it is important for a remediation tool to work under a broad range of pH values. The pH is particularly important because it affects the surface charge of the adsorbents (Figure 3B) and dye ionization (Figure 3G). The adsorption capacity of OSNP toward phenol red was stable from pH 2 to 11 (Figure 3A) but changed dramatically at pH 1.2, 11.6, and 12.5.
Figure 3.

Effect of pH, ionic strength, dye concentration, and adsorbent dosage on phenol red adsorption capacity of OSNP. (A) The absorption capacity was reduced at extreme basic (pH >11) or acidic (<2) conditions. (B) OSNP is positive at pH 8.1, and it becomes negative at pH 9.6. (C) Adsorption capacity decreased as the ionic strength increased to 1 M and then decreased slowly as the ionic strength further increased. (D) The adsorption capacity was linearly dependent on the dye concentration when it is low. Panel (E) shows that the absorption capacity increased as the dye concentration increased and reached a peak at 1.67 mg/mL (4.4 mM), which then decreased as the concentration further increased to 3.3 mg/mL (8.8 mM). (F) The adsorption capacity decreased as the dosage of adsorbent increased. Error bars represent the standard deviation. (G) The structure of phenol red changes as the pH changes. The first acid dissociation constant is 1.2 and the second dissociation constant is 7.7.
The poor adsorption capacity at pH 1.2 is likely due to a structural change in phenol red (Figure 3G). At low pH (<1.2), the phenol red is zwitterionic48 and it is difficult for the phenol red to be adsorbed by the OSNP through electronic attraction forces. In addition, more than 56% of the amines on the OSNP are protonated at pH 1 as shown by XPS compared to only ∼24% at pH 2 (Figure S3); hence, hydrogen bonding is difficult at pH 1. On the other hand, OSNP at pH 12 or 13 cannot adsorb any phenol red due to the electrostatic repulsion forces between the negative OSNP (Figure 3A) and the deprotonated negative phenol red (Figure 3G).
Ionic strength is another important parameter in regulating the adsorption of charged moieties because it can compete with the dye or adsorbents in the solution. To understand the effect of ionic strength on the adsorption capacity of the OSNP, the ionic strength was adjusted with NaCl to a broad range from 0 to 4 M. Figure 3C shows that the adsorption capacity decreased as the ionic strength increased from 0 to 0.5 M, and then decreased slowly as the ionic strength further increased to 4 M, which indicates the adsorption mechanism may be due to the electrostatic interactions.
The effect of dye concentration was studied from 0 to 0.33 mg/mL (0.88 mM) because typical effluent dye concentrations are 0.001 mg/mL to 0.25 mg/mL.49 The adsorption capacity is linear with the phenol red concentration (Figure 3D), but plateaus near 2 mg/mL (5.31 mM) (Figure 3E) because the active binding sites on the nanoparticles become saturated at high dye concentrations.
We studied the effect of adsorbent dosage (0, 0.038, 0.075, 0.15, 0.3, 0.6, 1.2, and 2.4 mg) on the adsorption capacity. The capacity increased with decreasing adsorbent dose (Figure 3F). Remarkably, the adsorption was performed at RT, pH ≈ 2.6, 0.067 mg/mL (0.177 mM) phenol red; the maximum adsorption reached to almost 201 mg/g (0.53 mmol/g) at adsorbents dosage of 37.5 μg.
Selective Adsorption of Anionic Dye
We tried to extract phenol red from a mixture of phenol red and methylene blue. The OSNP adsorbed only phenol red (>95%) even at phenol red:methylene blue ratios of 1:10 and 1:1 (Figure 4A, B); no methylene blue was adsorbed. At phenol red:methylene blue of 10:1, around 84% of phenol red and 5% of MB was adsorbed (Figure 4C). The inset shows the color change of each dye and their mixtures before and after adsorption. The OSNP turned pink after exposure to phenol red suggesting that the OSNP are basic. The color differences in the insets between the dyes are due to the concentration changes (Figure 4 insets).
Figure 4.
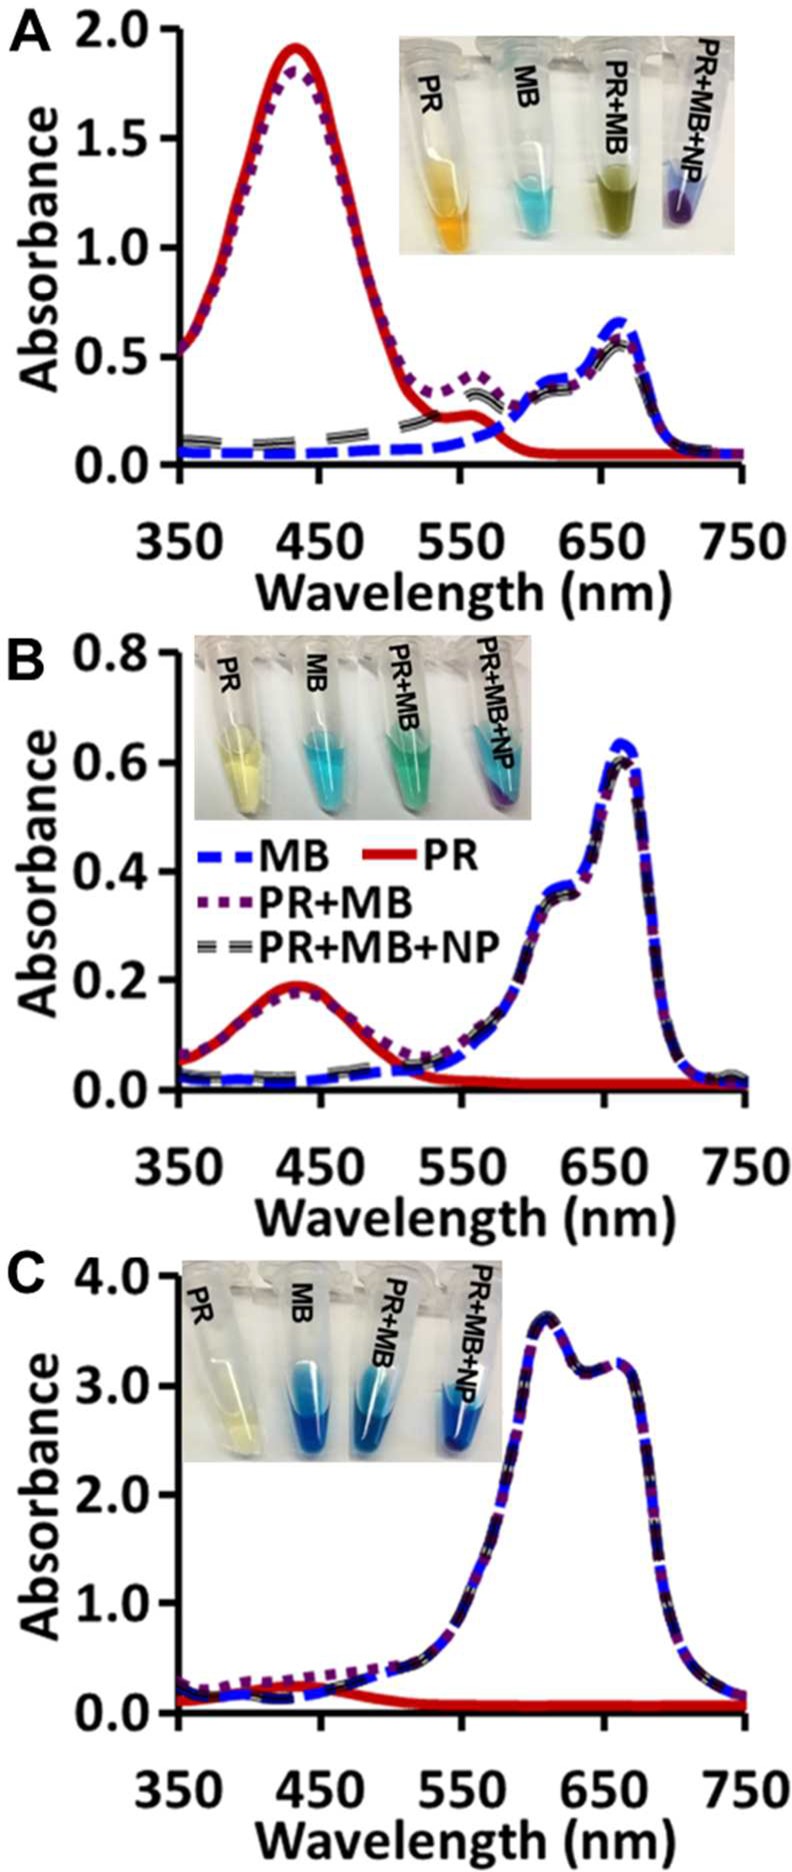
Selective adsorption of anionic dye. Absorbance of phenol red, methylene blue, and their mixture before and after addition of OSNP at different phenol red:methylene blue ratios. (A) 10:1, (B) 1:1, and (C) 1:10. The inset images show that the OSNP turned pink after being added to the mixture indicating the basic nature of the OSNP. The absorbance spectra of the supernatants show only adsorption for phenol red but not methylene blue.
Reusability of the OSNP
Reusability is a critical property of adsorbents due to cost and environment concerns. To achieve good reusability, desorption should be easy and release active sites for readsorption. In this study, the phenol red was adsorbed by the OSNP in acidic solution, followed by desorption in NaOH (0.017 M) solution. Figure 5E shows the significant change of supernatant after adsorption in acidic dye solution and after washing with 0.017 M NaOH. The OSNP turned from white to pink after phenol red adsorption, and turned back to white after washing with NaOH solution (Figure 5B).
Figure 5.
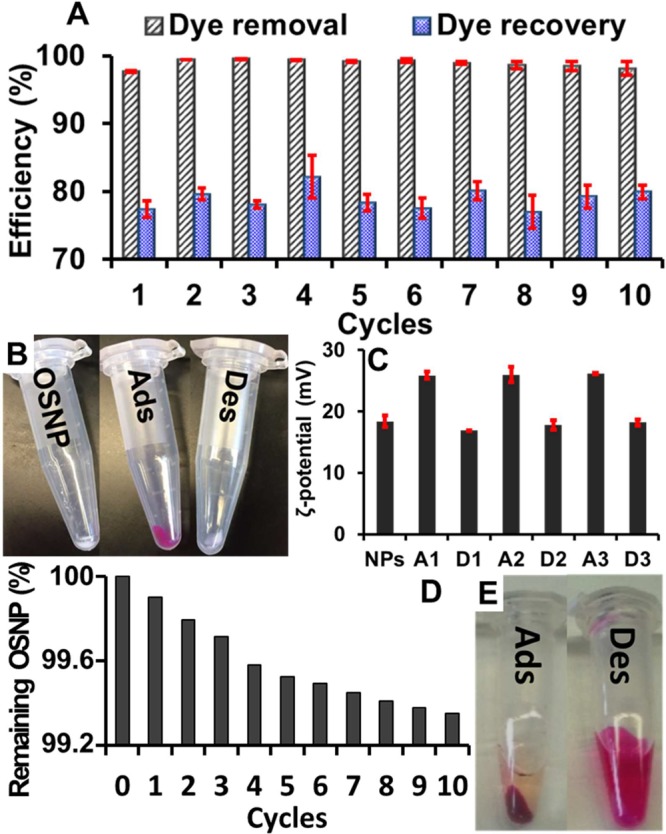
Reusability of OSNP for dye adsorption. (A) The OSNP can be reused for phenol red adsorption (t = 5 min, pH = 2 treatment, RT, 0.25 mg/mL or 0.66 mM phenol red, 2 mg of OSNP). Error bars represent the standard deviation for 3 measurements. (B) The OSNP changed from white to pink after addition to phenol red solutions and centrifugation due to adsorption (Ads.), but they became white again after base treatment due to dye desorption (Des.). (C) Change of zeta potential after dye adsorption and recovery of zeta potential after dye desorption. NPs represent the original OSNP; A1, A2, and A3 represent NPs after adsorption in cycles 1, 2, and 3; D1, D2, and D3 represent NPs after desorption in cycle 1, 2, and 3. (D) The accumulative loss of loss in the first 10 cycles. (E) The color of supernatant after desorption was more intense than after adsorption indicating a high adsorption and desorption efficiency.
The adsorption/desorption was performed 10 time. The dye removal efficiency is 97.7%, 99.4%, 99.5%, 99.4%, 99.2%, 99.3%, 98.9%, 98.6%, 98.4%, and 98.1% from cycle 1 to 10 (standard deviation of 0.62%); the corresponding average dye recovery efficiency are around 77.4%, 79.6%, 78.1%, 82.2%, 78.3%, 77.6%, 80.0%, 77.0%, 79.2%, and 79.9% (standard deviation of 1.6%) (Figure 5A). The zeta potential of the OSNP after adsorption and desorption is also “recyclable”. The zeta potential of OSNP increased after adsorption of phenol red, and returned to baseline after desorption (Figure 5C). The changes in the zeta potential were consistent between cycles. This indicates that the dye removal and recovery were stable for at least 10 cycles.
ICP-OES was used to measure the silicon loss during desorption with NaOH. The accumulative loss of OSNP after 10 cycles is around 0.65% (Figure 5D). The average OSNP loss per cycle is 0.065%, which means the OSNP will be depleted theoretically after more than 1500 cycles. However, the adsorption capacity was not diminished due to this loss of OSNPs. This might be because additional intrinsic amine groups are found throughout the OSNP, that is, there will be new binding sites on the surface even when the original binding sites are partially lost.
Moreover, the CHN analysis indicated that there were 7.2 μmol of nitrogen binding sites per 2 mg of OSNP (Figure 1G), and for each reuse cycle there were 0.13 μmol of phenol red bound to 2 mg OSNP (Figure 5A). Therefore, even under the worst-case scenario in which each nitrogen can participate in only one binding event, the OSNPs could still be theoretically reused more than 50 times.
Adsorption Mechanism
We hypothesized that the adsorption of phenol red by OSNP is due to both electrostatic attraction, as well as hydrogen bonding. The amine groups can form a strong hydrogen bond (29 kJ/mol) with the hydroxide on phenol red.50 To verify our hypothesis, we compared the adsorption of OSNP to four dyes including methylene blue, rhodamine B, phenol red, rose bengal (Figure 6B–E) with acid dissociation constants (pKa) of 3.8,51 3.7,52 7.7,48 and 4.7,53 respectively.
Figure 6.
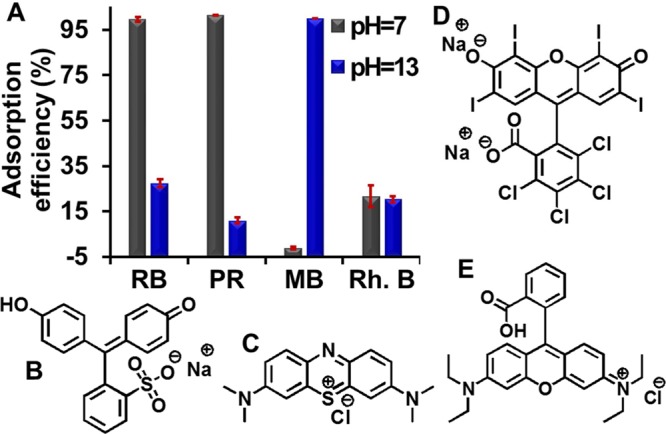
Adsorption mechanism. (A) Adsorption of OSNP to four dyes, including (B) phenol red (PR, pKa = 7.748), (C) methylene blue (MB, pKa = 3.851), (D) rose bengal (RB, pKa = 4.753), and (E) rhodamine B (Rh. B, pKa = 3.752). Positive OSNP (at pH 7) has a high adsorption to negative RB and PR, a low adsorption to zwitterionic Rh. B, and no adsorption to positive MB; while the negative OSNP (at pH 13) has a high adsorption to MB, small adsorption to RB, PR, and Rh. B.
At pH 7, nearly all phenol red and rose bengal were adsorbed, but not the methylene blue or rhodamine B (Figure 6A). At pH 7, methylene blue is positive, phenol red48 and rose bengal are negative, rhodamine B is zwitterionic, and the OSNP is positive (Figure 3B). Phenol red and rose bengal are attracted by the OSNP, while methylene blue is repelled by the OSNP. At pH 13, the OSNP is negative (Figure 3B), and the adsorption behavior changed dramatically: only a small amount of phenol red and rose bengal were adsorbed, but nearly all methylene blue is adsorbed. Thus, we conclude that electrostatic forces are the primary adsorption mechanism because much more negative phenol red were adsorbed compared to zwitterionic rhodamine B at pH 7, when both of them can form hydrogen bonding with the amine on the OSNP.
To further confirm the contribution of hydrogen bonding, we compared the adsorption of rose bengal and phenol red at 0.3 mM at pH 7, when only phenol red can form hydrogen bonds with the OSNP. The results showed about 97.5% of phenol red and 94.9% of rose bengal were adsorbed. Therefore, we found that the amine loading level is the most important factor governing dye adsorption. The mechanism of adsorption is mainly electrostatic forces and hydrogen bond arising from the amine groups on the OSNP.
Kinetics
The adsorption of phenol red happened immediately upon contact, and the adsorption efficiency is related to the initial dye concentrations. When the dye concentration is equal to or smaller than 0.08 mg/mL (0.21 mM), about 100% of the dye is adsorbed within 5 min (Figure 7A). At other concentrations, the dye adsorbed within the first 5 min. This is over 85% of the dye adsorbed within the first hour. We also performed a long-term adsorption at 0.5 mg/mL (1.33 mM). The results showed that most adsorption occurred within the first 30 min; more dye can be sequestered slowly over the subsequent 3 days (Figure 7B).
Figure 7.

Adsorption kinetics. (A) Short-term adsorption efficiency of phenol red by OSNP is different when the dye concentration changes. The adsorption efficiency decreases as the dye concentration increases. (B) Long-term adsorption when the dye concentration is 0.5 mg/mL (1.33 mM) (pH = 7, RT, 0.75 mg of OSNP). The inset shows the PR adsorption within the first 5 h. The axes on the inset are the same as in the larger data set. Most adsorption happened within the first 30 min. More dye can be sequestered slowly over the subsequent 3 days. Error bars represent the standard deviations for 3 measurements. Plots based on (C) pseudo-first-order and (D) pseudo-second-order adsorption models show that the pseudo-second-order adsorption model is a better fit for the phenol red adsorption.
To evaluate the rate and mechanism of mass transfer of phenol red from liquid phase to the OSNP surface, pseudo-first-order and pseudo-second-order kinetics models were investigated to understand the mechanism of phenol red sorption onto the OSNP. The pseudo-first-order model was summarized by Lagergren54 as seen in eq 1. The pseudo-second-order rate equation was described by McKay and Ho15 and is shown in eq 2.
| 1 |
| 2 |
Here, Qe and Qt are the adsorption capacities (mg/g) at equilibrium and at time t; K1 (1/min) and K2 (g/mg min) are the rate constants. Figure 7C, D shows the graphs plotted based on two kinetics models, and Table 1 summarizes the values of Qe, K1, K2, and R2. The results show that the adsorption of phenol red is better described by the pseudo-second-order kinetics model, which indicates that the rate limiting step involves chemisorption of the adsorbate onto the adsorbent.22
Table 1. Parameters of Pseudo-First-Order and Pseudo-Second-Order Kinetics for the Adsorption of Phenol Red on the OSNP.
| kinetic models | Qe | K1 | K2 | R2 |
|---|---|---|---|---|
| pseudo-first-order | 87.24 mg/g (0.23 mmol/g) | 0.19 min–1 | 0.9597 | |
| pseudo-second-order | 83.21 mg/g (0.22 mmol/g) | 0.0033 g/mg min (1.24 g/mmol min) | 0.9959 |
Isotherms
Adsorption isotherms are valuable tools to assess the distribution of solute between the solid and liquid phases, and the adsorption isotherm parameters reflect the adsorption capacity and energy change during adsorption.55 We applied both Langmuir and Freundlich isotherm models to the phenol red-OSNP system (Figure 8).
Figure 8.
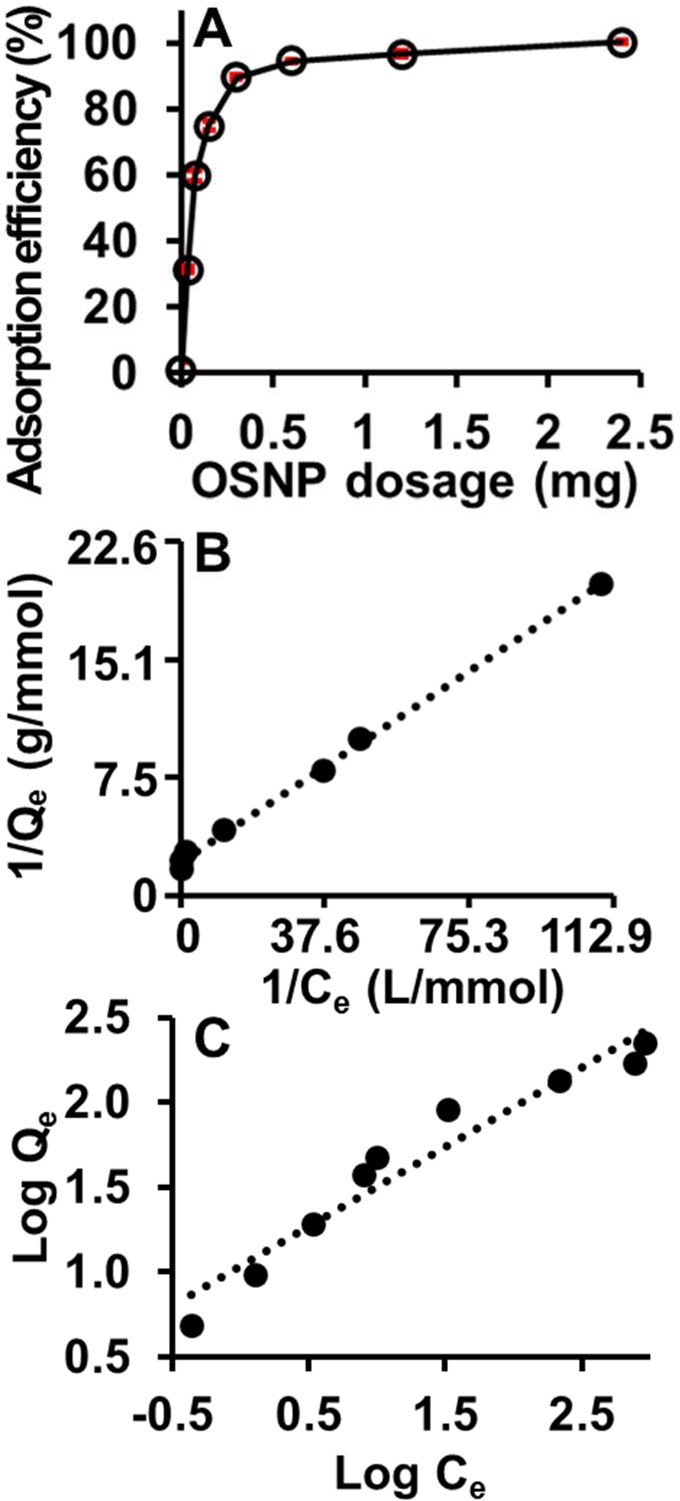
Effect of adsorbent dosage on phenol red removal efficiency and adsorption isotherms. (A) The adsorption increased as the OSNP amount increased. Error bars represent the standard deviation of 3 measurements. (B) Langmuir adsorption isotherms shows a linear plot (R2 = 0.9977), which indicates that the adsorption of phenol red is a monolayer and occurs at specific homogeneous sites within the adsorbent. (C) The Freundlich adsorption isotherms are less linear with R2 = 0.9392 compared to the Langmuir adsorption.
We studied the isotherms by change the adsorbent dosage (0, 0.038, 0.075, 0.15, 0.3, 0.6, 1.2, and 2.4 mg). The total amount of adsorbed dye increased with the dose of adsorbent and reached almost 100% with 2.4 mg OSNP (Figure 8A) because there were more active sites for adsorption.
The Langmuir adsorption isotherm11,55 assumes that adsorption occurs at specific homogeneous sites within the adsorbents and forms a monolayer on the homogeneous surfaces. The linear form of the Langmuir equation is
| 3 |
Here, Qe is the amount of adsorbate adsorbed per unit mass of adsorbent (mg/g), Ce is the equilibrium concentration of the adsorbate (mg/L), Qm (mg/g) is the theoretical maximum adsorption capacity, and b (L/mg) is the energy of adsorption. Another important Langmuir constant is separation factor (RL), which is defined by eq 4
| 4 |
where Co (mg/L) is the initial adsorbate concentration. The separation factor is related to the feasibility of the adsorption including unfavorable (RL > 1), linear (RL = 1), favorable (0 < RL < 1), and irreversible (RL = 0).56
The Freundlich adsorption isotherm57,58 is an empirical equation based on the assumption that adsorption process occurs at heterogeneous surfaces having different available binding sites with unequally energies of adsorption. Therefore, this isotherm indicates that the adsorption is not a monolayer and the adsorption sites with greater affinity are occupied first. The Freundlich model is given by the relation
| 5 |
where Kf is the Freundlich constant, corresponding to adsorption capacity, and 1/n is the heterogeneity factor—a parameter for adsorption intensity and surface heterogeneity. The favorable range of 1/n is between 0 and 1.59
Figure 8B and C fit the Langmuir and Freundlich isotherms to the phenol red-OSNP systems, respectively. The calculated parameters are shown in Table 2. The linear relationship between 1/Qe and 1/Ce indicates that the Langmuir isotherm holds for the phenol red-OSNP system (Figure 8B). The linear relationship between 1/Qe and 1/Ce also explained why the adsorption capacity increased when the dye concentration increased (Figure 7A). Both Langmuir and Freundlich models indicated the favorable adsorption of phenol red by the OSNP. In addition, the adsorption of phenol red by the OSNP is better estimated by the Langmuir isotherm than the Freundlich.
Table 2. Langmuir and Freundlich Isotherms Parameters for the Adsorption of Phenol Red on OSNP.
| parameters | values | |
|---|---|---|
| Langmuir | Qm | 175.44 mg/g (0.46 mmol/g) |
| b | 0.04 L/mg (15.05 L/mmol) | |
| RL | 0.26 | |
| R2 | 0.9977 | |
| Freundlich | Kf | 10.74 mg/g (0.03 mmol/g) |
| 1/n | 0.47 | |
| R2 | 0.9392 |
The theoretical maximum Langmuir adsorption capacity was calculated to be 175.44 mg/g (0.47 mmol/g). The adsorption capacity of the OSNP to phenol red is higher than most reported natural or synthetic adsorbents. We compared the theoretical Langmuir maximum adsorption capacity of the OSNP for phenol red with other reported adsorbents for phenol derivatives and found that the OSNP were better than 67 of 77 reported adsorbents including both commercial and noncommercial sources derivatives.57,58,60,61
Conclusions
An organosilica nanoparticle with intrinsic active binding sites for dye adsorption was synthesized and characterized. The binding property of the OSNP primarily depends on the amount of amine groups on the nanoparticles. The OSNP made with 80% TSPA has the highest adsorption capacity. The OSNP adsorbs dyes through electrostatic attraction and hydrogen bonding. The OSNP can adsorb either anionic or cationic dye by changing the particle zeta potential. Taking advantage of this unique adsorption property, we demonstrated the OSNP can extract phenol red from its mixture with methylene blue. We believe the OSNP can also be used for similar species including in drug delivery or imaging agents.
Using phenol red as a model dye, we found the experimental maximum dye adsorption is over 200 mg/g (0.53 mmol/g), and the theoretical maximum dye adsorption is around 175 mg/g (0.47 mmol/g). The adsorption efficiency can reach 100% at room temperature and neutral pH when the phenol red concentration equals the typical concentration in cell culture media. Adsorption occurred within 5 min. The Langmuir model was a better fit than the Freundlich model. Moreover, the OSNP can be reused for over 10 cycles without diminishing the adsorption and desorption efficiencies.
In a summary, the high yield, high adsorption capacity, and excellent reusability highlight the utility of OSNPs for environmental remediation. The results highlight that OSNPs with amine groups are an effective adsorbent material for environment remediation. They have fast adsorption, high removal efficiency, high adsorption capacity, tunable adsorption ability for different dyes, and reusability. To the best of our knowledge, this is the first example of mesoporous silica nanoparticles with intrinsic amine groups applied to dye remediation.
Acknowledgments
J.V.J. acknowledges funding from NIH HL117048 and HL137187 and infrastructure from S10 OD021821. We also acknowledge the contributions of Dr. Ignacio Martini at the University of California, Los Angeles for help with XPS experiments. The authors acknowledge the financial support of the EPSRC (EP/L026287/1). The authors also thank the American Cancer Society Institutional Research (grant number 14-250-42) provided through the Moores Cancer Center, University of California, San Diego.
Supporting Information Available
The Supporting Information is available free of charge on the ACS Publications website at DOI: 10.1021/acsami.7b04181.
Solid-state NMR of the OSNP, FTIR spectra of OSNP before and after washed with NaCl/methanol solution, and XPS of OSNP at different pH (PDF)
The authors declare no competing financial interest.
Supplementary Material
References
- Flörke M.; Kynast E.; Bärlund I.; Eisner S.; Wimmer F.; Alcamo J. Domestic and Industrial Water Uses of the Past 60 Years as a Mirror of Socio-Economic Development: A Global Simulation Study. Global Environmental Change 2013, 23, 144–156. 10.1016/j.gloenvcha.2012.10.018. [DOI] [Google Scholar]
- Lu Y.; Song S.; Wang R.; Liu Z.; Meng J.; Sweetman A. J.; Jenkins A.; Ferrier R. C.; Li H.; Luo W.; Wang T. Impacts of Soil and Water Pollution on Food Safety and Health Risks in China. Environ. Int. 2015, 77, 5–15. 10.1016/j.envint.2014.12.010. [DOI] [PubMed] [Google Scholar]
- Ebenstein A. The Consequences of Industrialization: Evidence from Water Pollution and Digestive Cancers in China. Review of Economics and Statistics 2012, 94, 186–201. 10.1162/REST_a_00150. [DOI] [Google Scholar]
- Roosta M.; Ghaedi M.; Daneshfar A.; Sahraei R.; Asghari A. Optimization of the Ultrasonic Assisted Removal of Methylene Blue by Gold Nanoparticles Loaded on Activated Carbon Using Experimental Design Methodology. Ultrason. Sonochem. 2014, 21, 242–252. 10.1016/j.ultsonch.2013.05.014. [DOI] [PubMed] [Google Scholar]
- Robinson T.; McMullan G.; Marchant R.; Nigam P. Remediation of Dyes in Textile Effluent: A Critical Review on Current Treatment Technologies with a Proposed Alternative. Bioresour. Technol. 2001, 77, 247–255. 10.1016/S0960-8524(00)00080-8. [DOI] [PubMed] [Google Scholar]
- Yagub M. T.; Sen T. K.; Afroze S.; Ang H. M. Dye and Its Removal from Aqueous Solution by Adsorption: A Review. Adv. Colloid Interface Sci. 2014, 209, 172–184. 10.1016/j.cis.2014.04.002. [DOI] [PubMed] [Google Scholar]
- Willmott N.; Guthrie J.; Nelson G. The Biotechnology Approach to Colour Removal from Textile Effluent. J. Soc. Dyers Colour. 1998, 114, 38–41. 10.1111/j.1478-4408.1998.tb01943.x. [DOI] [Google Scholar]
- Moran C.; Hall M. E.; Howell R. Effects of Sewage Treatment on Textile Effluent. J. Soc. Dyers Colour. 1997, 113, 272–274. 10.1111/j.1478-4408.1997.tb01847.x. [DOI] [Google Scholar]
- Wang Y.-F.; Gao B.-Y.; Yue Q.-Y.; Wang Y.; Yang Z.-L. Removal of Acid and Direct Dye by Epichlorohydrin–Dimethylamine: Flocculation Performance and Floc Aggregation Properties. Bioresour. Technol. 2012, 113, 265–271. 10.1016/j.biortech.2011.11.106. [DOI] [PubMed] [Google Scholar]
- Raghavacharya C. Colour Removal from Industrial Effluents: A Comparative Review of Available Technologies. Chemical Engineering World 1997, 32, 53–54. [Google Scholar]
- Abd El-Rahim W. M.; Moawad H.; Khalafallah M. Microflora Involved in Textile Dye Waste Removal. J. Basic Microbiol. 2003, 43, 167–174. 10.1002/jobm.200390019. [DOI] [PubMed] [Google Scholar]
- Ghaedi M.; Hassanzadeh A.; Kokhdan S. N. Multiwalled Carbon Nanotubes as Adsorbents for the Kinetic and Equilibrium Study of the Removal of Alizarin Red S and Morin. J. Chem. Eng. Data 2011, 56, 2511–2520. 10.1021/je2000414. [DOI] [Google Scholar]
- Gupta V. K.; Gupta B.; Rastogi A.; Agarwal S.; Nayak A. A Comparative Investigation on Adsorption Performances of Mesoporous Activated Carbon Prepared from Waste Rubber Tire and Activated Carbon for a Hazardous Azo Dye-Acid Blue 113. J. Hazard. Mater. 2011, 186, 891–901. 10.1016/j.jhazmat.2010.11.091. [DOI] [PubMed] [Google Scholar]
- Ramakrishna K. R.; Viraraghavan T. Dye Removal Using Low Cost Adsorbents. Water Sci. Technol. 1997, 36, 189–196. 10.1016/S0273-1223(97)00387-9. [DOI] [Google Scholar]
- Ho Y.-S.; McKay G. Sorption of Dye from Aqueous Solution by Peat. Chem. Eng. J. 1998, 70, 115–124. 10.1016/S0923-0467(98)00076-1. [DOI] [Google Scholar]
- Gupta V. K.; Jain R.; Varshney S. Removal of Reactofix Golden Yellow 3 Rfn from Aqueous Solution Using Wheat Husk - an Agricultural Waste. J. Hazard. Mater. 2007, 142, 443–448. 10.1016/j.jhazmat.2006.08.048. [DOI] [PubMed] [Google Scholar]
- Robinson T.; Chandran B.; Nigam P. Effect of Pretreatments of Three Waste Residues, Wheat Straw, Corncobs and Barley Husks on Dye Adsorption. Bioresour. Technol. 2002, 85, 119–124. 10.1016/S0960-8524(02)00099-8. [DOI] [PubMed] [Google Scholar]
- Ferrero F. Dye Removal by Low Cost Adsorbents: Hazelnut Shells in Comparison with Wood Sawdust. J. Hazard. Mater. 2007, 142, 144–152. 10.1016/j.jhazmat.2006.07.072. [DOI] [PubMed] [Google Scholar]
- Poots V.; McKay G.; Healy J. Removal of Basic Dye from Effluent Using Wood as an Adsorbent. Journal of the Water Pollution Control Federation 1978, 926–935. [Google Scholar]
- Dawood S.; Sen T. K. Removal of Anionic Dye Congo Red from Aqueous Solution by Raw Pine and Acid-Treated Pine Cone Powder as Adsorbent: Equilibrium, Thermodynamic, Kinetics, Mechanism and Process Design. Water Res. 2012, 46, 1933–1946. 10.1016/j.watres.2012.01.009. [DOI] [PubMed] [Google Scholar]
- Mahmoodi N. M.; Hayati B.; Arami M.; Lan C. Adsorption of Textile Dyes on Pine Cone from Colored Wastewater: Kinetic, Equilibrium and Thermodynamic Studies. Desalination 2011, 268, 117–125. 10.1016/j.desal.2010.10.007. [DOI] [Google Scholar]
- Nayab S.; Farrukh A.; Oluz Z.; Tuncel E. l.; Tariq S. R.; Rahman H. u.; Kirchhoff K.; Duran H.; Yameen B. Design and Fabrication of Branched Polyamine Functionalized Mesoporous Silica: An Efficient Absorbent for Water Remediation. ACS Appl. Mater. Interfaces 2014, 6, 4408–4417. 10.1021/am500123k. [DOI] [PubMed] [Google Scholar]
- Karim A. H.; Jalil A. A.; Triwahyono S.; Sidik S. M.; Kamarudin N. H. N.; Jusoh R.; Jusoh N. W. C.; Hameed B. H. Amino Modified Mesostructured Silica Nanoparticles for Efficient Adsorption of Methylene Blue. J. Colloid Interface Sci. 2012, 386, 307–314. 10.1016/j.jcis.2012.07.043. [DOI] [PubMed] [Google Scholar]
- Mahmoodi N. M.; Khorramfar S.; Najafi F. Amine-Functionalized Silica Nanoparticle: Preparation, Characterization and Anionic Dye Removal Ability. Desalination 2011, 279, 61–68. 10.1016/j.desal.2011.05.059. [DOI] [Google Scholar]
- Mahmoodi N. M.; Maghsoudi A.; Najafi F.; Jalili M.; Kharrati H. Primary-Secondary Amino Silica Nanoparticle: Synthesis and Dye Removal from Binary System. Desalin. Water Treat. 2014, 52, 7784–7796. 10.1080/19443994.2013.833872. [DOI] [Google Scholar]
- Yan Z.; Tao S. Y.; Yin J. X.; Li G. T. Mesoporous Silicas Functionalized with a High Density of Carboxylate Groups as Efficient Absorbents for the Removal of Basic Dyestuffs. J. Mater. Chem. 2006, 16, 2347–2353. 10.1039/b600611f. [DOI] [Google Scholar]
- Ho K. Y.; McKay G.; Yeung K. L. Selective Adsorbents from Ordered Mesoporous Silica. Langmuir 2003, 19, 3019–3024. 10.1021/la0267084. [DOI] [Google Scholar]
- Kaehr B.; Townson J. L.; Kalinich R. M.; Awad Y. H.; Swartzentruber B. S.; Dunphy D. R.; Brinker C. J. Cellular Complexity Captured in Durable Silica Biocomposites. Proc. Natl. Acad. Sci. U. S. A. 2012, 109, 17336–17341. 10.1073/pnas.1205816109. [DOI] [PMC free article] [PubMed] [Google Scholar]
- Su X.; Kuang L.; Battle C.; Shaner T.; Mitchell B. S.; Fink M. J.; Jayawickramarajah J. Mild Two-Step Method to Construct DNA-Conjugated Silicon Nanoparticles: Scaffolds for the Detection of Microrna-21. Bioconjugate Chem. 2014, 25, 1739–1743. 10.1021/bc5004026. [DOI] [PMC free article] [PubMed] [Google Scholar]
- Chen F.; Zhu Y. Chitosan Enclosed Mesoporous Silica Nanoparticles as Drug Nano-Carriers: Sensitive Response to the Narrow Ph Range. Microporous Mesoporous Mater. 2012, 150, 83–89. 10.1016/j.micromeso.2011.07.023. [DOI] [Google Scholar]
- Kempen P. J.; Greasley S.; Parker K. A.; Campbell J. L.; Chang H.-Y.; Jones J. R.; Sinclair R.; Gambhir S. S.; Jokerst J. V. Theranostic Mesoporous Silica Nanoparticles Biodegrade after Pro-Survival Drug Delivery and Ultrasound/Magnetic Resonance Imaging of Stem Cells. Theranostics 2015, 5, 631–642. 10.7150/thno.11389. [DOI] [PMC free article] [PubMed] [Google Scholar]
- Palanikumar L.; Choi E. S.; Cheon J. Y.; Joo S. H.; Ryu J. H. Noncovalent Polymer - Gatekeeper in Mesoporous Silica Nanoparticles as a Targeted Drug Delivery Platform. Adv. Funct. Mater. 2015, 25, 957–965. 10.1002/adfm.201402755. [DOI] [Google Scholar]
- Slowing II; Vivero-Escoto J. L.; Wu C. W.; Lin V. S. Mesoporous Silica Nanoparticles as Controlled Release Drug Delivery and Gene Transfection Carriers. Adv. Drug Delivery Rev. 2008, 60, 1278–1288. 10.1016/j.addr.2008.03.012. [DOI] [PubMed] [Google Scholar]
- Foroutan F.; Jokerst J. V.; Gambhir S. S.; Vermesh O.; Kim H.-W.; Knowles J. C. Sol–Gel Synthesis and Electrospraying of Biodegradable (P2o5)55–(Cao)30–(Na2o)15 Glass Nanospheres as a Transient Contrast Agent for Ultrasound Stem Cell Imaging. ACS Nano 2015, 9, 1868–1877. 10.1021/nn506789y. [DOI] [PMC free article] [PubMed] [Google Scholar]
- Zhang K.; Chen H.; Guo X.; Zhang D.; Zheng Y.; Zheng H.; Shi J. Double-Scattering/Reflection in a Single Nanoparticle for Intensified Ultrasound Imaging. Sci. Rep. 2015, 5, 8766–8776. 10.1038/srep08766. [DOI] [PMC free article] [PubMed] [Google Scholar]
- Wang Y.; Pu K.-Y.; Liu B. Anionic Conjugated Polymer with Aptamer-Functionalized Silica Nanoparticle for Label-Free Naked-Eye Detection of Lysozyme in Protein Mixtures. Langmuir 2010, 26, 10025–10030. 10.1021/la100139p. [DOI] [PubMed] [Google Scholar]
- Krysztafkiewicz A.; Binkowski S.; Jesionowski T. Adsorption of Dyes on a Silica Surface. Appl. Surf. Sci. 2002, 199, 31–39. 10.1016/S0169-4332(02)00248-9. [DOI] [Google Scholar]
- Etienne M.; Walcarius A. Analytical Investigation of the Chemical Reactivity and Stability of Aminopropyl-Grafted Silica in Aqueous Medium. Talanta 2003, 59, 1173–1188. 10.1016/S0039-9140(03)00024-9. [DOI] [PubMed] [Google Scholar]
- Asenath Smith E.; Chen W. How to Prevent the Loss of Surface Functionality Derived from Aminosilanes. Langmuir 2008, 24, 12405–12409. 10.1021/la802234x. [DOI] [PMC free article] [PubMed] [Google Scholar]
- Chen F.; Ma M.; Wang J.; Wang F.; Chern S. X.; Zhao E. R.; Jhunjhunwala A.; Darmadi S.; Chen H.; Jokerst J. V. Exosome-Like Silica Nanoparticles: A Novel Ultrasound Contrast Agent for Stem Cell Imaging. Nanoscale 2017, 9, 402–411. 10.1039/C6NR08177K. [DOI] [PMC free article] [PubMed] [Google Scholar]
- Wang Y.; Gao Q.; You Q.; Liao G.; Xia H.; Wang D. Porous Polyimide Framework: A Novel Versatile Adsorbent for Highly Efficient Removals of Azo Dye and Antibiotic. React. Funct. Polym. 2016, 103, 9–16. 10.1016/j.reactfunctpolym.2016.04.004. [DOI] [Google Scholar]
- Kallury K. M. R.; Debono R. F.; Krull U. J.; Thompson M. Covalent Binding of Amino, Carboxy, and Nitro-Substituted Aminopropyltriethoxysilanes to Oxidized Silicon Surfaces and Their Interaction with Octadecanamine and Octadecanoic Acid Studied by X-Ray Photoelectron Spectroscopy and Ellipsometry. J. Adhes. Sci. Technol. 1991, 5, 801–814. 10.1163/156856191X00224. [DOI] [Google Scholar]
- Asenath-Smith E.; Chen W. How to Prevent the Loss of Surface Functionality Derived from Aminosilanes. Langmuir 2008, 24, 12405–12409. 10.1021/la802234x. [DOI] [PMC free article] [PubMed] [Google Scholar]
- Wan Y.; Zhao D. Y. On the Controllable Soft-Templating Approach to Mesoporous Silicates. Chem. Rev. 2007, 107, 2821–2860. 10.1021/cr068020s. [DOI] [PubMed] [Google Scholar]
- Asefa T.; MacLachlan M. J.; Coombs N.; Ozin G. A. Periodic Mesoporous Organosilicas with Organic Groups inside the Channel Walls. Nature 1999, 402, 867–871. 10.1038/47229. [DOI] [Google Scholar]
- Hao N.; Yang H.; Li L.; Li L.; Tang F. The Shape Effect of Mesoporous Silica Nanoparticles on Intracellular Reactive Oxygen Species in A375 Cells. New J. Chem. 2014, 38, 4258–4266. 10.1039/C4NJ00736K. [DOI] [Google Scholar]
- Raghava Rao J.; Chandrababu N. K.; Muralidharan C.; Nair B. U.; Rao P. G.; Ramasami T. Recouping the Wastewater: A Way Forward for Cleaner Leather Processing. J. Cleaner Prod. 2003, 11, 591–599. 10.1016/S0959-6526(02)00095-1. [DOI] [Google Scholar]
- Tamura Z.; Maeda M. Differences between Phthaleins and Sulfonphthaleins. Yakugaku Zasshi 1997, 117, 764–770. 10.1248/yakushi1947.117.10-11_764. [DOI] [PubMed] [Google Scholar]
- Ghaly A.; Ananthashankar R.; Alhattab M.; Ramakrishnan V. Production, Characterization and Treatment of Textile Effluents: A Critical Review. Journal of Chemical Engineering & Process Technology 2014, 5, 1–18. [Google Scholar]
- Larson J. W.; McMahon T. B. Gas-Phase Bihalide and Pseudobihalide Ions. An Ion Cyclotron Resonance Determination of Hydrogen Bond Energies in Xhy- Species (X, Y = F, Cl, Br, Cn). Inorg. Chem. 1984, 23, 2029–2033. 10.1021/ic00182a010. [DOI] [Google Scholar]
- He X.; Male K. B.; Nesterenko P. N.; Brabazon D.; Paull B.; Luong J. H. Adsorption and Desorption of Methylene Blue on Porous Carbon Monoliths and Nanocrystalline Cellulose. ACS Appl. Mater. Interfaces 2013, 5, 8796–8804. 10.1021/am403222u. [DOI] [PubMed] [Google Scholar]
- Merouani S.; Hamdaoui O.; Saoudi F.; Chiha M. Sonochemical Degradation of Rhodamine B in Aqueous Phase: Effects of Additives. Chem. Eng. J. 2010, 158, 550–557. 10.1016/j.cej.2010.01.048. [DOI] [PubMed] [Google Scholar]
- Sabnis R.Handbook of Biological Dyes and Stains: Synthesis and Industrial Applications, 1st ed.; John Wiley & Sons: Hoboken, NJ, 2010. [Google Scholar]
- Lagergren S. About the Theory of So-Called Adsorption of Soluble Substances. Kungliga Svenska Vetenskapsakademiens Handlingar 1898, 24, 1–39. [Google Scholar]
- Foo K. Y.; Hameed B. H. Insights into the Modeling of Adsorption Isotherm Systems. Chem. Eng. J. 2010, 156, 2–10. 10.1016/j.cej.2009.09.013. [DOI] [Google Scholar]
- Farrukh A.; Akram A.; Ghaffar A.; Hanif S.; Hamid A.; Duran H.; Yameen B. Design of Polymer-Brush-Grafted Magnetic Nanoparticles for Highly Efficient Water Remediation. ACS Appl. Mater. Interfaces 2013, 5, 3784–3793. 10.1021/am400427n. [DOI] [PubMed] [Google Scholar]
- Abdullah N.; Othaman R.; Abdullah I.; Jon N.; Baharum A. Studies on the Adsorption of Phenol Red Dye Using Silica-Filled ENR/PVC Beads. Journal of Emerging Trends in Engineering and Applied Sciences 2012, 3, 845–850. [Google Scholar]
- Mittal A.; Kaur D.; Malviya A.; Mittal J.; Gupta V. Adsorption Studies on the Removal of Coloring Agent Phenol Red from Wastewater Using Waste Materials as Adsorbents. J. Colloid Interface Sci. 2009, 337, 345–354. 10.1016/j.jcis.2009.05.016. [DOI] [PubMed] [Google Scholar]
- Zhou L.; Gao C.; Xu W. Magnetic Dendritic Materials for Highly Efficient Adsorption of Dyes and Drugs. ACS Appl. Mater. Interfaces 2010, 2, 1483–1491. 10.1021/am100114f. [DOI] [PubMed] [Google Scholar]
- Lin S.-H.; Juang R.-S. Adsorption of Phenol and Its Derivatives from Water Using Synthetic Resins and Low-Cost Natural Adsorbents: A Review. J. Environ. Manage. 2009, 90, 1336–1349. 10.1016/j.jenvman.2008.09.003. [DOI] [PubMed] [Google Scholar]
- Ahmaruzzaman M. Adsorption of Phenolic Compounds on Low-Cost Adsorbents: A Review. Adv. Colloid Interface Sci. 2008, 143, 48–67. 10.1016/j.cis.2008.07.002. [DOI] [PubMed] [Google Scholar]
Associated Data
This section collects any data citations, data availability statements, or supplementary materials included in this article.