

Abstract
Background
Non-healing bone defects represent an immense biomedical burden. Despite recent advances in protein based bone regeneration, safety concerns over bone morphogenetic protein-2 have prompted the search for alternative factors. Previously, we examined the additive/synergistic effects of Hedgehog (Hh) and Nel-like protein-1 (NELL-1) on the osteogenic differentiation of mesenchymal stem cells in vitro. Here, we sought to leverage our previous findings by applying the combination of Smoothened agonist (SAG), Hh signal activator, and NELL-1 to an in vivo critical size bone defect model.
Methods
A 4 mm parietal bone defect was created in mixed gender CD-1 mice. Treatment groups included control (n = 6), SAG (n = 7), NELL-1 (n = 7) or SAG + NELL-1 (n = 7). A custom fabricated poly(lactic-co-glycolic acid) disc with hydroxyapatite coating was used as an osteoinductive scaffold.
Results
Results at 4 and 8 weeks showed increased bone formation by micro-computed tomography analyses with either stimulus alone (SAG or NELL-1), but significantly greater bone formation with both components combined (SAG + NELL-1). This included greater bone healing scores, increased bone volume and bone thickness. Histologic analyses confirmed a significant increase in new bone formation with the combination therapy SAG + NELL-1, accompanied by increased defect vascularization.
Conclusions
In summary, our results suggest that combining the Hh signaling agonist SAG and NELL-1 has potential as a novel therapeutic strategy for the healing of critical-sized bone defects. Future directions will include optimization of dosage and delivery strategy for a SAG + NELL-1 combination product.
Introduction
One of the most serious clinical problems today involves the repair of critical-sized bone defects. Current strategies involve the use of adjunct applications such as autologous or allogeneic bone grafts to accelerate the formation of bone and fracture healing.1 Autologous bone grafts have been widely considered as the gold standard grafting material in orthopedics, neurosurgery, and dentistry. This grafting method is utilized in nearly 50,000 procedures in the United States alone and 2.2 million globally each year.2 This procedure, however, can be quite invasive with the potential for morbidity. Moreover, autologous bone grafting is not suitable for every patient as it is dependent on the availability and quality of the hosts’ bone.3–6 Thus, in the field of bone research, tissue-engineering modalities are increasingly focused on enhancement of osteogenesis in bone defects above a critical size. To date, many different types of bone graft substitute materials have been explored, including osteoconductive scaffolds, osteoprogenitor cells and/or osteoinductive factors.7
The recombinant human bone morphogenetic protein-2 (rhBMP-2, INFUSE®, Medtronic Sofamor Danek, Minneapolis, MN) is the most common osteogenic cytokine for orthopedic application. However, the supraphysiologic dosages of rhBMP-2 required for bone healing in humans (e.g. 1.5 mg/ml) have been linked to an increase in adverse side effects including native bone resorption, heterotopic bone formation, soft tissue swelling, dysphagia, and airway compromise.8 Thus, despite the brisk bone formation induced by rhBMP-2 in humans, a search for safer alternative growth and differentiation factors is warranted.
In adult tissue the Hedgehog (Hh) signaling pathway is a critical moderator of cell differentiation and demonstrates both pro-osteogenic and anti-adipogenic properties in mesenchymal stem cell (MSC).9, 10 In the context of post-natal osteogenesis or bone healing, Hh expression is first detected in the chondrocytes during early cartilage condensation and is later expressed primarily in the transitional region from proliferating to hypertrophic chondrocytes.11–13 It indirectly suppresses hypertrophic differentiation and is later involved in ossification.12
Hh ligands signal through a mechanism involving two transmembrane proteins: Patched (Ptc) and Smoothened (Smo). The initial phase of the Hh signaling activation is characterized by the binding of Hh proteins to a transmembrane receptor known as Ptc. In the absence of Hh ligand, Ptc suppresses Smo activity; binding of Hh to Ptc releases Smo, which then transmits the intracellular signaling cascade, resulting in increased transcription of downstream genes including glioblastoma gene products (Gli) transcription activators instead of transcriptional repressors.14 Smoothened agonist (SAG) is a small molecule that activates Hh signaling by high-throughput screening of chemical libraries, together with purmorphamine.15–19 SAG induces osteoblast markers in MSC20 and calvarial osteoblasts21, but results in either a modest21 or partial20 induction of osteoblastogenic programming. Therefore, SAG alone may be insufficient in promoting bone healing of a defect of critical size.
Nel-like protein-1 (NELL-1) is a differentiation factor that also plays a role in osteogenesis, discovered initially in patients with non-syndromic unilateral coronal synostosis.22 Research findings showed that an overexpression of Nell-1 gene in mice was linked to craniosynostosis-like phenotypes, calvarial bone overgrowth, and increased osteoblastic differentiation, whereas Nell-1 gene deficiency restricted bone growth.23 Mice with nonsense mutations in the Nell-1 gene have craniofacial, spine, and long bone anomalies that ultimately led to perinatal death.24, 25 NELL-1 also appears to selectively promote osteochondrogenic lineage differentiation in MSC, both in vitro and in vivo.26–30
Previously, we observed evidence of a combinatorial effect between Hh signaling and NELL-1 signaling in driving osteogenic differentiation of MSC in vitro.31 Moreover, chemical abrogation of Hh signaling impaired NELL-1-induced osteogenesis.31 However, in vitro studies alone cannot replicate the complex, local microenvironment of the bone defect. To create a better predictive modeling of human efficacy, the present study sought to extend our findings by manipulating NELL-1 and Hh signaling in a mouse calvarial bone defect model.
Materials and Methods
1. Preparation of scaffolds
Hydroxyapatite-coated poly(lactic-co-glycolic acid) (PLGA) was used as the scaffold or carrier for protein delivery which was fabricated from 85/15 poly(lacticcoglycolic acid) (inherent viscosity_0.61 dl/g; Birmingham Polymers, Pelham, AL, http://www.durect.com) by solvent casting and a particulate leaching process. Briefly mixed PLGA/chloroform was compressed into thin sheets in a Teflon mold to build a disc-shaped construct (diameter: 4 mm). After freeze-drying overnight, sucrose was dissolved from the scaffolds by immersion in three changes of double-distilled water (ddH2O). The scaffolds were then relocated from the Teflon plate for disinfection and drying. Sequentially dissolved CaCl2, MgCl26H2O, NaHCO3, and K2HPO43H2O in ddH2O, also known as simulated body fluid (SBF) solution, was prepared for apatite-coating. The solution’s pH was lowered to 6 by adding 1 M hydrochloric acid to enhance the solubility. Na2SO4, KCl, and NaCl were added to adjust the final pH to 6.5 (SBF 1). SBF (SBF 2), free of Mg2+ and HCO3− was formed by adding CaCl2 and K2HPO4 3H2O in ddH2O with pH adjusted to 6. KCl and NaCl were added to obtain a final pH of 6.8. All sterile solutions were filtered through a 0.22 mm polyethersulfone membrane (Nalgene). The PLGA scaffolds were incubated in SBF 1 for 12 hrs and then removed and placed in the SBF 2 solution for another 12 hrs at 37 °C with gentle agitation. Coated scaffolds were disinfected by soaking in 70% ethanol for 30 mins, a triple rinse in ddH2O, and finally dried under a laminar flow hood.
Four groups of scaffolds were coated by adsorbing with 0.01% DMSO (control) (n = 6 mice), SAG (1.0 mM) (n=7 mice), NELL-1 (600 μg/ml) (n = 7 mice), and SAG + NELL-1 (1.0 mM and 600 μg/ml, respectively) (n = 7 mice) in each 24 hrs before surgery. So as to control for any potential effects of the DMSO within SAG solution, all scaffolds were supplemented with equivalent concentration of DMSO solution. SAG was purchased from EMD Millipore Co. (Billerica, MD) and recombinant human NELL-1 was purified by Aragen Bioscience (Morgan Hill, CA). Dosages of SAG and NELL-1 were based on previously published studies.32, 33
2. Animal models and surgical procedure
Ten-week-old CD-1 mixed gender mice (n = 27) weighing 28 – 35 g were obtained from Charles River Laboratories (Wilmington, MA, USA) and were used for the experimentation according to the approved protocol of the Chancellor’s Animal Research Committee (ARC) of University of California, Los Angeles.
Preoperatively, buprenorphine (0.05 mg/kg) was injected subcutaneously for analgesic purposes. The mice were anesthetized with isoflurane (4 – 5% induction, 1.5 – 2.5% maintenance). Hair was shaved and skin was disinfected with three alternating betadine/alcohol scrubs. Bland ophthalmic ointment was applied to the eyes to prevent corneal desiccation. A heating pad (maintained at 37 °C) was used in the operating field. Under surgical magnifying Loupes, a dermal incision was made from the nasal bone to the middle sagittal crest, exposing the right parietal bone by removal of the pericranium. A non-healing, critical size (4 mm in diameter) full-thickness calvarial defect was created in the right parietal bone using a dental surgical drilling unit with a trephine under saline irrigation, avoiding damage to the bone sutures and the underlying dura. Carefully, the scaffold was placed within the defect in a shift-minimizing position (See Supplemental Digital Content 1, Figure shows the Mouse calvarial defect model. (A) Exposed calvarium after midline skin incision. (B) Calvarium exposed with 4 mm defect created by trephine burr in right parietal bone. (C) Bone defect created without damaging of the bone sutures and the underlying dura. Bone fragments removed revealing the dura mater. (D) 4 mm disc shaped PLGA scaffold placed in defect site. PLGA: Poly(lactic-co-glycolic acid). Scale bar = 1 mm. Arrow: dura mater. Arrowhead: cranial sutures, INSERT LINK). The skin incision was then sutured and the animal was monitored per established postoperative protocols.
3. In vivo live micro-computed tomography (micro-CT) imaging and analyses
Animals under general anesthesia (isoflurane, 4 – 5% induction, 1.5 – 2.5% maintenance) were scanned at 0, 4 and 8 weeks after surgery using a high-resolution micro-CT (SkyScan 1176, Bruker MicroCT N.V., Kontich, Belgium) at a resolution of 18 μm to evaluate healing of the bone defect. Scan settings: aluminum filter 0.5 mm, voltage 50 kVp, anode current 500 mA, exposure time 250 ms, frame averaging 2 and rotation step 0.4 degrees. After scanning, animals were observed for recovery before returning to the animal facility.
Three-dimensional (3D) images were constructed by implementing the Feldkamp algorithm and morphometric analyses were performed with CT-Analyzer software (SkyScan 1172, Belgium). A disc shaped region of interest (ROI) was defined with 4 mm diameter and 1 mm height to include all the new bone formation in the calvarial defect site (See Supplemental Digital Content 2, Figure shows the Region of interest defined for micro-CT analysis. A disc shaped region of interest was defined with 4 mm diameter and 1 mm height to include all new bone formation in the calvarial defect site, shown as the green area, INSERT LINK). Appropriate image corrections were adjusted including ring artifact correction, beam hardening correction, and fine-tuning using NRecon software (SkyScan 1172, Belgium).
Four mm sized bone defect was confirmed by analyzing immediate postoperative micro-CT images. (Immediate postoperative micro-CT images were analyzed in order to make sure minimal differences in the initial bone defect size) Then the amount of bone formation was analyzed and quantified in three different ways by comparing scans to identical images taken postoperatively. First, bone volume density (bone volume/tissue volume, BV/TV (%)) and bone mineral density (BMD, g/cm3) were calculated from binary X-ray images. Second, bone thickness (mm) was analyzed to detect new bone formation within the defect area. By using the maximum intensity projection tool of ImageJ software (National Institutes of Health, Bethesda, MD, USA) to re-project the 3D volume of interest onto a 2D plane, a 4 mm ROI was centered on the calvarial defect.34
Next, by using the marching cubes method to generate 3D rendered models for the visualization of analyzed regions, the extent of new-formed bone within the calvarial defect was scored. The bone healing score scale was applied to grade the quality of calvarial defect healing by three blinded observers according to previously determined methodologies.35 The score scale consisted of the following designations: 0 – no bone formation, 1 – few bony spicules dispersed through defect, 2 – bony bridging only at defect borders, 3 – bony bridging over partial length of defect, 4 – bony bridging entire span of defect at longest point.
4. Harvest and histologic analysis
Animals were euthanized for histology 8 weeks after the surgery by slow carbon dioxide (20 – 30% per mins) asphyxiation and cervical dislocation as a confirmatory method. Calvaria were harvested, paraformaldehyde fixed, 19% ethylenediaminetetraacetic acid decalcified, paraffin embedded, and sectioned at 5 μm thickness. Three slides were used per animal and all the animals were evaluated for histomorphometric analysis.
Hematoxylin and eosin (H & E), Masson’s trichrome and Picorosirius Red section staining were performed using the decalcified samples. Images of stained coronal cross-sections of each sample at the mid calvarial defect area were obtained under light microscopy and analyzed histomorphometrically using Adobe Photoshop software under the following parameters: Bone Area (B.Ar): Number of pixel per High Power Field (HPF), Fractional Bone Area (B.Ar/T.Ar): Bone as a fraction of Tissue Area (T.Ar), Blood Vessel Number (BV.N): Number of blood vessels per HPF, fractional Blood Vessel Area (BV.Ar/T.Ar): Number of pixels as a fraction of Tissue Area. 6 to 12 adjacent HPF on each image were analyzed to encompass the entire defect area of each sample on a representative section.
Immunohistochemical staining was performed, additional sections were incubated with the following primary anti-bodies: anti-CD31 (1:50, Abcam, Cambridge, MA), anti-Patched1 (Ptc1) (1:1000, Abcam, Cambridge, MA), and anti-Gli1 (1:500, Abcam, Cambridge, MA). The following secondary anti-bodies were used: biotinylated anti-rabbit or anti-goat IgG secondary antibody (1:200, Vector Laboratories Inc., Burlingame, CA). The paraffin slices were deparaffinized, dehydrated, rinsed, and incubated with 3% H2O2 for 20 minutes using the ABC (Vector Laboratories, Inc) method. Heat induced epitope retrieval was performed for 20 mins with steam, using 10mM sodium citrate buffer, pH 6.0. All sections were then blocked with 5% normal goat serum (Vector Laboratories Inc.) in PBS for 1 hr. Primary antibodies were added to each section at their respective dilutions and incubated at 37°C for 1 hour, then overnight at 4°C. Positive immunoreactivity was detected following ABC complex (PK-6100, Vectastain Elite ABC Kit, Vector Laboratories Inc.) incubation and development with DAB (Vector Laboratories Inc.). Mayer’s hematoxylin (Abcam) was used as a nuclear counterstain and slides were mounted using an aqueous media (Faramount, Dako, Carpentaria, CA).
5. Statistical analysis
Statistical analysis was performed using SPSS for Windows Version 18.0 (SPSS, Chicago, IL, USA). All data are shown as medians ± ranges. Statistical significance between 2 groups was evaluated by the Mann-Whitney U test. Kruskal–Wallis test with post hoc tests of Bonferoni was used in multiple group comparisons. Additionally, intra-class correlation coefficient (ICC) was analyzed to determine the inter- and intra-rater reliability of the subjective data from the three independent observer’s scores. Statistical significance was set at P < 0.05.
Results
1. Radiographic evaluation of bone regeneration
Micro-CT imaging and analysis was performed at zero, four and eight weeks after surgery, for serial follow up of bone formation. Minimal variation of calvarial defect size was determined by the micro-CT images and analysis at time zero (See Supplemental Digital Content 3, Figure shows the In vivo micro-CT image of the calvarial defect at week 0. In order to evaluate any differences in the initial calvarial defect size, in vivo micro-CT images and analyses were examined at week 0 (just after surgery). (A) Images and (B) quantification of defect diameter indicate minimal variation in the initial bone injury size. Boxplot shows the median along with the first and third quartiles. Error bar means data range from minimum to maximum, INSERT LINK). Post-operative results showed that all parameters related to the bone formation increased gradually over time (Fig. 1). As shown in the whole skull reconstructions (Fig. 1A) and quantitative 3D analyses of osteogenesis in micro-CT images (Fig. 1B,C), SAG treatment induced more osteogenesis mainly at the defect borders and a significant increase in BV/TV compared with control group at the eight week timepoint. NELL-1 treatment showed more bone bridging at the borders and over partial length of the defect, with a significant increase in both BV/TV and BMD compared with SAG group and control group at four and eight weeks. The combination of SAG + NELL-1 treatment showed the maximal new bone formation synergistically, with 34.1%/45.5% higher BV/TV and 16%/39.1% higher BMD compared to NELL-1 or SAG groups at the 8 week time point. Statistical changes between the four and eight week timepoints are shown in Supplemental Digital Content 4 (See Figure which shows a In vivo micro-CT quantification data, comparing 4 and 8 week timepoints. (A) A non-significant trend toward increasing BV/TV was observed between four and eights weeks within each treatment condition, with the exception of control treated defects. (B) A significant increase in BMD was observed between four and eight weeks within each treatment condition, with the exception of control treated defects. (C) A non-significant trend toward increasing bone healing score was observed between four and eight weeks within NELL-1 and SAG + NELL-1 treatment groups. Boxplot showing the median along with the first and third quartiles. Error bar means data range from minimum to maximum. BV/TV: Bone volume/Tissue volume, BMD: Bone mineral density, INSERT LINK). Between four and eight weeks, BMD significantly increased across treatment groups. BV/TV did not significantly change between the four and eight week timepoints.
Fig. 1. Micro-CT imaging and analysis.
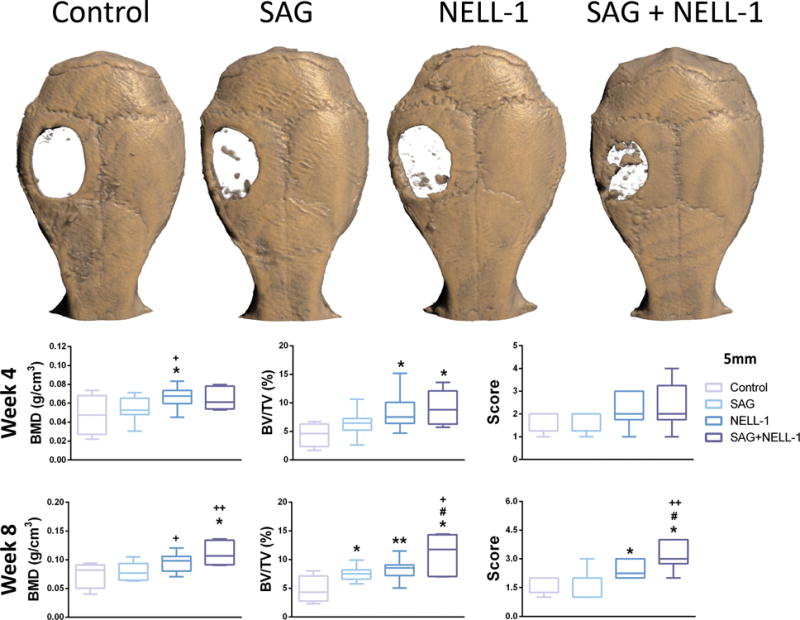
(A) Reconstructed micro-CT images taken at eight weeks postoperatively. Greatest new bone formation within the defect site was seen in SAG + NELL-1 treatment group. (B–D) Quantitative analysis of bone formation at defect site at four and eight weeks postoperatively, including (B) BMD, (C) BV/TV, and (D) bone healing score. The SAG + NELL-1 treatment group showed higher bone healing in general. *P < 0.05 and **P < 0.01 in comparison to control; +P < 0.05 and ++P < 0.01 in comparison to SAG alone; #P < 0.05 in comparison to NELL-1 alone. BMD: Bone mineral density, BV/TV: Bone volume/Tissue volume. Boxplot showing the median along with the first and third quartiles. Error bar means data range from minimum to maximum.
Next, bone healing scores were obtained by 3-blinded observers (Fig. 1D). Substantiating our findings by micro-CT reconstruction, the induction of bone healing was observed with SAG alone, NELL-1 alone as well as both SAG + NELL-1 in combination. The SAG + NELL-1 treatment group showed a significant higher bone healing score than all other groups, which was appreciated best at the eight week timepoint. ICCs for inter-observer agreement with 93.9% and 95.1% at the four and eight week timepoints, respectively. ICCs for intra-rater reliability of raters 1, 2 and 3 ranged from 94.1–98.4%.
Next, a bone thickness distribution map of the newly formed bone was analyzed based on micro-CT images (Fig. 2). In this representation, the thickest bone appears blue while the thinnest appears red (Fig. 2A). Consistent with our previous findings, the combination SAG + NELL-1 treatment showed maximal new bone thickness. Next, quantitative analyses of bone thickness were performed (Fig. 2B). Either SAG or NELL-1 treatment alone led to an increase in bone thickness, although NELL-1 treatment did not reach statistical significance. The combination treatment SAG + NELL-1 led to increased bone thickness as compared to either treatment alone.
Fig. 2. Bone thickness analysis.
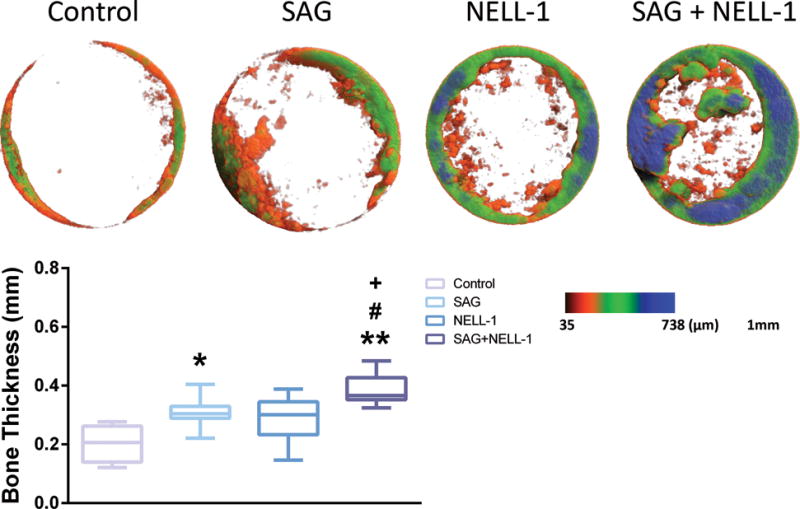
(A) Color maps of bone thickness distribution. Thickest bone density shown as blue and thinnest as red. (B) Mean bone thickness was calculated for each treatment. SAG + NELL-1 demonstrated higher bone thickness compared to either SAG or NELL-1 alone. *P < 0.05 and **P < 0.01 in comparison to control; +P < 0.05 in comparison to SAG alone; #P < 0.05 in comparison to NELL-1 alone. Boxplot showing the median along with the first and third quartiles. Error bar means data range from minimum to maximum.
2. Histologic evaluation of bone regeneration
Radiographic findings were confirmed qualitatively by histologic analysis (Fig. 3). H & E staining demonstrated that control treated samples showed a precipitous cut-off between the edge of the native parietal bone and adjacent fibrous tissue (Fig. 3A–C). The fibrous tissue of the non-ossified defect was intermixed with residual scaffold material (asterisk, Fig. 3C) and associated multinucleated foreign body giant cells (black arrowhead, Fig. 3C). In contrast, SAG + NELL-1 treatment resulted in a significant increase in new woven and lamellar bone formation, which was most prominent at the defect edge but was also scattered throughout the implantation site (Fig. 3J–L). Each treatment alone showed a similar increase in new bone formation, although the quantity of new bone was not as robust (Fig. 3D–I). Additional histologic stains were used to highlight the bone matrix (See Supplemental Digital Content 5, Figure shows a Histologic analysis. Representative histologic appearance of the defect site under control, SAG alone, NELL-1 alone or SAG + NELL-1 treatment conditions. (A–D) Picrosirius Red staining. White dashed lines indicate the demarcation of bone versus fibrous tissue. (E–H) Masson’s Trichrome staining. Images taken at eight weeks postoperative, and appear in coronal cross section at 40x magnification. Scale bar: 50 um, INSERT LINK). On Picrosirius Red stained sections (Supplemental Digital Content 5 A–D), organized and smooth layers of lamellar bone are highlighted in red and contrast with the ruffled and disorganized appearance of fibrous tissue. On Trichrome stained sections, the collagen in lamellar bone appears red (Supplemental Digital Content 5 E–H). Again, a qualitative increase in matrix deposition was observed with either treatment alone, and most prominently with the combination treatment SAG + NELL-1.
Fig. 3. Histologic analysis.
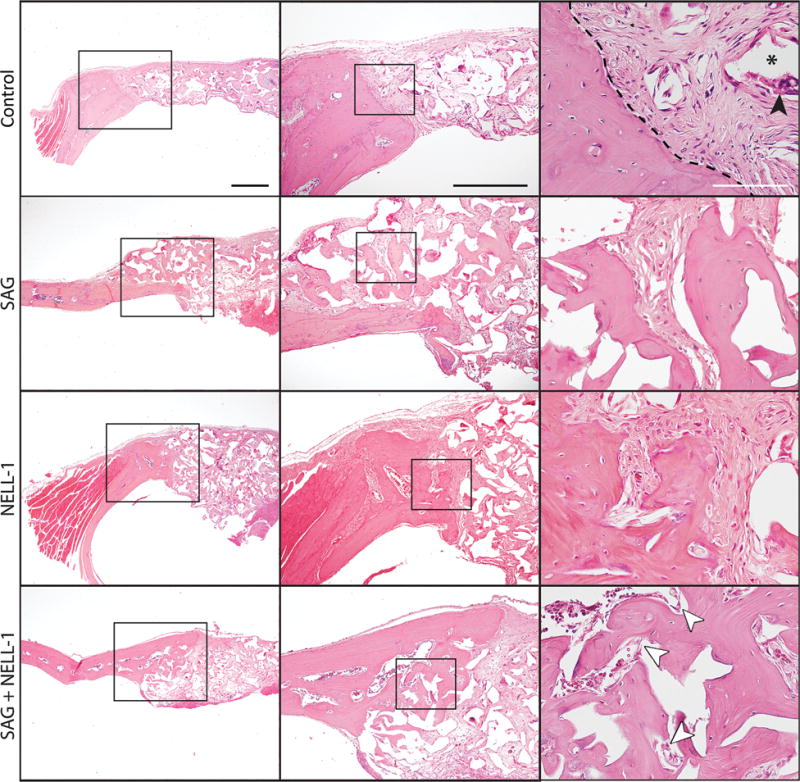
Representative histologic appearance of the defect site under control (A–C), SAG alone (D–F), NELL-1 alone (G–I) or SAG + NELL-1 treatment conditions (J–L). Images taken at eight weeks postoperative, and appear in coronal cross section at 4x, 10x and 40x magnifications using routine H & E staining. Black arrowhead: foreign body giant cell; asterisk: residual scaffold material; white arrowheads: blood vessels. Black dashed lines indicated the bone margin in relation to fibrous tissue. Black scale bar: 200 um; White scale bar: 50 um.
Next, histomorphometric analysis of the defect site was performed, examining either B.Ar or percentage B.Ar (Fig. 4). Confirming our micro-CT observations, either SAG or NELL-1 when applied alone resulted in a significant increase in both parameters of bone formation. Likewise and in agreement with micro-CT findings, the combination therapy SAG + NELL-1 resulted in significant increase in B.Ar and B.Ar/T.Ar, in comparison to either component alone.
Fig. 4. Histomorphometric analysis.
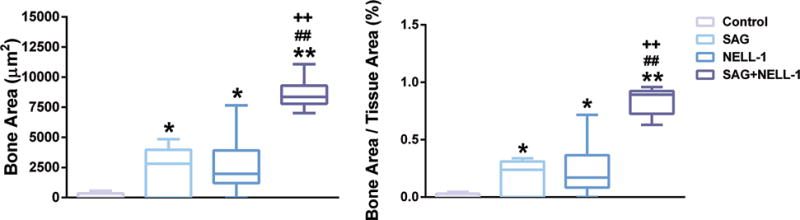
Analyses were performed at the study endpoint (8 weeks). Analyses included (left) B.Ar per HPF (pixel number per HPF), (right) Fractional Bone Area (B.Ar/T.Ar). *P < 0.05 and **P < 0.01 in comparison to control; ++P < 0.01 in comparison to SAG alone; ##P < 0.01 in comparison to NELL-1 alone. B.Ar: Bone Area, HPF: High power field, B.Ar/T.Ar: Bone Area/Tissue Area. Boxplot showing the median along with the first and third quartiles. Error bar means data range from minimum to maximum.
As mentioned, SAG exerts its pro-osteogenic effect via Hh signaling activation. To confirm that the applied SAG induced Hh signaling activity within the defect site, we used immunohistochemical detection for two reporters for Hh signaling activity, Ptc1 and Gli1 (See Supplemental Digital Content 6, Figure shows a Hh signaling analysis. (A) Representative immunohistochemical staining for Gli1, highlighting the presence of increased Hh signaling activity among SAG treated bone defects. (B) Representative immunohistochemical staining for Ptc1, highlighting the presence of increased Hh signaling activity among SAG treated bone defects. Arrowheads indicate representative positive staining among stromal or bone-lining cells. Scale bar: 50 um, INSERT LINK.). Hh signaling activity increases expression of Ptc1, which results in a negative feedback loop on Hh signaling activity. Gli1 (one of three Gli family members involved in Hh signaling activity) is the main positive regulator of Hh signaling, whose expression is also regulated by Hh signaling activity. Results showed that control treated defects showed scattered and low expression of either Gli1 or Ptc1. In contrast, a significant increase in Gli1 and Ptc1 immunoreactive cells was observed among SAG treated defects, both in stromal cells and bone-lining cells.
Finally, we observed by H & E staining a qualitative increase in neovascularization of the defect site among each treatment condition in comparison to control. We sought to confirm these differences by both immunohistochemical staining for CD31 (See Supplemental Digital Content 7, Figure shows the Defect vascularity analysis. (A) Representative immunohistochemical staining for CD31, highlighting the presence of increased vessels. (B,C) Histomorphometric quantification of defect vascularity, including (B) Blood Vessel Number (BV.N), and (C) fractional Blood Vessel Area (BV.Ar/T.Ar). Images taken at eight weeks postoperative, and appear in coronal cross section. Scale bar: 50 um. Boxplot showing the median along with the first and third quartiles. Error bar means data range from minimum to maximum. Scale bar: 50 um, INSERT LINK) and histomorphometric quantification of blood vessels within the defect site (Supplemental Digital Content 7 B,C). CD31 immunostaining indicated that each treatment (SAG alone, NELL-1 alone, and SAG + NELL-1) resulted in an increase defect vascularity (Supplemental Digital Content 7 A, SAG treated sample shown). Histomorphometric analysis of serial sections confirmed that each treatment resulted in an increase in blood vessel number (BV.N) and fractional blood vessel area (BV.Ar/T.Ar) (Supplemental Digital Content 7 B,C).
Discussion
Combination therapies could have potential for greater efficacy as compared to monotherapy due to the synergistic effects of the therapeutics involved.36–39 Researchers have previously reported that SAG, together with other materials, improves osteogenic differentiation and bone formation.31, 40, 41 For example, Maeda et al. reported successful bone healing by the combinatorial use of SAG and helioxanthin derivative (TH) without cell transplantation.32 As well, Kanke et al. used various small molecule inducers, such as SAG and TH under serum-free and feeder free conditions to create a stepwise differentiation protocol for osteoblast differentiation from pluripotent stem cells.42 In this in vivo study, we used small molecule SAG together with NELL-1 protein to enhance bone healing in a critical-sized defect model.
Despite having dissimilar pathways, Hh and NELL-1 have quite similar effects on progenitor cells/MSC, including pro-osteogenic and anti-adipocytic properties. These effects on MSC differentiation are quite dissimilar to other well-studied pathways such as bone morphogenetic protein (BMP) signaling and Insulin like growth factor (IGF) signaling43. BMP-2 and 7 are already available for clinical use in the orthopedic setting.44, 45 However, it should be noted that while the majority of BMPs promote osteogenic commitment in MSC,46, 47 BMPs also demonstrate pro-adipogenic effects.48, 49 Similarly, IGF signaling demonstrates dual pro-osteogenic and pro-adipogenic effects depending on the dose, cell type, and cell culture conditions.50, 51 In contrast to the BMP and IGF signaling pathways, our prior examination of Hh and NELL-1 signaling showed enhanced osteogenic differentiation and decreased adipogenesis.41 Therefore, upregulating Hh signaling by SAG would have beneficial effects in bone healing by suppressing adipogenic fate specification as well as actively promoting bone formation.
NELL-1 is a novel osteoinductive protein that has the potential to directly induce MSC proliferation and stimulate osteogenic differentiation principally via the induction of osteogenic programming.52 Specifically, NELL-1 can activate the Wnt/β-catenin signaling pathway through binding to integrin β153, Runt-related transcription factor-2 activity and phosphorylation54, and Mitogen-activated protein kinases signaling.55 Interestingly, we recently reported that NELL-1 inhibits adipogenic differentiation of 3T3-L1 pre-adipocytes as well as MSC via inhibition of the major adipogenic transcription factors, peroxisome proliferator-activated receptor γ and CCAAT/enhancer binding protein.56 We speculate that this anti-adipogenic effect of NELL-1 might be associated with activation of Hh signaling.10 Our previous publication also revealed the similarities in the phenotypes in cranial sutures between Hh signaling and NELL-1 gene deficient mice.56 Loss-of-function experiments of these showed that the role of Hh signaling in intramembranous bone ossification may overlap with that of NELL-1 signaling. Juxtaposition of mice with a defect in Hh signaling57 and mice with a defect in NELL-125 demonstrated similar decrease of thickness, growth, and extent of mineralization in cranial bones. However, the exact combinatorial or synergistic mechanisms between SAG and NELL-1 are still unclear, and further studies focusing on the molecular intersection of these two pathways is warranted.
An important limitation to this study is the use of recombinant NELL-1 protein rather than a second small molecule. Small molecules have several substantial advantages over their larger counterparts.58–64 Firstly, small molecule medications are often available for oral administration, an interesting method of delivery for future studies. Secondly, in general, small molecules do not elicit the unwanted immune responses.65 Thirdly, the bioactivity of small molecule compounds is not vitally dependent on higher order structural integrity.62, 66 In contrast, prior studies have suggested that assembly of NELL-1 into homo-oligomeric structures is at least partially required for its bioactive effects.67 Fourthly, the cost of manufacturing and risk of contamination can be considerably diminished by using small molecules.62 Unfortunately, no known small molecule has yet been developed as an agonist for NELL-1 signaling.
Conclusions
The combination of the small molecule SAG with NELL-1 recombinant protein demonstrates improved calvarial bone defect healing, in comparison to either stimulus alone. The dual manipulation of Hh and NELL-1 signaling represents a novel therapeutic strategy to stimulate bone repair.
Supplementary Material
(A) Exposed calvarium after midline skin incision. (B) Calvarium exposed with 4 mm defect created by trephine burr in right parietal bone. (C) Bone defect created without damaging of the bone sutures and the underlying dura. Bone fragments removed revealing the dura mater. (D) 4 mm disc shaped PLGA scaffold placed in defect site. PLGA: Poly(lactic-co-glycolic acid). Scale bar = 1 mm. Arrow: dura mater. Arrowhead: cranial sutures, INSERT LINK.
A disc shaped region of interest was defined with 4 mm diameter and 1 mm height to include all new bone formation in the calvarial defect site, shown as the green area, INSERT LINK.
In order to evaluate any differences in the initial calvarial defect size, in vivo micro-CT images and analyses were examined at week 0 (just after surgery). (A) Images and (B) quantification of defect diameter indicate minimal variation in the initial bone injury size. Boxplot shows the median along with the first and third quartiles. Error bar means data range from minimum to maximum, INSERT LINK.
(A) A non-significant trend toward increasing BV/TV was observed between four and eights weeks within each treatment condition, with the exception of control treated defects. (B) A significant increase in BMD was observed between four and eight weeks within each treatment condition, with the exception of control treated defects. (C) A non-significant trend toward increasing bone healing score was observed between four and eight weeks within NELL-1 and SAG + NELL-1 treatment groups. Boxplot showing the median along with the first and third quartiles. Error bar means data range from minimum to maximum. BV/TV: Bone volume/Tissue volume, BMD: Bone mineral density, INSERT LINK.
Representative histologic appearance of the defect site under control, SAG alone, NELL-1 alone or SAG + NELL-1 treatment conditions. (A–D) Picrosirius Red staining. White dashed lines indicate the demarcation of bone versus fibrous tissue. (E-H) Masson’s Trichrome staining. Images taken at eight weeks postoperative, and appear in coronal cross section at 40x magnification. Scale bar: 50 um, INSERT LINK.
(A) Representative immunohistochemical staining for Gli1, highlighting the presence of increased Hh signaling activity among SAG treated bone defects. (B) Representative immunohistochemical staining for Ptc1, highlighting the presence of increased Hh signaling activity among SAG treated bone defects. Arrowheads indicate representative positive staining among stromal or bone-lining cells. Scale bar: 50 um, INSERT LINK.
(A) Representative immunohistochemical staining for CD31, highlighting the presence of increased vessels. (B,C) Histomorphometric quantification of defect vascularity, including (B) Blood Vessel Number (BV.N), and (C) fractional Blood Vessel Area (BV.Ar/T.Ar). Images taken at eight weeks postoperative, and appear in coronal cross section. Scale bar: 50 um. Boxplot showing the median along with the first and third quartiles. Error bar means data range from minimum to maximum. Scale bar: 50 um, INSERT LINK.
Acknowledgments
Disclosures:
This work was supported by the NIH/NIAMS (grants R01 AR061399, R01 AR066782, K08 AR068316), the Orthopaedic Research and Education Foundation with funding provided by the Musculoskeletal Transplant Foundation, and the Korea Health Technology R&D Project through the Korea Health Industry Development Institute (KHIDI), funded by the Ministry of Health & Welfare, Republic of Korea (grant number: HI16C1559). Drs. KT and CS are inventors of NELL-1 related patents. Drs. KT and CS are founders of Bone Biologics Inc. which sublicenses NELL-1 patents from the UC Regents, which also hold equity in the company.
Author roles: Conduct of experiments, data analysis and interpretation: SL, CW, HCP, SS, JS, CM, CD, EC; Contribution of supplies and/or financial support: ML, CS, KT, AWJ; Experimental design and final manuscript preparation: SL, CW, AWJ. All authors have made substantive intellectual contribution to the development of the manuscript and meet ICMJE criteria for authorship.
References
- 1.Nandi SK, Roy S, Mukherjee P, Kundu B, De DK, Basu D. Orthopaedic applications of bone graft & graft substitutes: a review. Indian J Med Res. 2010;132:15–30. [PubMed] [Google Scholar]
- 2.Giannoudis PV, Dinopoulos H, Tsiridis E. Bone substitutes: an update. Injury. 2005;36(Suppl 3):S20–27. doi: 10.1016/j.injury.2005.07.029. [DOI] [PubMed] [Google Scholar]
- 3.Silber JS, Anderson DG, Daffner SD, et al. Donor site morbidity after anterior iliac crest bone harvest for single-level anterior cervical discectomy and fusion. Spine. 2003;28:134–139. doi: 10.1097/00007632-200301150-00008. [DOI] [PubMed] [Google Scholar]
- 4.Younger EM, Chapman MW. Morbidity at bone graft donor sites. Journal of orthopaedic trauma. 1989;3:192–195. doi: 10.1097/00005131-198909000-00002. [DOI] [PubMed] [Google Scholar]
- 5.Ahlmann E, Patzakis M, Roidis N, Shepherd L, Holtom P. Comparison of anterior and posterior iliac crest bone grafts in terms of harvest-site morbidity and functional outcomes. The Journal of bone and joint surgery American volume. 2002;84-a:716–720. doi: 10.2106/00004623-200205000-00003. [DOI] [PubMed] [Google Scholar]
- 6.Marsell R, Einhorn TA. Emerging bone healing therapies. Journal of orthopaedic trauma. 2010;24(Suppl 1):S4–8. doi: 10.1097/BOT.0b013e3181ca3fab. [DOI] [PubMed] [Google Scholar]
- 7.Miyazaki M, Tsumura H, Wang JC, Alanay A. An update on bone substitutes for spinal fusion. European spine journal: official publication of the European Spine Society, the European Spinal Deformity Society, and the European Section of the Cervical Spine Research Society. 2009;18:783–799. doi: 10.1007/s00586-009-0924-x. [DOI] [PMC free article] [PubMed] [Google Scholar]
- 8.Carragee EJ, Hurwitz EL, Weiner BK. A critical review of recombinant human bone morphogenetic protein-2 trials in spinal surgery: emerging safety concerns and lessons learned. The spine journal: official journal of the North American Spine Society. 2011;11:471–491. doi: 10.1016/j.spinee.2011.04.023. [DOI] [PubMed] [Google Scholar]
- 9.Ma X, Zhang X, Jia Y, et al. Dexamethasone induces osteogenesis via regulation of hedgehog signalling molecules in rat mesenchymal stem cells. Int Orthop. 2013;37:1399–1404. doi: 10.1007/s00264-013-1902-9. [DOI] [PMC free article] [PubMed] [Google Scholar]
- 10.Fontaine C, Cousin W, Plaisant M, Dani C, Peraldi P. Hedgehog signaling alters adipocyte maturation of human mesenchymal stem cells. Stem cells (Dayton, Ohio) 2008;26:1037–1046. doi: 10.1634/stemcells.2007-0974. [DOI] [PubMed] [Google Scholar]
- 11.Bitgood MJ, McMahon AP. Hedgehog and Bmp genes are coexpressed at many diverse sites of cell-cell interaction in the mouse embryo. Dev Biol. 1995;172:126–138. doi: 10.1006/dbio.1995.0010. [DOI] [PubMed] [Google Scholar]
- 12.Vortkamp A, Lee K, Lanske B, Segre GV, Kronenberg HM, Tabin CJ. Regulation of rate of cartilage differentiation by Indian hedgehog and PTH-related protein. Science. 1996;273:613–622. doi: 10.1126/science.273.5275.613. [DOI] [PubMed] [Google Scholar]
- 13.Vortkamp A, Pathi S, Peretti GM, Caruso EM, Zaleske DJ, Tabin CJ. Recapitulation of signals regulating embryonic bone formation during postnatal growth and in fracture repair. Mech Dev. 1998;71:65–76. doi: 10.1016/s0925-4773(97)00203-7. [DOI] [PubMed] [Google Scholar]
- 14.James AW. Review of Signaling Pathways Governing MSC Osteogenic and Adipogenic Differentiation. Scientifica. 2013;2013:684736. doi: 10.1155/2013/684736. [DOI] [PMC free article] [PubMed] [Google Scholar]
- 15.Chen JK, Taipale J, Young KE, Maiti T, Beachy PA. Small molecule modulation of Smoothened activity. Proceedings of the National Academy of Sciences of the United States of America. 2002;99:14071–14076. doi: 10.1073/pnas.182542899. [DOI] [PMC free article] [PubMed] [Google Scholar]
- 16.Frank-Kamenetsky M, Zhang XM, Bottega S, et al. Small-molecule modulators of Hedgehog signaling: identification and characterization of Smoothened agonists and antagonists. Journal of biology. 2002;1:10. doi: 10.1186/1475-4924-1-10. [DOI] [PMC free article] [PubMed] [Google Scholar]
- 17.Gorojankina T, Hoch L, Faure H, et al. Discovery, molecular and pharmacological characterization of GSA-10, a novel small-molecule positive modulator of Smoothened. Molecular pharmacology. 2013;83:1020–1029. doi: 10.1124/mol.112.084590. [DOI] [PubMed] [Google Scholar]
- 18.Sinha S, Chen JK. Purmorphamine activates the Hedgehog pathway by targeting Smoothened. Nature chemical biology. 2006;2:29–30. doi: 10.1038/nchembio753. [DOI] [PubMed] [Google Scholar]
- 19.Wu X, Ding S, Ding Q, Gray NS, Schultz PG. A small molecule with osteogenesis-inducing activity in multipotent mesenchymal progenitor cells. Journal of the American Chemical Society. 2002;124:14520–14521. doi: 10.1021/ja0283908. [DOI] [PubMed] [Google Scholar]
- 20.Hojo H, Ohba S, Yano F, et al. Gli1 protein participates in Hedgehog-mediated specification of osteoblast lineage during endochondral ossification. J Biol Chem. 2012;287:17860–17869. doi: 10.1074/jbc.M112.347716. [DOI] [PMC free article] [PubMed] [Google Scholar]
- 21.Lee S, Shen J, Pan H, et al. Calvarial Defect Healing Induced by Small Molecule Smoothened Agonist. Tissue Enginereing Part A. doi: 10.1089/ten.tea.2016.0167. [DOI] [PMC free article] [PubMed] [Google Scholar]
- 22.Ting K, Vastardis H, Mulliken JB, et al. Human NELL-1 expressed in unilateral coronal synostosis. J Bone Miner Res. 1999;14:80–89. doi: 10.1359/jbmr.1999.14.1.80. [DOI] [PubMed] [Google Scholar]
- 23.Zhang X, Kuroda S, Carpenter D, et al. Craniosynostosis in transgenic mice overexpressing Nell-1. J Clin Invest. 2002;110:861–870. doi: 10.1172/JCI15375. [DOI] [PMC free article] [PubMed] [Google Scholar]
- 24.Desai J, Shannon ME, Johnson MD, et al. Nell1-deficient mice have reduced expression of extracellular matrix proteins causing cranial and vertebral defects. Human molecular genetics. 2006;15:1329–1341. doi: 10.1093/hmg/ddl053. [DOI] [PubMed] [Google Scholar]
- 25.Zhang X, Ting K, Pathmanathan D, et al. Calvarial cleidocraniodysplasia-like defects with ENU-induced Nell-1 deficiency. J Craniofac Surg. 2012;23:61–66. doi: 10.1097/SCS.0b013e318240c8c4. [DOI] [PMC free article] [PubMed] [Google Scholar]
- 26.Aghaloo T, Cowan CM, Chou YF, et al. Nell-1-induced bone regeneration in calvarial defects. Am J Pathol. 2006;169:903–915. doi: 10.2353/ajpath.2006.051210. [DOI] [PMC free article] [PubMed] [Google Scholar]
- 27.Cowan CM, Cheng S, Ting K, et al. Nell-1 induced bone formation within the distracted intermaxillary suture. Bone. 2006;38:48–58. doi: 10.1016/j.bone.2005.06.023. [DOI] [PubMed] [Google Scholar]
- 28.Cowan CM, Jiang X, Hsu T, et al. Synergistic effects of Nell-1 and BMP-2 on the osteogenic differentiation of myoblasts. J Bone Miner Res. 2007;22:918–930. doi: 10.1359/jbmr.070312. [DOI] [PMC free article] [PubMed] [Google Scholar]
- 29.Lu SS, Zhang X, Soo C, et al. The osteoinductive properties of Nell-1 in a rat spinal fusion model. Spine J. 2007;7:50–60. doi: 10.1016/j.spinee.2006.04.020. [DOI] [PubMed] [Google Scholar]
- 30.Siu RK, Lu SS, Li W, et al. Nell-1 protein promotes bone formation in a sheep spinal fusion model. Tissue Eng Part A. 2011;17:1123–1135. doi: 10.1089/ten.tea.2010.0486. [DOI] [PMC free article] [PubMed] [Google Scholar]
- 31.James AW, Pang S, Askarinam A, et al. Additive effects of sonic hedgehog and Nell-1 signaling in osteogenic versus adipogenic differentiation of human adipose-derived stromal cells. Stem Cells Dev. 2012;21:2170–2178. doi: 10.1089/scd.2011.0461. [DOI] [PMC free article] [PubMed] [Google Scholar]
- 32.Maeda Y, Hojo H, Shimohata N, et al. Bone healing by sterilizable calcium phosphate tetrapods eluting osteogenic molecules. Biomaterials. 2013;34:5530–5537. doi: 10.1016/j.biomaterials.2013.03.089. [DOI] [PubMed] [Google Scholar]
- 33.Shen J, James AW, Zhang X, et al. Novel Wnt Regulator NEL-Like Molecule-1 Antagonizes Adipogenesis and Augments Osteogenesis Induced by Bone Morphogenetic Protein 2. Am J Pathol. 2016;186:419–434. doi: 10.1016/j.ajpath.2015.10.011. [DOI] [PMC free article] [PubMed] [Google Scholar]
- 34.Umoh JU, Sampaio AV, Welch I, et al. In vivo micro-CT analysis of bone remodeling in a rat calvarial defect model. Physics in medicine and biology. 2009;54:2147–2161. doi: 10.1088/0031-9155/54/7/020. [DOI] [PubMed] [Google Scholar]
- 35.Spicer PP, Kretlow JD, Young S, Jansen JA, Kasper FK, Mikos AG. Evaluation of bone regeneration using the rat critical size calvarial defect. Nature protocols. 2012;7:1918–1929. doi: 10.1038/nprot.2012.113. [DOI] [PMC free article] [PubMed] [Google Scholar]
- 36.Lane D. Designer combination therapy for cancer. Nat Biotechnol. 2006;24:163–164. doi: 10.1038/nbt0206-163. [DOI] [PubMed] [Google Scholar]
- 37.Lehar J, Krueger AS, Avery W, et al. Synergistic drug combinations tend to improve therapeutically relevant selectivity. Nat Biotechnol. 2009;27:659–666. doi: 10.1038/nbt.1549. [DOI] [PMC free article] [PubMed] [Google Scholar]
- 38.Peer D, Karp JM, Hong S, Farokhzad OC, Margalit R, Langer R. Nanocarriers as an emerging platform for cancer therapy. Nat Nanotechnol. 2007;2:751–760. doi: 10.1038/nnano.2007.387. [DOI] [PubMed] [Google Scholar]
- 39.Sun TM, Du JZ, Yao YD, et al. Simultaneous delivery of siRNA and paclitaxel via a “two-in-one” micelleplex promotes synergistic tumor suppression. ACS Nano. 2011;5:1483–1494. doi: 10.1021/nn103349h. [DOI] [PubMed] [Google Scholar]
- 40.Yuasa T, Kataoka H, Kinto N, et al. Sonic hedgehog is involved in osteoblast differentiation by cooperating with BMP-2. Journal of cellular physiology. 2002;193:225–232. doi: 10.1002/jcp.10166. [DOI] [PubMed] [Google Scholar]
- 41.James AW, Leucht P, Levi B, et al. Sonic Hedgehog influences the balance of osteogenesis and adipogenesis in mouse adipose-derived stromal cells. Tissue Eng Part A. 2010;16:2605–2616. doi: 10.1089/ten.tea.2010.0048. [DOI] [PMC free article] [PubMed] [Google Scholar]
- 42.Kanke K, Masaki H, Saito T, et al. Stepwise differentiation of pluripotent stem cells into osteoblasts using four small molecules under serum-free and feeder-free conditions. Stem Cell Reports. 2014;2:751–760. doi: 10.1016/j.stemcr.2014.04.016. [DOI] [PMC free article] [PubMed] [Google Scholar]
- 43.Akune T, Ogata N, Hoshi K, et al. Insulin receptor substrate-2 maintains predominance of anabolic function over catabolic function of osteoblasts. J Cell Biol. 2002;159:147–156. doi: 10.1083/jcb.200204046. [DOI] [PMC free article] [PubMed] [Google Scholar]
- 44.Bessa PC, Casal M, Reis RL. Bone morphogenetic proteins in tissue engineering: the road from laboratory to clinic, part II (BMP delivery) Journal of tissue engineering and regenerative medicine. 2008;2:81–96. doi: 10.1002/term.74. [DOI] [PubMed] [Google Scholar]
- 45.Jung RE, Windisch SI, Eggenschwiler AM, Thoma DS, Weber FE, Hammerle CH. A randomized-controlled clinical trial evaluating clinical and radiological outcomes after 3 and 5 years of dental implants placed in bone regenerated by means of GBR techniques with or without the addition of BMP-2. Clinical oral implants research. 2009;20:660–666. doi: 10.1111/j.1600-0501.2008.01648.x. [DOI] [PubMed] [Google Scholar]
- 46.Dorman LJ, Tucci M, Benghuzzi H. In vitro effects of bmp-2, bmp-7, and bmp-13 on proliferation and differentation of mouse mesenchymal stem cells. Biomedical sciences instrumentation. 2012;48:81–87. [PubMed] [Google Scholar]
- 47.Kang Q, Song WX, Luo Q, et al. A comprehensive analysis of the dual roles of BMPs in regulating adipogenic and osteogenic differentiation of mesenchymal progenitor cells. Stem Cells Dev. 2009;18:545–559. doi: 10.1089/scd.2008.0130. [DOI] [PMC free article] [PubMed] [Google Scholar]
- 48.Chen D, Ji X, Harris MA, et al. Differential roles for bone morphogenetic protein (BMP) receptor type IB and IA in differentiation and specification of mesenchymal precursor cells to osteoblast and adipocyte lineages. J Cell Biol. 1998;142:295–305. doi: 10.1083/jcb.142.1.295. [DOI] [PMC free article] [PubMed] [Google Scholar]
- 49.Wang EA, Israel DI, Kelly S, Luxenberg DP. Bone morphogenetic protein-2 causes commitment and differentiation in C3H10T1/2 and 3T3 cells. Growth factors (Chur, Switzerland) 1993;9:57–71. doi: 10.3109/08977199308991582. [DOI] [PubMed] [Google Scholar]
- 50.Holly J, Sabin M, Perks C, Shield J. Adipogenesis and IGF-1. Metab Syndr Relat Disord. 2006;4:43–50. doi: 10.1089/met.2006.4.43. [DOI] [PubMed] [Google Scholar]
- 51.Levi B, James AW, Wan DC, Glotzbach JP, Commons GW, Longaker MT. Regulation of human adipose-derived stromal cell osteogenic differentiation by insulin-like growth factor-1 and platelet-derived growth factor-alpha. Plast Reconstr Surg. 2010;126:41–52. doi: 10.1097/PRS.0b013e3181da8858. [DOI] [PMC free article] [PubMed] [Google Scholar]
- 52.Pang S, Shen J, Liu Y, et al. Proliferation and osteogenic differentiation of mesenchymal stem cells induced by a short isoform of NELL-1. Stem cells (Dayton, Ohio) 2015;33:904–915. doi: 10.1002/stem.1884. [DOI] [PMC free article] [PubMed] [Google Scholar]
- 53.Fraser JK, Zhu M, Wulur I, Alfonso Z. Adipose-derived stem cells. Methods Mol Biol. 2008;449:59–67. doi: 10.1007/978-1-60327-169-1_4. [DOI] [PubMed] [Google Scholar]
- 54.Shen J, James AW, Chung J, et al. NELL-1 promotes cell adhesion and differentiation via Integrinbeta1. Journal of cellular biochemistry. 2012;113:3620–3628. doi: 10.1002/jcb.24253. [DOI] [PubMed] [Google Scholar]
- 55.Aghaloo T, Jiang X, Soo C, et al. A study of the role of nell-1 gene modified goat bone marrow stromal cells in promoting new bone formation. Molecular therapy: the journal of the American Society of Gene Therapy. 2007;15:1872–1880. doi: 10.1038/sj.mt.6300270. [DOI] [PMC free article] [PubMed] [Google Scholar]
- 56.James AW, Pan A, Chiang M, et al. A new function of Nell-1 protein in repressing adipogenic differentiation. Biochem Biophys Res Commun. 2011;411:126–131. doi: 10.1016/j.bbrc.2011.06.111. [DOI] [PMC free article] [PubMed] [Google Scholar]
- 57.Lenton K, James AW, Manu A, et al. Indian hedgehog positively regulates calvarial ossification and modulates bone morphogenetic protein signaling. Genesis (New York, NY: 2000) 2011;49:784–796. doi: 10.1002/dvg.20768. [DOI] [PubMed] [Google Scholar]
- 58.Fu K, Klibanov AM, Langer R. Protein stability in controlled-release systems. Nature biotechnology. 2000;18:24–25. doi: 10.1038/71875. [DOI] [PubMed] [Google Scholar]
- 59.Han QQ, Du Y, Yang PS. The role of small molecules in bone regeneration. Future medicinal chemistry. 2013;5:1671–1684. doi: 10.4155/fmc.13.133. [DOI] [PubMed] [Google Scholar]
- 60.Hwang CJ, Vaccaro AR, Lawrence JP, et al. Immunogenicity of bone morphogenetic proteins. Journal of neurosurgery Spine. 2009;10:443–451. doi: 10.3171/2009.1.SPINE08473. [DOI] [PubMed] [Google Scholar]
- 61.Kessler M, Goldsmith D, Schellekens H. Immunogenicity of biopharmaceuticals. Nephrology, dialysis, transplantation: official publication of the European Dialysis and Transplant Association - European Renal Association. 2006;21(Suppl 5):v9–12. doi: 10.1093/ndt/gfl476. [DOI] [PubMed] [Google Scholar]
- 62.Lo KW, Ashe KM, Kan HM, Laurencin CT. The role of small molecules in musculoskeletal regeneration. Regenerative medicine. 2012;7:535–549. doi: 10.2217/rme.12.33. [DOI] [PMC free article] [PubMed] [Google Scholar]
- 63.Lo KW, Jiang T, Gagnon KA, Nelson C, Laurencin CT. Small-molecule based musculoskeletal regenerative engineering. Trends in biotechnology. 2014;32:74–81. doi: 10.1016/j.tibtech.2013.12.002. [DOI] [PMC free article] [PubMed] [Google Scholar]
- 64.Segar CE, Ogle ME, Botchwey EA. Regulation of angiogenesis and bone regeneration with natural and synthetic small molecules. Current pharmaceutical design. 2013;19:3403–3419. doi: 10.2174/1381612811319190007. [DOI] [PubMed] [Google Scholar]
- 65.Laurencin CT, Ashe KM, Henry N, Kan HM, Lo KW. Delivery of small molecules for bone regenerative engineering: preclinical studies and potential clinical applications. Drug discovery today. 2014;19:794–800. doi: 10.1016/j.drudis.2014.01.012. [DOI] [PMC free article] [PubMed] [Google Scholar]
- 66.Wieghaus KA, Capitosti SM, Anderson CR, et al. Small molecule inducers of angiogenesis for tissue engineering. Tissue engineering. 2006;12:1903–1913. doi: 10.1089/ten.2006.12.1903. [DOI] [PubMed] [Google Scholar]
- 67.Nakamura Y, Hasebe A, Takahashi K, et al. Oligomerization-induced conformational change in the C-terminal region of Nel-like molecule 1 (NELL1) protein is necessary for the efficient mediation of murine MC3T3-E1 cell adhesion and spreading. The Journal of biological chemistry. 2014;289:9781–9794. doi: 10.1074/jbc.M113.507020. [DOI] [PMC free article] [PubMed] [Google Scholar]
Associated Data
This section collects any data citations, data availability statements, or supplementary materials included in this article.
Supplementary Materials
(A) Exposed calvarium after midline skin incision. (B) Calvarium exposed with 4 mm defect created by trephine burr in right parietal bone. (C) Bone defect created without damaging of the bone sutures and the underlying dura. Bone fragments removed revealing the dura mater. (D) 4 mm disc shaped PLGA scaffold placed in defect site. PLGA: Poly(lactic-co-glycolic acid). Scale bar = 1 mm. Arrow: dura mater. Arrowhead: cranial sutures, INSERT LINK.
A disc shaped region of interest was defined with 4 mm diameter and 1 mm height to include all new bone formation in the calvarial defect site, shown as the green area, INSERT LINK.
In order to evaluate any differences in the initial calvarial defect size, in vivo micro-CT images and analyses were examined at week 0 (just after surgery). (A) Images and (B) quantification of defect diameter indicate minimal variation in the initial bone injury size. Boxplot shows the median along with the first and third quartiles. Error bar means data range from minimum to maximum, INSERT LINK.
(A) A non-significant trend toward increasing BV/TV was observed between four and eights weeks within each treatment condition, with the exception of control treated defects. (B) A significant increase in BMD was observed between four and eight weeks within each treatment condition, with the exception of control treated defects. (C) A non-significant trend toward increasing bone healing score was observed between four and eight weeks within NELL-1 and SAG + NELL-1 treatment groups. Boxplot showing the median along with the first and third quartiles. Error bar means data range from minimum to maximum. BV/TV: Bone volume/Tissue volume, BMD: Bone mineral density, INSERT LINK.
Representative histologic appearance of the defect site under control, SAG alone, NELL-1 alone or SAG + NELL-1 treatment conditions. (A–D) Picrosirius Red staining. White dashed lines indicate the demarcation of bone versus fibrous tissue. (E-H) Masson’s Trichrome staining. Images taken at eight weeks postoperative, and appear in coronal cross section at 40x magnification. Scale bar: 50 um, INSERT LINK.
(A) Representative immunohistochemical staining for Gli1, highlighting the presence of increased Hh signaling activity among SAG treated bone defects. (B) Representative immunohistochemical staining for Ptc1, highlighting the presence of increased Hh signaling activity among SAG treated bone defects. Arrowheads indicate representative positive staining among stromal or bone-lining cells. Scale bar: 50 um, INSERT LINK.
(A) Representative immunohistochemical staining for CD31, highlighting the presence of increased vessels. (B,C) Histomorphometric quantification of defect vascularity, including (B) Blood Vessel Number (BV.N), and (C) fractional Blood Vessel Area (BV.Ar/T.Ar). Images taken at eight weeks postoperative, and appear in coronal cross section. Scale bar: 50 um. Boxplot showing the median along with the first and third quartiles. Error bar means data range from minimum to maximum. Scale bar: 50 um, INSERT LINK.